

Key Insights
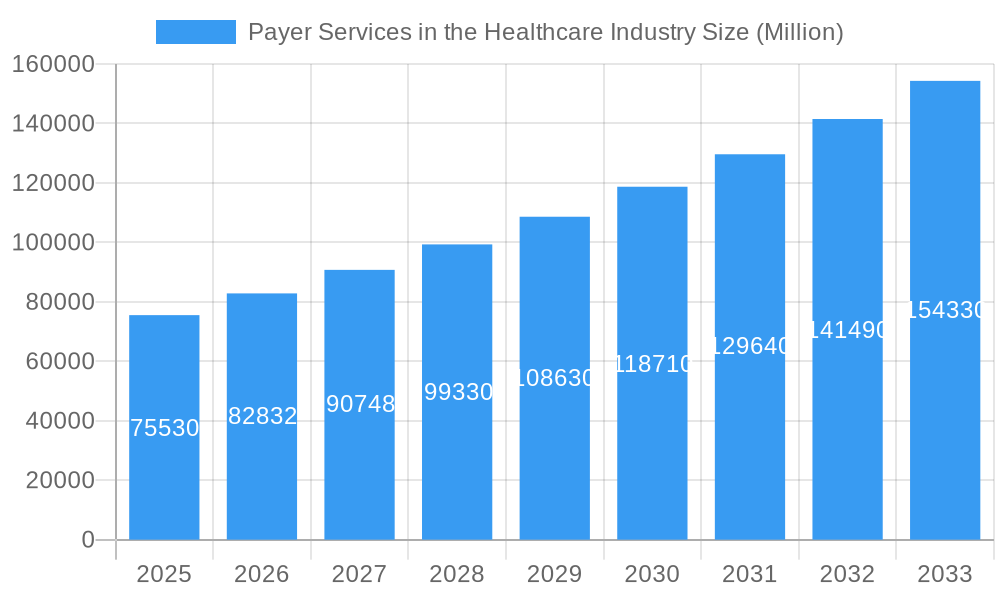
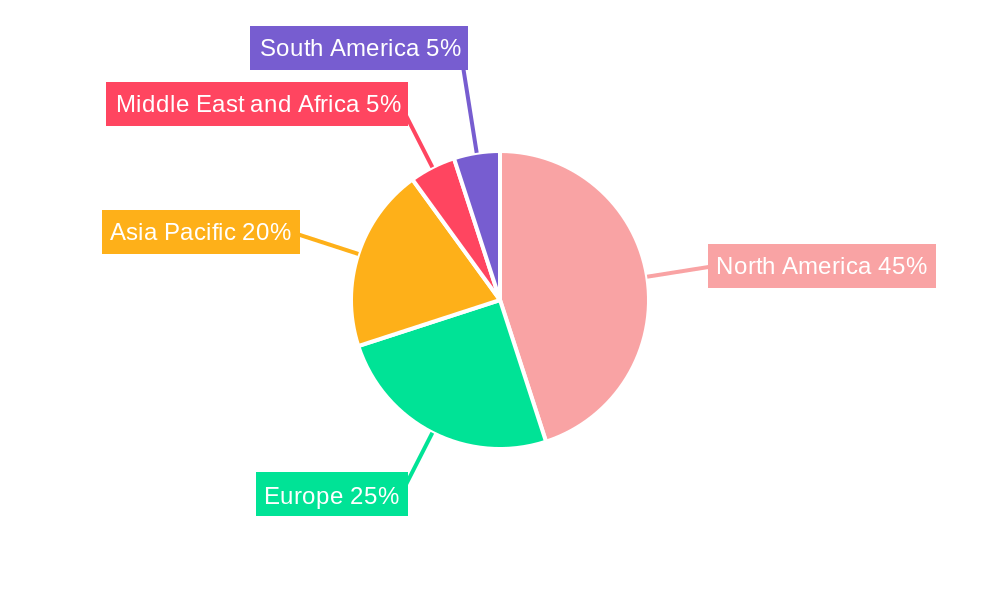
The global payer services market in the healthcare industry, valued at $75.53 billion in 2025, is projected to experience robust growth, driven by several key factors. The increasing adoption of value-based care models necessitates efficient claims processing and member management, fueling demand for comprehensive payer services. Technological advancements, such as AI-powered analytics and cloud-based solutions for fraud detection and risk management, are further accelerating market expansion. The rising prevalence of chronic diseases and an aging global population contribute significantly to the growing need for efficient healthcare administration, boosting the demand for outsourcing services across various application areas, including claims management, billing, and member services. The market is segmented by end-user (private and public payers), service type (business process outsourcing, IT outsourcing, and knowledge process outsourcing), and application (claims management, member management, provider management, billing, analytics, and HR services). North America currently holds a significant market share due to advanced healthcare infrastructure and high adoption of technology. However, Asia-Pacific is anticipated to witness substantial growth driven by increasing healthcare spending and government initiatives promoting digital health solutions.
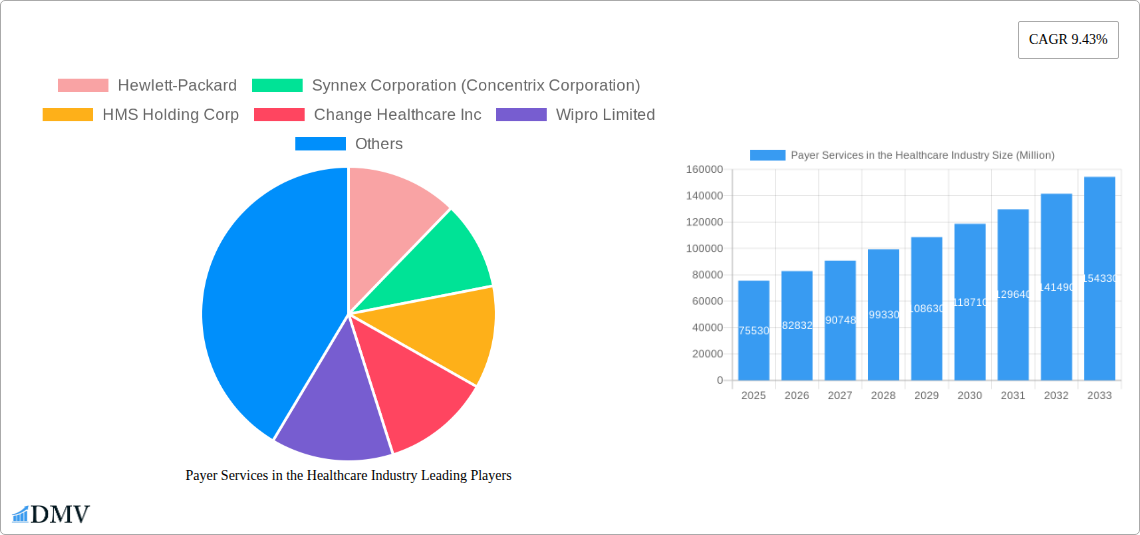
Payer Services in the Healthcare Industry Market Size (In Billion)
The competitive landscape is characterized by a mix of established players, including Hewlett-Packard, Accenture, Cognizant, and Wipro, and specialized healthcare IT companies like Change Healthcare and McKesson. These companies are investing heavily in innovation to provide integrated and comprehensive payer services, often incorporating advanced analytics and automation to improve operational efficiency and reduce costs. Future growth will likely be influenced by government regulations related to data privacy and security, along with the increasing demand for personalized and proactive member engagement strategies. The market's continued expansion is expected to be supported by the rising need for streamlined administrative processes, enhanced data analytics capabilities, and the ongoing digital transformation of the healthcare industry. The projected CAGR of 9.43% suggests a significant market expansion over the forecast period (2025-2033), with substantial opportunities for businesses offering innovative and scalable solutions.
Payer Services in the Healthcare Industry Company Market Share
Payer Services in the Healthcare Industry: A Comprehensive Market Report (2019-2033)
This insightful report provides a comprehensive analysis of the Payer Services market in the healthcare industry, offering a detailed forecast from 2025 to 2033. With a focus on key market trends, technological advancements, and competitive landscapes, this report is an invaluable resource for stakeholders seeking to understand and capitalize on the growth opportunities within this dynamic sector. The study period covers 2019-2033, with 2025 serving as the base and estimated year. The report incorporates data from the historical period (2019-2024) and presents a detailed forecast for 2025-2033. The market is valued at xx Million in 2025 and is projected to reach xx Million by 2033, exhibiting a CAGR of xx%.
Payer Services in the Healthcare Industry Market Composition & Trends
This section delves into the intricate composition of the Payer Services market, examining market concentration, innovation catalysts, regulatory landscapes, substitute products, end-user profiles, and M&A activities. The market is characterized by a moderately concentrated landscape, with top players like McKESSON Corporation and Change Healthcare Inc. holding significant market share. However, the entry of technology giants like Accenture PLC and Wipro Limited is intensifying competition. Innovation is driven by the need for improved efficiency, cost reduction, and enhanced patient experience. Regulatory changes, particularly regarding data privacy (HIPAA) and interoperability, significantly impact market dynamics. Substitute products, such as self-service portals and telehealth platforms, are steadily gaining traction. The market is segmented by end-users (Private Payers, Public Payers), service types (Business Process Outsourcing, IT Outsourcing Services, Knowledge Process Outsourcing (KPO) Services), and applications (Claims management, Member management, Provider management, Billing, Analytics, and HR services).
- Market Share Distribution (2025): McKESSON Corporation (xx%), Change Healthcare Inc. (xx%), Accenture PLC (xx%), Others (xx%).
- M&A Activity (2019-2024): A total of xx M&A deals valued at approximately xx Million were recorded, driven primarily by consolidation and expansion strategies.
Payer Services in the Healthcare Industry Industry Evolution
This section analyzes the evolution of the Payer Services industry, exploring market growth trajectories, technological advancements, and shifting consumer demands. The market has experienced significant growth over the past few years, fueled by increasing healthcare expenditure, the adoption of value-based care models, and the growing prevalence of chronic diseases. Technological advancements such as AI, machine learning, and blockchain are transforming service delivery, enabling improved accuracy, efficiency, and fraud detection. Consumers increasingly demand personalized, convenient, and cost-effective healthcare solutions. The shift towards digitalization, including telehealth and remote patient monitoring, presents both opportunities and challenges for payer services providers. The market witnessed a growth rate of xx% from 2019 to 2024, and is expected to grow at a CAGR of xx% from 2025 to 2033. The adoption rate of AI-powered solutions is estimated at xx% in 2025, projected to increase to xx% by 2033.
Leading Regions, Countries, or Segments in Payer Services in the Healthcare Industry
This section identifies the dominant regions, countries, and segments within the Payer Services market. North America currently holds the largest market share, driven by high healthcare expenditure and advanced technological infrastructure. However, the Asia-Pacific region is anticipated to witness significant growth in the coming years due to increasing healthcare investments and a rising middle class.
- Key Drivers:
- North America: High healthcare spending, advanced technological adoption, stringent regulations, and a mature market.
- Asia-Pacific: Rising healthcare expenditure, increasing prevalence of chronic diseases, government initiatives, and a growing middle class.
- Business Process Outsourcing (BPO): Cost savings, improved efficiency, and access to specialized expertise.
- Claims Management Services: High volume of claims processing, need for accuracy and efficiency.
The dominance of North America stems from the high concentration of major payers and established IT infrastructure. The Asia-Pacific region's growth is propelled by its large and expanding population base and rising disposable incomes. The BPO segment dominates due to its cost-effectiveness and scalability. The high volume and complexity of claims processing drive significant demand for claims management services.
Payer Services in the Healthcare Industry Product Innovations
Recent innovations in payer services include AI-powered claims processing systems that reduce manual intervention and improve accuracy, advanced analytics tools for fraud detection and risk management, and integrated platforms that streamline member and provider interactions. These innovations offer unique selling propositions such as reduced operational costs, improved efficiency, and enhanced patient experiences. The integration of blockchain technology enhances data security and transparency.
Propelling Factors for Payer Services in the Healthcare Industry Growth
Several factors propel the growth of the Payer Services market. Technological advancements, such as AI and cloud computing, are automating processes and enhancing efficiency. The increasing adoption of value-based care models incentivizes payers to invest in innovative solutions that improve patient outcomes and reduce costs. Favorable regulatory environments in several regions further stimulate market growth. The shift towards digital health and telehealth platforms is also driving demand for integrated payer services.
Obstacles in the Payer Services in the Healthcare Industry Market
The Payer Services market faces challenges including stringent data privacy regulations, the complexity of integrating legacy systems, cybersecurity threats, and the rising costs associated with adopting new technologies. Supply chain disruptions and the increasing competition from both established players and new entrants pose further obstacles. These factors could potentially decrease market growth by xx% by 2033 if not effectively addressed.
Future Opportunities in Payer Services in the Healthcare Industry
Future opportunities lie in expanding into emerging markets, developing specialized solutions for niche segments, and leveraging emerging technologies such as the Internet of Medical Things (IoMT) and precision medicine. The growing adoption of telemedicine and remote patient monitoring creates opportunities for integrated payer services. Focusing on data analytics and personalized healthcare solutions can also unlock significant growth potential.
Major Players in the Payer Services in the Healthcare Industry Ecosystem
Key Developments in Payer Services in the Healthcare Industry Industry
- 2022 Q3: Change Healthcare Inc. launched a new AI-powered claims processing solution.
- 2023 Q1: Accenture PLC acquired a specialized healthcare analytics firm.
- 2024 Q4: McKESSON Corporation partnered with a major telehealth provider. (Further details on specific developments would be included in the full report.)
Strategic Payer Services in the Healthcare Industry Market Forecast
The Payer Services market is poised for sustained growth driven by the increasing adoption of technology, the shift towards value-based care, and the growing demand for personalized healthcare solutions. The market's future trajectory will be shaped by advancements in AI, big data analytics, and blockchain technology. Continued investment in digital health initiatives and expanding into underserved markets will create significant growth opportunities for key players. The market's long-term prospects remain positive, with substantial potential for innovation and expansion.
Payer Services in the Healthcare Industry Segmentation
-
1. Service Type
- 1.1. Business Process Outsourcing
- 1.2. IT Outsourcing Services
- 1.3. Knowledge Process Outsourcing (KPO) Services
-
2. Application
- 2.1. Claims management services
- 2.2. Integrat
- 2.3. Member management services
- 2.4. Provider management services
- 2.5. Billing and accounts management services
- 2.6. Analytics and fraud management services
- 2.7. Human Resource Services
-
3. End User
- 3.1. Private Payers
- 3.2. Public Payers
Payer Services in the Healthcare Industry Segmentation By Geography
-
1. North America
- 1.1. United States
- 1.2. Canada
- 1.3. Mexico
-
2. Europe
- 2.1. Germany
- 2.2. United Kingdom
- 2.3. France
- 2.4. Italy
- 2.5. Spain
- 2.6. Rest of Europe
-
3. Asia Pacific
- 3.1. China
- 3.2. Japan
- 3.3. India
- 3.4. Australia
- 3.5. South Korea
- 3.6. Rest of Asia Pacific
-
4. Middle East and Africa
- 4.1. GCC
- 4.2. South Africa
- 4.3. Rest of Middle East and Africa
-
5. South America
- 5.1. Brazil
- 5.2. Argentina
- 5.3. Rest of South America
Payer Services in the Healthcare Industry Regional Market Share
Geographic Coverage of Payer Services in the Healthcare Industry
Payer Services in the Healthcare Industry REPORT HIGHLIGHTS
| Aspects | Details |
|---|---|
| Study Period | 2020-2034 |
| Base Year | 2025 |
| Estimated Year | 2026 |
| Forecast Period | 2026-2034 |
| Historical Period | 2020-2025 |
| Growth Rate | CAGR of 9.43% from 2020-2034 |
| Segmentation |
|
Table of Contents
- 1. Introduction
- 1.1. Research Scope
- 1.2. Market Segmentation
- 1.3. Research Objective
- 1.4. Definitions and Assumptions
- 2. Executive Summary
- 2.1. Market Snapshot
- 3. Market Dynamics
- 3.1. Market Drivers
- 3.2. Market Restrains
- 3.3. Market Trends
- 3.4. Market Opportunities
- 4. Market Factor Analysis
- 4.1. Porters Five Forces
- 4.1.1. Bargaining Power of Suppliers
- 4.1.2. Bargaining Power of Buyers
- 4.1.3. Threat of New Entrants
- 4.1.4. Threat of Substitutes
- 4.1.5. Competitive Rivalry
- 4.2. PESTEL analysis
- 4.3. BCG Analysis
- 4.3.1. Stars (High Growth, High Market Share)
- 4.3.2. Cash Cows (Low Growth, High Market Share)
- 4.3.3. Question Mark (High Growth, Low Market Share)
- 4.3.4. Dogs (Low Growth, Low Market Share)
- 4.4. Ansoff Matrix Analysis
- 4.5. Supply Chain Analysis
- 4.6. Regulatory Landscape
- 4.7. Current Market Potential and Opportunity Assessment (TAM–SAM–SOM Framework)
- 4.8. DMV Analyst Note
- 4.1. Porters Five Forces
- 5. Market Analysis, Insights and Forecast 2021-2033
- 5.1. Market Analysis, Insights and Forecast - by Service Type
- 5.1.1. Business Process Outsourcing
- 5.1.2. IT Outsourcing Services
- 5.1.3. Knowledge Process Outsourcing (KPO) Services
- 5.2. Market Analysis, Insights and Forecast - by Application
- 5.2.1. Claims management services
- 5.2.2. Integrat
- 5.2.3. Member management services
- 5.2.4. Provider management services
- 5.2.5. Billing and accounts management services
- 5.2.6. Analytics and fraud management services
- 5.2.7. Human Resource Services
- 5.3. Market Analysis, Insights and Forecast - by End User
- 5.3.1. Private Payers
- 5.3.2. Public Payers
- 5.4. Market Analysis, Insights and Forecast - by Region
- 5.4.1. North America
- 5.4.2. Europe
- 5.4.3. Asia Pacific
- 5.4.4. Middle East and Africa
- 5.4.5. South America
- 5.1. Market Analysis, Insights and Forecast - by Service Type
- 6. Global Payer Services in the Healthcare Industry Analysis, Insights and Forecast, 2021-2033
- 6.1. Market Analysis, Insights and Forecast - by Service Type
- 6.1.1. Business Process Outsourcing
- 6.1.2. IT Outsourcing Services
- 6.1.3. Knowledge Process Outsourcing (KPO) Services
- 6.2. Market Analysis, Insights and Forecast - by Application
- 6.2.1. Claims management services
- 6.2.2. Integrat
- 6.2.3. Member management services
- 6.2.4. Provider management services
- 6.2.5. Billing and accounts management services
- 6.2.6. Analytics and fraud management services
- 6.2.7. Human Resource Services
- 6.3. Market Analysis, Insights and Forecast - by End User
- 6.3.1. Private Payers
- 6.3.2. Public Payers
- 6.1. Market Analysis, Insights and Forecast - by Service Type
- 7. North America Payer Services in the Healthcare Industry Analysis, Insights and Forecast, 2020-2032
- 7.1. Market Analysis, Insights and Forecast - by Service Type
- 7.1.1. Business Process Outsourcing
- 7.1.2. IT Outsourcing Services
- 7.1.3. Knowledge Process Outsourcing (KPO) Services
- 7.2. Market Analysis, Insights and Forecast - by Application
- 7.2.1. Claims management services
- 7.2.2. Integrat
- 7.2.3. Member management services
- 7.2.4. Provider management services
- 7.2.5. Billing and accounts management services
- 7.2.6. Analytics and fraud management services
- 7.2.7. Human Resource Services
- 7.3. Market Analysis, Insights and Forecast - by End User
- 7.3.1. Private Payers
- 7.3.2. Public Payers
- 7.1. Market Analysis, Insights and Forecast - by Service Type
- 8. Europe Payer Services in the Healthcare Industry Analysis, Insights and Forecast, 2020-2032
- 8.1. Market Analysis, Insights and Forecast - by Service Type
- 8.1.1. Business Process Outsourcing
- 8.1.2. IT Outsourcing Services
- 8.1.3. Knowledge Process Outsourcing (KPO) Services
- 8.2. Market Analysis, Insights and Forecast - by Application
- 8.2.1. Claims management services
- 8.2.2. Integrat
- 8.2.3. Member management services
- 8.2.4. Provider management services
- 8.2.5. Billing and accounts management services
- 8.2.6. Analytics and fraud management services
- 8.2.7. Human Resource Services
- 8.3. Market Analysis, Insights and Forecast - by End User
- 8.3.1. Private Payers
- 8.3.2. Public Payers
- 8.1. Market Analysis, Insights and Forecast - by Service Type
- 9. Asia Pacific Payer Services in the Healthcare Industry Analysis, Insights and Forecast, 2020-2032
- 9.1. Market Analysis, Insights and Forecast - by Service Type
- 9.1.1. Business Process Outsourcing
- 9.1.2. IT Outsourcing Services
- 9.1.3. Knowledge Process Outsourcing (KPO) Services
- 9.2. Market Analysis, Insights and Forecast - by Application
- 9.2.1. Claims management services
- 9.2.2. Integrat
- 9.2.3. Member management services
- 9.2.4. Provider management services
- 9.2.5. Billing and accounts management services
- 9.2.6. Analytics and fraud management services
- 9.2.7. Human Resource Services
- 9.3. Market Analysis, Insights and Forecast - by End User
- 9.3.1. Private Payers
- 9.3.2. Public Payers
- 9.1. Market Analysis, Insights and Forecast - by Service Type
- 10. Middle East and Africa Payer Services in the Healthcare Industry Analysis, Insights and Forecast, 2020-2032
- 10.1. Market Analysis, Insights and Forecast - by Service Type
- 10.1.1. Business Process Outsourcing
- 10.1.2. IT Outsourcing Services
- 10.1.3. Knowledge Process Outsourcing (KPO) Services
- 10.2. Market Analysis, Insights and Forecast - by Application
- 10.2.1. Claims management services
- 10.2.2. Integrat
- 10.2.3. Member management services
- 10.2.4. Provider management services
- 10.2.5. Billing and accounts management services
- 10.2.6. Analytics and fraud management services
- 10.2.7. Human Resource Services
- 10.3. Market Analysis, Insights and Forecast - by End User
- 10.3.1. Private Payers
- 10.3.2. Public Payers
- 10.1. Market Analysis, Insights and Forecast - by Service Type
- 11. South America Payer Services in the Healthcare Industry Analysis, Insights and Forecast, 2020-2032
- 11.1. Market Analysis, Insights and Forecast - by Service Type
- 11.1.1. Business Process Outsourcing
- 11.1.2. IT Outsourcing Services
- 11.1.3. Knowledge Process Outsourcing (KPO) Services
- 11.2. Market Analysis, Insights and Forecast - by Application
- 11.2.1. Claims management services
- 11.2.2. Integrat
- 11.2.3. Member management services
- 11.2.4. Provider management services
- 11.2.5. Billing and accounts management services
- 11.2.6. Analytics and fraud management services
- 11.2.7. Human Resource Services
- 11.3. Market Analysis, Insights and Forecast - by End User
- 11.3.1. Private Payers
- 11.3.2. Public Payers
- 11.1. Market Analysis, Insights and Forecast - by Service Type
- 12. Competitive Analysis
- 12.1. Company Profiles
- 12.1.1 Hewlett-Packard
- 12.1.1.1. Company Overview
- 12.1.1.2. Products
- 12.1.1.3. Company Financials
- 12.1.1.4. SWOT Analysis
- 12.1.2 Synnex Corporation (Concentrix Corporation)
- 12.1.2.1. Company Overview
- 12.1.2.2. Products
- 12.1.2.3. Company Financials
- 12.1.2.4. SWOT Analysis
- 12.1.3 HMS Holding Corp
- 12.1.3.1. Company Overview
- 12.1.3.2. Products
- 12.1.3.3. Company Financials
- 12.1.3.4. SWOT Analysis
- 12.1.4 Change Healthcare Inc
- 12.1.4.1. Company Overview
- 12.1.4.2. Products
- 12.1.4.3. Company Financials
- 12.1.4.4. SWOT Analysis
- 12.1.5 Wipro Limited
- 12.1.5.1. Company Overview
- 12.1.5.2. Products
- 12.1.5.3. Company Financials
- 12.1.5.4. SWOT Analysis
- 12.1.6 Accenture PLC
- 12.1.6.1. Company Overview
- 12.1.6.2. Products
- 12.1.6.3. Company Financials
- 12.1.6.4. SWOT Analysis
- 12.1.7 Xerox Corporation
- 12.1.7.1. Company Overview
- 12.1.7.2. Products
- 12.1.7.3. Company Financials
- 12.1.7.4. SWOT Analysis
- 12.1.8 HCL Technologies Ltd
- 12.1.8.1. Company Overview
- 12.1.8.2. Products
- 12.1.8.3. Company Financials
- 12.1.8.4. SWOT Analysis
- 12.1.9 Dell Inc
- 12.1.9.1. Company Overview
- 12.1.9.2. Products
- 12.1.9.3. Company Financials
- 12.1.9.4. SWOT Analysis
- 12.1.10 Cognizant Technology Solutions
- 12.1.10.1. Company Overview
- 12.1.10.2. Products
- 12.1.10.3. Company Financials
- 12.1.10.4. SWOT Analysis
- 12.1.11 McKESSON Corporation
- 12.1.11.1. Company Overview
- 12.1.11.2. Products
- 12.1.11.3. Company Financials
- 12.1.11.4. SWOT Analysis
- 12.1.12 Genpact Limited
- 12.1.12.1. Company Overview
- 12.1.12.2. Products
- 12.1.12.3. Company Financials
- 12.1.12.4. SWOT Analysis
- 12.1.1 Hewlett-Packard
- 12.2. Market Entropy
- 12.2.1 Company's Key Areas Served
- 12.2.2 Recent Developments
- 12.3. Company Market Share Analysis 2025
- 12.3.1 Top 5 Companies Market Share Analysis
- 12.3.2 Top 3 Companies Market Share Analysis
- 12.4. List of Potential Customers
- 13. Research Methodology
List of Figures
- Figure 1: Global Payer Services in the Healthcare Industry Revenue Breakdown (Million, %) by Region 2025 & 2033
- Figure 2: North America Payer Services in the Healthcare Industry Revenue (Million), by Service Type 2025 & 2033
- Figure 3: North America Payer Services in the Healthcare Industry Revenue Share (%), by Service Type 2025 & 2033
- Figure 4: North America Payer Services in the Healthcare Industry Revenue (Million), by Application 2025 & 2033
- Figure 5: North America Payer Services in the Healthcare Industry Revenue Share (%), by Application 2025 & 2033
- Figure 6: North America Payer Services in the Healthcare Industry Revenue (Million), by End User 2025 & 2033
- Figure 7: North America Payer Services in the Healthcare Industry Revenue Share (%), by End User 2025 & 2033
- Figure 8: North America Payer Services in the Healthcare Industry Revenue (Million), by Country 2025 & 2033
- Figure 9: North America Payer Services in the Healthcare Industry Revenue Share (%), by Country 2025 & 2033
- Figure 10: Europe Payer Services in the Healthcare Industry Revenue (Million), by Service Type 2025 & 2033
- Figure 11: Europe Payer Services in the Healthcare Industry Revenue Share (%), by Service Type 2025 & 2033
- Figure 12: Europe Payer Services in the Healthcare Industry Revenue (Million), by Application 2025 & 2033
- Figure 13: Europe Payer Services in the Healthcare Industry Revenue Share (%), by Application 2025 & 2033
- Figure 14: Europe Payer Services in the Healthcare Industry Revenue (Million), by End User 2025 & 2033
- Figure 15: Europe Payer Services in the Healthcare Industry Revenue Share (%), by End User 2025 & 2033
- Figure 16: Europe Payer Services in the Healthcare Industry Revenue (Million), by Country 2025 & 2033
- Figure 17: Europe Payer Services in the Healthcare Industry Revenue Share (%), by Country 2025 & 2033
- Figure 18: Asia Pacific Payer Services in the Healthcare Industry Revenue (Million), by Service Type 2025 & 2033
- Figure 19: Asia Pacific Payer Services in the Healthcare Industry Revenue Share (%), by Service Type 2025 & 2033
- Figure 20: Asia Pacific Payer Services in the Healthcare Industry Revenue (Million), by Application 2025 & 2033
- Figure 21: Asia Pacific Payer Services in the Healthcare Industry Revenue Share (%), by Application 2025 & 2033
- Figure 22: Asia Pacific Payer Services in the Healthcare Industry Revenue (Million), by End User 2025 & 2033
- Figure 23: Asia Pacific Payer Services in the Healthcare Industry Revenue Share (%), by End User 2025 & 2033
- Figure 24: Asia Pacific Payer Services in the Healthcare Industry Revenue (Million), by Country 2025 & 2033
- Figure 25: Asia Pacific Payer Services in the Healthcare Industry Revenue Share (%), by Country 2025 & 2033
- Figure 26: Middle East and Africa Payer Services in the Healthcare Industry Revenue (Million), by Service Type 2025 & 2033
- Figure 27: Middle East and Africa Payer Services in the Healthcare Industry Revenue Share (%), by Service Type 2025 & 2033
- Figure 28: Middle East and Africa Payer Services in the Healthcare Industry Revenue (Million), by Application 2025 & 2033
- Figure 29: Middle East and Africa Payer Services in the Healthcare Industry Revenue Share (%), by Application 2025 & 2033
- Figure 30: Middle East and Africa Payer Services in the Healthcare Industry Revenue (Million), by End User 2025 & 2033
- Figure 31: Middle East and Africa Payer Services in the Healthcare Industry Revenue Share (%), by End User 2025 & 2033
- Figure 32: Middle East and Africa Payer Services in the Healthcare Industry Revenue (Million), by Country 2025 & 2033
- Figure 33: Middle East and Africa Payer Services in the Healthcare Industry Revenue Share (%), by Country 2025 & 2033
- Figure 34: South America Payer Services in the Healthcare Industry Revenue (Million), by Service Type 2025 & 2033
- Figure 35: South America Payer Services in the Healthcare Industry Revenue Share (%), by Service Type 2025 & 2033
- Figure 36: South America Payer Services in the Healthcare Industry Revenue (Million), by Application 2025 & 2033
- Figure 37: South America Payer Services in the Healthcare Industry Revenue Share (%), by Application 2025 & 2033
- Figure 38: South America Payer Services in the Healthcare Industry Revenue (Million), by End User 2025 & 2033
- Figure 39: South America Payer Services in the Healthcare Industry Revenue Share (%), by End User 2025 & 2033
- Figure 40: South America Payer Services in the Healthcare Industry Revenue (Million), by Country 2025 & 2033
- Figure 41: South America Payer Services in the Healthcare Industry Revenue Share (%), by Country 2025 & 2033
List of Tables
- Table 1: Global Payer Services in the Healthcare Industry Revenue Million Forecast, by Service Type 2020 & 2033
- Table 2: Global Payer Services in the Healthcare Industry Revenue Million Forecast, by Application 2020 & 2033
- Table 3: Global Payer Services in the Healthcare Industry Revenue Million Forecast, by End User 2020 & 2033
- Table 4: Global Payer Services in the Healthcare Industry Revenue Million Forecast, by Region 2020 & 2033
- Table 5: Global Payer Services in the Healthcare Industry Revenue Million Forecast, by Service Type 2020 & 2033
- Table 6: Global Payer Services in the Healthcare Industry Revenue Million Forecast, by Application 2020 & 2033
- Table 7: Global Payer Services in the Healthcare Industry Revenue Million Forecast, by End User 2020 & 2033
- Table 8: Global Payer Services in the Healthcare Industry Revenue Million Forecast, by Country 2020 & 2033
- Table 9: United States Payer Services in the Healthcare Industry Revenue (Million) Forecast, by Application 2020 & 2033
- Table 10: Canada Payer Services in the Healthcare Industry Revenue (Million) Forecast, by Application 2020 & 2033
- Table 11: Mexico Payer Services in the Healthcare Industry Revenue (Million) Forecast, by Application 2020 & 2033
- Table 12: Global Payer Services in the Healthcare Industry Revenue Million Forecast, by Service Type 2020 & 2033
- Table 13: Global Payer Services in the Healthcare Industry Revenue Million Forecast, by Application 2020 & 2033
- Table 14: Global Payer Services in the Healthcare Industry Revenue Million Forecast, by End User 2020 & 2033
- Table 15: Global Payer Services in the Healthcare Industry Revenue Million Forecast, by Country 2020 & 2033
- Table 16: Germany Payer Services in the Healthcare Industry Revenue (Million) Forecast, by Application 2020 & 2033
- Table 17: United Kingdom Payer Services in the Healthcare Industry Revenue (Million) Forecast, by Application 2020 & 2033
- Table 18: France Payer Services in the Healthcare Industry Revenue (Million) Forecast, by Application 2020 & 2033
- Table 19: Italy Payer Services in the Healthcare Industry Revenue (Million) Forecast, by Application 2020 & 2033
- Table 20: Spain Payer Services in the Healthcare Industry Revenue (Million) Forecast, by Application 2020 & 2033
- Table 21: Rest of Europe Payer Services in the Healthcare Industry Revenue (Million) Forecast, by Application 2020 & 2033
- Table 22: Global Payer Services in the Healthcare Industry Revenue Million Forecast, by Service Type 2020 & 2033
- Table 23: Global Payer Services in the Healthcare Industry Revenue Million Forecast, by Application 2020 & 2033
- Table 24: Global Payer Services in the Healthcare Industry Revenue Million Forecast, by End User 2020 & 2033
- Table 25: Global Payer Services in the Healthcare Industry Revenue Million Forecast, by Country 2020 & 2033
- Table 26: China Payer Services in the Healthcare Industry Revenue (Million) Forecast, by Application 2020 & 2033
- Table 27: Japan Payer Services in the Healthcare Industry Revenue (Million) Forecast, by Application 2020 & 2033
- Table 28: India Payer Services in the Healthcare Industry Revenue (Million) Forecast, by Application 2020 & 2033
- Table 29: Australia Payer Services in the Healthcare Industry Revenue (Million) Forecast, by Application 2020 & 2033
- Table 30: South Korea Payer Services in the Healthcare Industry Revenue (Million) Forecast, by Application 2020 & 2033
- Table 31: Rest of Asia Pacific Payer Services in the Healthcare Industry Revenue (Million) Forecast, by Application 2020 & 2033
- Table 32: Global Payer Services in the Healthcare Industry Revenue Million Forecast, by Service Type 2020 & 2033
- Table 33: Global Payer Services in the Healthcare Industry Revenue Million Forecast, by Application 2020 & 2033
- Table 34: Global Payer Services in the Healthcare Industry Revenue Million Forecast, by End User 2020 & 2033
- Table 35: Global Payer Services in the Healthcare Industry Revenue Million Forecast, by Country 2020 & 2033
- Table 36: GCC Payer Services in the Healthcare Industry Revenue (Million) Forecast, by Application 2020 & 2033
- Table 37: South Africa Payer Services in the Healthcare Industry Revenue (Million) Forecast, by Application 2020 & 2033
- Table 38: Rest of Middle East and Africa Payer Services in the Healthcare Industry Revenue (Million) Forecast, by Application 2020 & 2033
- Table 39: Global Payer Services in the Healthcare Industry Revenue Million Forecast, by Service Type 2020 & 2033
- Table 40: Global Payer Services in the Healthcare Industry Revenue Million Forecast, by Application 2020 & 2033
- Table 41: Global Payer Services in the Healthcare Industry Revenue Million Forecast, by End User 2020 & 2033
- Table 42: Global Payer Services in the Healthcare Industry Revenue Million Forecast, by Country 2020 & 2033
- Table 43: Brazil Payer Services in the Healthcare Industry Revenue (Million) Forecast, by Application 2020 & 2033
- Table 44: Argentina Payer Services in the Healthcare Industry Revenue (Million) Forecast, by Application 2020 & 2033
- Table 45: Rest of South America Payer Services in the Healthcare Industry Revenue (Million) Forecast, by Application 2020 & 2033
Frequently Asked Questions
1. What is the projected Compound Annual Growth Rate (CAGR) of the Payer Services in the Healthcare Industry?
The projected CAGR is approximately 9.43%.
2. Which companies are prominent players in the Payer Services in the Healthcare Industry?
Key companies in the market include Hewlett-Packard, Synnex Corporation (Concentrix Corporation), HMS Holding Corp, Change Healthcare Inc, Wipro Limited, Accenture PLC, Xerox Corporation, HCL Technologies Ltd, Dell Inc, Cognizant Technology Solutions, McKESSON Corporation, Genpact Limited.
3. What are the main segments of the Payer Services in the Healthcare Industry?
The market segments include Service Type, Application, End User.
4. Can you provide details about the market size?
The market size is estimated to be USD 75.53 Million as of 2022.
5. What are some drivers contributing to market growth?
Rise In Adoption of Health Insurance Policies; Rise In Healthcare Frauds; Growing Burden of Chronic Diseases.
6. What are the notable trends driving market growth?
Claims Management Services Segment Is Expected To Hold A Major Share In The Market..
7. Are there any restraints impacting market growth?
High Incidences of Data Breaches and Loss of Confidentiality; Unpredicted Costs Associated With Outsourcing.
8. Can you provide examples of recent developments in the market?
N/A
9. What pricing options are available for accessing the report?
Pricing options include single-user, multi-user, and enterprise licenses priced at USD 4750, USD 5250, and USD 8750 respectively.
10. Is the market size provided in terms of value or volume?
The market size is provided in terms of value, measured in Million.
11. Are there any specific market keywords associated with the report?
Yes, the market keyword associated with the report is "Payer Services in the Healthcare Industry," which aids in identifying and referencing the specific market segment covered.
12. How do I determine which pricing option suits my needs best?
The pricing options vary based on user requirements and access needs. Individual users may opt for single-user licenses, while businesses requiring broader access may choose multi-user or enterprise licenses for cost-effective access to the report.
13. Are there any additional resources or data provided in the Payer Services in the Healthcare Industry report?
While the report offers comprehensive insights, it's advisable to review the specific contents or supplementary materials provided to ascertain if additional resources or data are available.
14. How can I stay updated on further developments or reports in the Payer Services in the Healthcare Industry?
To stay informed about further developments, trends, and reports in the Payer Services in the Healthcare Industry, consider subscribing to industry newsletters, following relevant companies and organizations, or regularly checking reputable industry news sources and publications.
Methodology
Step 1 - Identification of Relevant Samples Size from Population Database


Step 2 - Approaches for Defining Global Market Size (Value, Volume* & Price*)

Note*: In applicable scenarios
Step 3 - Data Sources
Primary Research
- Web Analytics
- Survey Reports
- Research Institute
- Latest Research Reports
- Opinion Leaders
Secondary Research
- Annual Reports
- White Paper
- Latest Press Release
- Industry Association
- Paid Database
- Investor Presentations

Step 4 - Data Triangulation
Involves using different sources of information in order to increase the validity of a study
These sources are likely to be stakeholders in a program - participants, other researchers, program staff, other community members, and so on.
Then we put all data in single framework & apply various statistical tools to find out the dynamic on the market.
During the analysis stage, feedback from the stakeholder groups would be compared to determine areas of agreement as well as areas of divergence