

Key Insights
The Nucleic Acid Amplification (NAA) market, valued at $10.31 billion in 2025, is projected to expand at a Compound Annual Growth Rate (CAGR) of 9.3% from 2025 to 2033. This growth is propelled by the increasing incidence of infectious diseases, the escalating demand for swift and precise diagnostic tools, and significant technological advancements in NAA assays and instrumentation. The market also benefits from the expanding application of NAA in genomics and molecular biology research. Key technologies include Helicase-dependent Amplification (HDA), Nicking Enzyme Amplification Reaction (NEAR), Loop-mediated Isothermal Amplification (LAMP), Strand Displacement Amplification (SDA), Nucleic Acid Sequence-based Amplification (NASBA), Transcription Mediated Amplification (TMA), and Single Primer Isothermal Amplification (SPIA). The market is segmented by technology, product (Instruments and Reagents), and end-user (Hospitals, Research Laboratories, and others). LAMP and HDA are expected to show substantial growth due to their speed and simplicity.
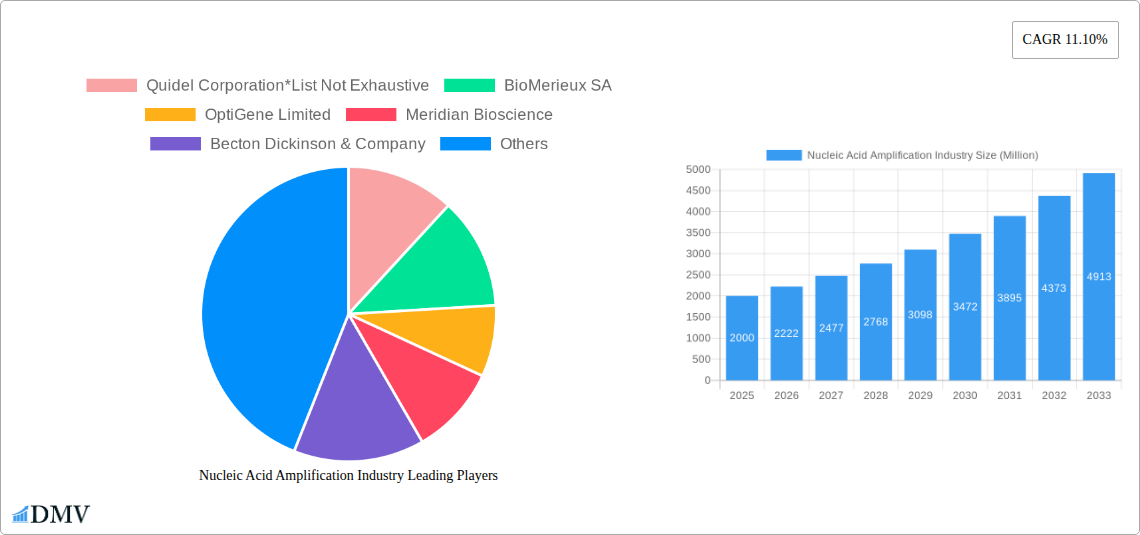
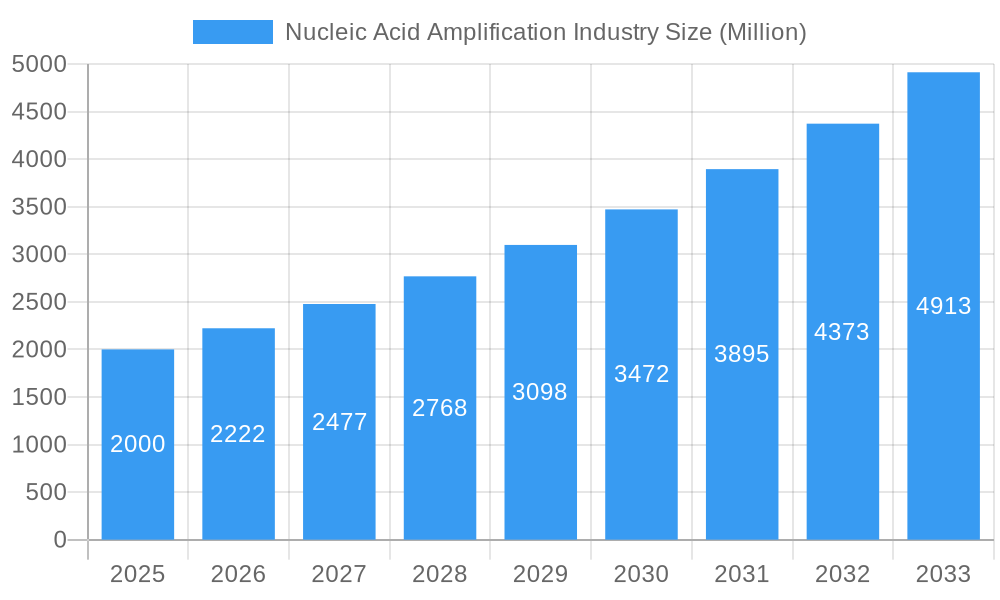
Nucleic Acid Amplification Industry Market Size (In Billion)
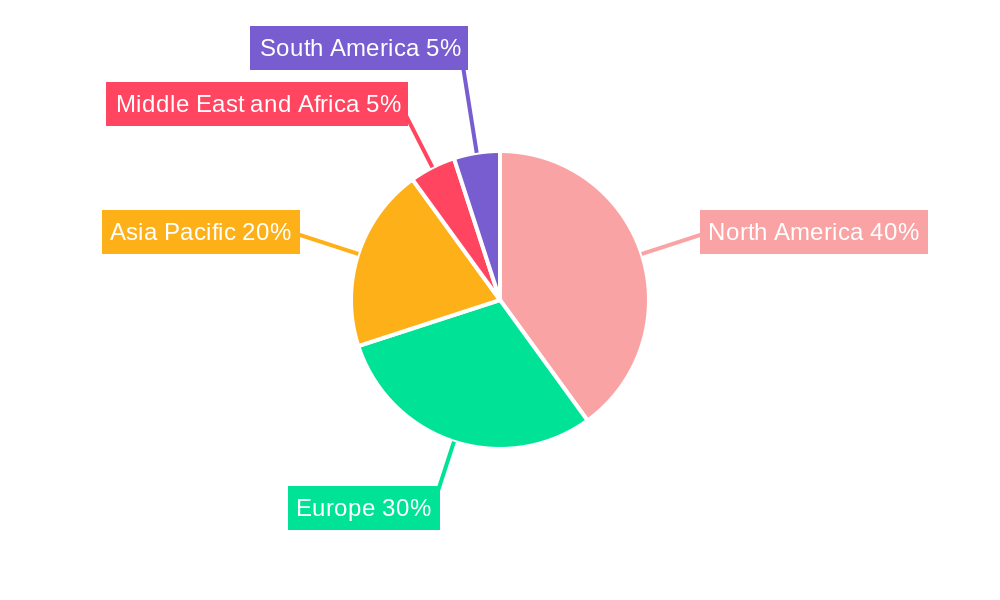
Geographically, North America currently leads the NAA market due to its advanced healthcare infrastructure and substantial research funding. However, the Asia Pacific region is anticipated to experience the highest growth rate, driven by increased healthcare expenditure, a rising burden of infectious diseases, and developing diagnostic capabilities in nations like India and China. Despite challenges such as stringent regulatory approvals and high initial investment costs, the market outlook remains positive. Continuous technological innovation and the persistent need for rapid, sensitive diagnostic solutions, particularly for point-of-care applications and personalized medicine, will continue to drive demand. Leading companies like Quidel Corporation, BioMerieux SA, and OptiGene Limited are actively investing in R&D to maintain their competitive positions.
Nucleic Acid Amplification Industry Company Market Share
This report provides an in-depth analysis of the Nucleic Acid Amplification Industry, offering critical insights for stakeholders navigating this dynamic sector. The forecast period is 2019-2033, with 2025 serving as the base and estimated year.
Nucleic Acid Amplification Industry Market Composition & Trends
This section delves into the competitive landscape of the Nucleic Acid Amplification market, examining market concentration, innovation drivers, regulatory hurdles, substitute technologies, and end-user behavior. We analyze mergers and acquisitions (M&A) activity, including deal values, and provide a detailed market share distribution among key players. The analysis reveals a moderately concentrated market with significant M&A activity driving consolidation. Companies like Quidel Corporation, BioMerieux SA, and Qiagen NV hold substantial market share, but several smaller players are contributing to innovation. The regulatory landscape varies across regions, influencing product approvals and market access. Furthermore, the report assesses the impact of substitute technologies and the evolving needs of key end-users, including hospitals and research laboratories.
- Market Concentration: Moderately concentrated, with several major players and a number of smaller, specialized firms.
- Innovation Catalysts: Rapid advancements in isothermal amplification techniques and increasing demand for point-of-care diagnostics.
- Regulatory Landscape: Varying regulations across different geographies impacting product approvals and market access.
- Substitute Products: Traditional methods like PCR still hold a significant share, but isothermal amplification is gaining ground.
- M&A Activity: Significant consolidation through acquisitions, with an estimated xx Million in M&A deal value over the past five years. Market share distribution amongst top players is analyzed to illustrate this.
- End-User Profiles: Hospitals and research laboratories are the primary end-users, but the market is expanding into other segments.
Nucleic Acid Amplification Industry Industry Evolution
This section provides a comprehensive analysis of the Nucleic Acid Amplification market's evolution from 2019 to 2033. It traces market growth trajectories, technological advancements, and shifting consumer demands, providing specific data points on growth rates and adoption metrics. The market experienced substantial growth during the historical period (2019-2024), fueled by increasing demand for rapid diagnostic testing, particularly during the COVID-19 pandemic. This growth is projected to continue, albeit at a moderated pace, during the forecast period (2025-2033). Technological advancements such as the development of more sensitive and specific assays, coupled with the miniaturization of instruments, are key drivers. Consumer demands are shifting towards faster, more accurate, and easier-to-use point-of-care solutions.
- Historical Growth Rate (2019-2024): xx% CAGR
- Projected Growth Rate (2025-2033): xx% CAGR
- Adoption Metrics: Increasing adoption of isothermal amplification techniques in various applications.
Leading Regions, Countries, or Segments in Nucleic Acid Amplification Industry
This section identifies the leading regions, countries, and segments within the Nucleic Acid Amplification market. The analysis focuses on key drivers (investment trends, regulatory support) for dominance in each segment. North America and Europe currently hold the largest market share due to strong R&D investment, robust healthcare infrastructure, and regulatory support. However, rapidly growing economies in Asia-Pacific are expected to witness significant growth in the coming years. Within technology segments, Loop-mediated Isothermal Amplification (LAMP) and other isothermal techniques show strong growth due to their simplicity and cost-effectiveness. The instrument segment commands a significant share, although the reagents market is growing rapidly.
- Dominant Region: North America
- Key Drivers (North America): Strong R&D investment, well-established healthcare infrastructure, and advanced regulatory frameworks.
- Dominant Technology Segment: Loop-mediated Isothermal Amplification (LAMP)
- Key Drivers (LAMP): Simplicity, cost-effectiveness, and suitability for point-of-care diagnostics.
- Dominant Product Segment: Instruments
- Key Drivers (Instruments): Technological advancements and growing demand for high-throughput testing.
Nucleic Acid Amplification Industry Product Innovations
Recent innovations in Nucleic Acid Amplification technology focus on improving sensitivity, specificity, speed, and ease of use. This includes advancements in isothermal amplification methods, such as LAMP and NEAR, which offer rapid and simplified workflows. Miniaturized devices and integrated platforms are also gaining traction, enabling point-of-care diagnostics and decentralized testing capabilities. The development of novel reagents, including those optimized for specific sample types, further enhances the effectiveness and broad applicability of Nucleic Acid Amplification techniques. These innovations directly impact performance metrics like turnaround time, cost per test, and accuracy.
Propelling Factors for Nucleic Acid Amplification Industry Growth
The Nucleic Acid Amplification market is propelled by several factors, including technological advancements such as the development of faster, more efficient, and cost-effective isothermal amplification methods. The increasing prevalence of infectious diseases, genetic disorders, and cancers is driving the demand for rapid and accurate diagnostic tools. Moreover, favorable regulatory environments and increasing investments in healthcare infrastructure are further accelerating market growth. The growing adoption of point-of-care diagnostics and personalized medicine approaches contributes significantly to market expansion.
Obstacles in the Nucleic Acid Amplification Industry Market
The Nucleic Acid Amplification market faces challenges such as stringent regulatory approvals for new products and the high cost of developing and validating advanced diagnostic technologies. Supply chain disruptions impacting reagent availability can also hinder market growth. The market is further characterized by significant competition amongst established and emerging players, resulting in price pressures and the need for continuous innovation. These obstacles may impact market penetration and growth rate, requiring strategic mitigation by industry participants.
Future Opportunities in Nucleic Acid Amplification Industry
Future opportunities in the Nucleic Acid Amplification market lie in the development of multiplex assays, enabling simultaneous detection of multiple pathogens or genetic markers. The integration of advanced technologies, like microfluidics and artificial intelligence, offers opportunities for developing automated, high-throughput, and cost-effective diagnostic platforms. Expansion into emerging markets with limited access to advanced healthcare infrastructure presents significant growth potential. Furthermore, research focusing on novel amplification chemistries and target detection strategies will continue to drive innovation in this rapidly evolving field.
Major Players in the Nucleic Acid Amplification Industry Ecosystem
- Quidel Corporation
- BioMerieux SA
- OptiGene Limited
- Meridian Bioscience
- Becton Dickinson & Company
- Tecan Genomics Inc
- Lucigen
- Qiagen NV
- Eiken Chemical Co Ltd
Key Developments in Nucleic Acid Amplification Industry Industry
- August 2022: LGC Clinical Diagnostics extended its collaboration with Stanford Medicine, boosting global genetic and metabolic diagnostic testing.
- May 2022: Meridian Bioscience launched Lyo-Ready Direct DNA/RNA LAMP saliva mixes for point-of-care diagnostics.
Strategic Nucleic Acid Amplification Industry Market Forecast
The Nucleic Acid Amplification market is poised for significant growth driven by ongoing technological innovation, increasing demand for rapid diagnostics, and expansion into new markets. The adoption of isothermal amplification techniques, combined with the development of point-of-care testing platforms, will continue to shape market dynamics. The market’s future growth will be influenced by factors such as regulatory approvals, technological advancements, and the evolution of healthcare infrastructure globally. The market is expected to maintain a robust growth trajectory throughout the forecast period, driven by unmet clinical needs and continuous technological progress.
Nucleic Acid Amplification Industry Segmentation
-
1. Technology
- 1.1. Helicase-dependent Amplification (HDA)
- 1.2. Nicking Enzyme Amplification Reaction (NEAR)
- 1.3. Loop-mediated Isothermal Amplification (LAMP)
- 1.4. Strand Displacement Amplification (SDA)
- 1.5. Nucleic Acid Sequence-based Amplification (NASBA)
- 1.6. Transcription Mediated Amplification (TMA)
- 1.7. Single Primer Isothermal Amplification (SPIA)
- 1.8. Other Technologies
-
2. Product
- 2.1. Instruments
- 2.2. Reagents
-
3. End-User
- 3.1. Hospitals
- 3.2. Research Laboratories
- 3.3. Other End-Users
Nucleic Acid Amplification Industry Segmentation By Geography
-
1. North America
- 1.1. United States
- 1.2. Canada
- 1.3. Mexico
-
2. Europe
- 2.1. Germany
- 2.2. United Kingdom
- 2.3. France
- 2.4. Italy
- 2.5. Spain
- 2.6. Rest of Europe
-
3. Asia Pacific
- 3.1. China
- 3.2. Japan
- 3.3. India
- 3.4. Australia
- 3.5. South Korea
- 3.6. Rest of Asia Pacific
-
4. Middle East and Africa
- 4.1. GCC
- 4.2. South Africa
- 4.3. Rest of Middle East and Africa
-
5. South America
- 5.1. Brazil
- 5.2. Argentina
- 5.3. Rest of South America
Nucleic Acid Amplification Industry Regional Market Share
Geographic Coverage of Nucleic Acid Amplification Industry
Nucleic Acid Amplification Industry REPORT HIGHLIGHTS
| Aspects | Details |
|---|---|
| Study Period | 2020-2034 |
| Base Year | 2025 |
| Estimated Year | 2026 |
| Forecast Period | 2026-2034 |
| Historical Period | 2020-2025 |
| Growth Rate | CAGR of 9.3% from 2020-2034 |
| Segmentation |
|
Table of Contents
- 1. Introduction
- 1.1. Research Scope
- 1.2. Market Segmentation
- 1.3. Research Objective
- 1.4. Definitions and Assumptions
- 2. Executive Summary
- 2.1. Market Snapshot
- 3. Market Dynamics
- 3.1. Market Drivers
- 3.2. Market Restrains
- 3.3. Market Trends
- 3.4. Market Opportunities
- 4. Market Factor Analysis
- 4.1. Porters Five Forces
- 4.1.1. Bargaining Power of Suppliers
- 4.1.2. Bargaining Power of Buyers
- 4.1.3. Threat of New Entrants
- 4.1.4. Threat of Substitutes
- 4.1.5. Competitive Rivalry
- 4.2. PESTEL analysis
- 4.3. BCG Analysis
- 4.3.1. Stars (High Growth, High Market Share)
- 4.3.2. Cash Cows (Low Growth, High Market Share)
- 4.3.3. Question Mark (High Growth, Low Market Share)
- 4.3.4. Dogs (Low Growth, Low Market Share)
- 4.4. Ansoff Matrix Analysis
- 4.5. Supply Chain Analysis
- 4.6. Regulatory Landscape
- 4.7. Current Market Potential and Opportunity Assessment (TAM–SAM–SOM Framework)
- 4.8. DMV Analyst Note
- 4.1. Porters Five Forces
- 5. Market Analysis, Insights and Forecast 2021-2033
- 5.1. Market Analysis, Insights and Forecast - by Technology
- 5.1.1. Helicase-dependent Amplification (HDA)
- 5.1.2. Nicking Enzyme Amplification Reaction (NEAR)
- 5.1.3. Loop-mediated Isothermal Amplification (LAMP)
- 5.1.4. Strand Displacement Amplification (SDA)
- 5.1.5. Nucleic Acid Sequence-based Amplification (NASBA)
- 5.1.6. Transcription Mediated Amplification (TMA)
- 5.1.7. Single Primer Isothermal Amplification (SPIA)
- 5.1.8. Other Technologies
- 5.2. Market Analysis, Insights and Forecast - by Product
- 5.2.1. Instruments
- 5.2.2. Reagents
- 5.3. Market Analysis, Insights and Forecast - by End-User
- 5.3.1. Hospitals
- 5.3.2. Research Laboratories
- 5.3.3. Other End-Users
- 5.4. Market Analysis, Insights and Forecast - by Region
- 5.4.1. North America
- 5.4.2. Europe
- 5.4.3. Asia Pacific
- 5.4.4. Middle East and Africa
- 5.4.5. South America
- 5.1. Market Analysis, Insights and Forecast - by Technology
- 6. Global Nucleic Acid Amplification Industry Analysis, Insights and Forecast, 2021-2033
- 6.1. Market Analysis, Insights and Forecast - by Technology
- 6.1.1. Helicase-dependent Amplification (HDA)
- 6.1.2. Nicking Enzyme Amplification Reaction (NEAR)
- 6.1.3. Loop-mediated Isothermal Amplification (LAMP)
- 6.1.4. Strand Displacement Amplification (SDA)
- 6.1.5. Nucleic Acid Sequence-based Amplification (NASBA)
- 6.1.6. Transcription Mediated Amplification (TMA)
- 6.1.7. Single Primer Isothermal Amplification (SPIA)
- 6.1.8. Other Technologies
- 6.2. Market Analysis, Insights and Forecast - by Product
- 6.2.1. Instruments
- 6.2.2. Reagents
- 6.3. Market Analysis, Insights and Forecast - by End-User
- 6.3.1. Hospitals
- 6.3.2. Research Laboratories
- 6.3.3. Other End-Users
- 6.1. Market Analysis, Insights and Forecast - by Technology
- 7. North America Nucleic Acid Amplification Industry Analysis, Insights and Forecast, 2020-2032
- 7.1. Market Analysis, Insights and Forecast - by Technology
- 7.1.1. Helicase-dependent Amplification (HDA)
- 7.1.2. Nicking Enzyme Amplification Reaction (NEAR)
- 7.1.3. Loop-mediated Isothermal Amplification (LAMP)
- 7.1.4. Strand Displacement Amplification (SDA)
- 7.1.5. Nucleic Acid Sequence-based Amplification (NASBA)
- 7.1.6. Transcription Mediated Amplification (TMA)
- 7.1.7. Single Primer Isothermal Amplification (SPIA)
- 7.1.8. Other Technologies
- 7.2. Market Analysis, Insights and Forecast - by Product
- 7.2.1. Instruments
- 7.2.2. Reagents
- 7.3. Market Analysis, Insights and Forecast - by End-User
- 7.3.1. Hospitals
- 7.3.2. Research Laboratories
- 7.3.3. Other End-Users
- 7.1. Market Analysis, Insights and Forecast - by Technology
- 8. Europe Nucleic Acid Amplification Industry Analysis, Insights and Forecast, 2020-2032
- 8.1. Market Analysis, Insights and Forecast - by Technology
- 8.1.1. Helicase-dependent Amplification (HDA)
- 8.1.2. Nicking Enzyme Amplification Reaction (NEAR)
- 8.1.3. Loop-mediated Isothermal Amplification (LAMP)
- 8.1.4. Strand Displacement Amplification (SDA)
- 8.1.5. Nucleic Acid Sequence-based Amplification (NASBA)
- 8.1.6. Transcription Mediated Amplification (TMA)
- 8.1.7. Single Primer Isothermal Amplification (SPIA)
- 8.1.8. Other Technologies
- 8.2. Market Analysis, Insights and Forecast - by Product
- 8.2.1. Instruments
- 8.2.2. Reagents
- 8.3. Market Analysis, Insights and Forecast - by End-User
- 8.3.1. Hospitals
- 8.3.2. Research Laboratories
- 8.3.3. Other End-Users
- 8.1. Market Analysis, Insights and Forecast - by Technology
- 9. Asia Pacific Nucleic Acid Amplification Industry Analysis, Insights and Forecast, 2020-2032
- 9.1. Market Analysis, Insights and Forecast - by Technology
- 9.1.1. Helicase-dependent Amplification (HDA)
- 9.1.2. Nicking Enzyme Amplification Reaction (NEAR)
- 9.1.3. Loop-mediated Isothermal Amplification (LAMP)
- 9.1.4. Strand Displacement Amplification (SDA)
- 9.1.5. Nucleic Acid Sequence-based Amplification (NASBA)
- 9.1.6. Transcription Mediated Amplification (TMA)
- 9.1.7. Single Primer Isothermal Amplification (SPIA)
- 9.1.8. Other Technologies
- 9.2. Market Analysis, Insights and Forecast - by Product
- 9.2.1. Instruments
- 9.2.2. Reagents
- 9.3. Market Analysis, Insights and Forecast - by End-User
- 9.3.1. Hospitals
- 9.3.2. Research Laboratories
- 9.3.3. Other End-Users
- 9.1. Market Analysis, Insights and Forecast - by Technology
- 10. Middle East and Africa Nucleic Acid Amplification Industry Analysis, Insights and Forecast, 2020-2032
- 10.1. Market Analysis, Insights and Forecast - by Technology
- 10.1.1. Helicase-dependent Amplification (HDA)
- 10.1.2. Nicking Enzyme Amplification Reaction (NEAR)
- 10.1.3. Loop-mediated Isothermal Amplification (LAMP)
- 10.1.4. Strand Displacement Amplification (SDA)
- 10.1.5. Nucleic Acid Sequence-based Amplification (NASBA)
- 10.1.6. Transcription Mediated Amplification (TMA)
- 10.1.7. Single Primer Isothermal Amplification (SPIA)
- 10.1.8. Other Technologies
- 10.2. Market Analysis, Insights and Forecast - by Product
- 10.2.1. Instruments
- 10.2.2. Reagents
- 10.3. Market Analysis, Insights and Forecast - by End-User
- 10.3.1. Hospitals
- 10.3.2. Research Laboratories
- 10.3.3. Other End-Users
- 10.1. Market Analysis, Insights and Forecast - by Technology
- 11. South America Nucleic Acid Amplification Industry Analysis, Insights and Forecast, 2020-2032
- 11.1. Market Analysis, Insights and Forecast - by Technology
- 11.1.1. Helicase-dependent Amplification (HDA)
- 11.1.2. Nicking Enzyme Amplification Reaction (NEAR)
- 11.1.3. Loop-mediated Isothermal Amplification (LAMP)
- 11.1.4. Strand Displacement Amplification (SDA)
- 11.1.5. Nucleic Acid Sequence-based Amplification (NASBA)
- 11.1.6. Transcription Mediated Amplification (TMA)
- 11.1.7. Single Primer Isothermal Amplification (SPIA)
- 11.1.8. Other Technologies
- 11.2. Market Analysis, Insights and Forecast - by Product
- 11.2.1. Instruments
- 11.2.2. Reagents
- 11.3. Market Analysis, Insights and Forecast - by End-User
- 11.3.1. Hospitals
- 11.3.2. Research Laboratories
- 11.3.3. Other End-Users
- 11.1. Market Analysis, Insights and Forecast - by Technology
- 12. Competitive Analysis
- 12.1. Company Profiles
- 12.1.1 Quidel Corporation*List Not Exhaustive
- 12.1.1.1. Company Overview
- 12.1.1.2. Products
- 12.1.1.3. Company Financials
- 12.1.1.4. SWOT Analysis
- 12.1.2 BioMerieux SA
- 12.1.2.1. Company Overview
- 12.1.2.2. Products
- 12.1.2.3. Company Financials
- 12.1.2.4. SWOT Analysis
- 12.1.3 OptiGene Limited
- 12.1.3.1. Company Overview
- 12.1.3.2. Products
- 12.1.3.3. Company Financials
- 12.1.3.4. SWOT Analysis
- 12.1.4 Meridian Bioscience
- 12.1.4.1. Company Overview
- 12.1.4.2. Products
- 12.1.4.3. Company Financials
- 12.1.4.4. SWOT Analysis
- 12.1.5 Becton Dickinson & Company
- 12.1.5.1. Company Overview
- 12.1.5.2. Products
- 12.1.5.3. Company Financials
- 12.1.5.4. SWOT Analysis
- 12.1.6 Tecan Genomics Inc
- 12.1.6.1. Company Overview
- 12.1.6.2. Products
- 12.1.6.3. Company Financials
- 12.1.6.4. SWOT Analysis
- 12.1.7 Lucigen
- 12.1.7.1. Company Overview
- 12.1.7.2. Products
- 12.1.7.3. Company Financials
- 12.1.7.4. SWOT Analysis
- 12.1.8 Qiagen NV
- 12.1.8.1. Company Overview
- 12.1.8.2. Products
- 12.1.8.3. Company Financials
- 12.1.8.4. SWOT Analysis
- 12.1.9 Eiken Chemical Co Ltd
- 12.1.9.1. Company Overview
- 12.1.9.2. Products
- 12.1.9.3. Company Financials
- 12.1.9.4. SWOT Analysis
- 12.1.1 Quidel Corporation*List Not Exhaustive
- 12.2. Market Entropy
- 12.2.1 Company's Key Areas Served
- 12.2.2 Recent Developments
- 12.3. Company Market Share Analysis 2025
- 12.3.1 Top 5 Companies Market Share Analysis
- 12.3.2 Top 3 Companies Market Share Analysis
- 12.4. List of Potential Customers
- 13. Research Methodology
List of Figures
- Figure 1: Global Nucleic Acid Amplification Industry Revenue Breakdown (billion, %) by Region 2025 & 2033
- Figure 2: North America Nucleic Acid Amplification Industry Revenue (billion), by Technology 2025 & 2033
- Figure 3: North America Nucleic Acid Amplification Industry Revenue Share (%), by Technology 2025 & 2033
- Figure 4: North America Nucleic Acid Amplification Industry Revenue (billion), by Product 2025 & 2033
- Figure 5: North America Nucleic Acid Amplification Industry Revenue Share (%), by Product 2025 & 2033
- Figure 6: North America Nucleic Acid Amplification Industry Revenue (billion), by End-User 2025 & 2033
- Figure 7: North America Nucleic Acid Amplification Industry Revenue Share (%), by End-User 2025 & 2033
- Figure 8: North America Nucleic Acid Amplification Industry Revenue (billion), by Country 2025 & 2033
- Figure 9: North America Nucleic Acid Amplification Industry Revenue Share (%), by Country 2025 & 2033
- Figure 10: Europe Nucleic Acid Amplification Industry Revenue (billion), by Technology 2025 & 2033
- Figure 11: Europe Nucleic Acid Amplification Industry Revenue Share (%), by Technology 2025 & 2033
- Figure 12: Europe Nucleic Acid Amplification Industry Revenue (billion), by Product 2025 & 2033
- Figure 13: Europe Nucleic Acid Amplification Industry Revenue Share (%), by Product 2025 & 2033
- Figure 14: Europe Nucleic Acid Amplification Industry Revenue (billion), by End-User 2025 & 2033
- Figure 15: Europe Nucleic Acid Amplification Industry Revenue Share (%), by End-User 2025 & 2033
- Figure 16: Europe Nucleic Acid Amplification Industry Revenue (billion), by Country 2025 & 2033
- Figure 17: Europe Nucleic Acid Amplification Industry Revenue Share (%), by Country 2025 & 2033
- Figure 18: Asia Pacific Nucleic Acid Amplification Industry Revenue (billion), by Technology 2025 & 2033
- Figure 19: Asia Pacific Nucleic Acid Amplification Industry Revenue Share (%), by Technology 2025 & 2033
- Figure 20: Asia Pacific Nucleic Acid Amplification Industry Revenue (billion), by Product 2025 & 2033
- Figure 21: Asia Pacific Nucleic Acid Amplification Industry Revenue Share (%), by Product 2025 & 2033
- Figure 22: Asia Pacific Nucleic Acid Amplification Industry Revenue (billion), by End-User 2025 & 2033
- Figure 23: Asia Pacific Nucleic Acid Amplification Industry Revenue Share (%), by End-User 2025 & 2033
- Figure 24: Asia Pacific Nucleic Acid Amplification Industry Revenue (billion), by Country 2025 & 2033
- Figure 25: Asia Pacific Nucleic Acid Amplification Industry Revenue Share (%), by Country 2025 & 2033
- Figure 26: Middle East and Africa Nucleic Acid Amplification Industry Revenue (billion), by Technology 2025 & 2033
- Figure 27: Middle East and Africa Nucleic Acid Amplification Industry Revenue Share (%), by Technology 2025 & 2033
- Figure 28: Middle East and Africa Nucleic Acid Amplification Industry Revenue (billion), by Product 2025 & 2033
- Figure 29: Middle East and Africa Nucleic Acid Amplification Industry Revenue Share (%), by Product 2025 & 2033
- Figure 30: Middle East and Africa Nucleic Acid Amplification Industry Revenue (billion), by End-User 2025 & 2033
- Figure 31: Middle East and Africa Nucleic Acid Amplification Industry Revenue Share (%), by End-User 2025 & 2033
- Figure 32: Middle East and Africa Nucleic Acid Amplification Industry Revenue (billion), by Country 2025 & 2033
- Figure 33: Middle East and Africa Nucleic Acid Amplification Industry Revenue Share (%), by Country 2025 & 2033
- Figure 34: South America Nucleic Acid Amplification Industry Revenue (billion), by Technology 2025 & 2033
- Figure 35: South America Nucleic Acid Amplification Industry Revenue Share (%), by Technology 2025 & 2033
- Figure 36: South America Nucleic Acid Amplification Industry Revenue (billion), by Product 2025 & 2033
- Figure 37: South America Nucleic Acid Amplification Industry Revenue Share (%), by Product 2025 & 2033
- Figure 38: South America Nucleic Acid Amplification Industry Revenue (billion), by End-User 2025 & 2033
- Figure 39: South America Nucleic Acid Amplification Industry Revenue Share (%), by End-User 2025 & 2033
- Figure 40: South America Nucleic Acid Amplification Industry Revenue (billion), by Country 2025 & 2033
- Figure 41: South America Nucleic Acid Amplification Industry Revenue Share (%), by Country 2025 & 2033
List of Tables
- Table 1: Global Nucleic Acid Amplification Industry Revenue billion Forecast, by Technology 2020 & 2033
- Table 2: Global Nucleic Acid Amplification Industry Revenue billion Forecast, by Product 2020 & 2033
- Table 3: Global Nucleic Acid Amplification Industry Revenue billion Forecast, by End-User 2020 & 2033
- Table 4: Global Nucleic Acid Amplification Industry Revenue billion Forecast, by Region 2020 & 2033
- Table 5: Global Nucleic Acid Amplification Industry Revenue billion Forecast, by Technology 2020 & 2033
- Table 6: Global Nucleic Acid Amplification Industry Revenue billion Forecast, by Product 2020 & 2033
- Table 7: Global Nucleic Acid Amplification Industry Revenue billion Forecast, by End-User 2020 & 2033
- Table 8: Global Nucleic Acid Amplification Industry Revenue billion Forecast, by Country 2020 & 2033
- Table 9: United States Nucleic Acid Amplification Industry Revenue (billion) Forecast, by Application 2020 & 2033
- Table 10: Canada Nucleic Acid Amplification Industry Revenue (billion) Forecast, by Application 2020 & 2033
- Table 11: Mexico Nucleic Acid Amplification Industry Revenue (billion) Forecast, by Application 2020 & 2033
- Table 12: Global Nucleic Acid Amplification Industry Revenue billion Forecast, by Technology 2020 & 2033
- Table 13: Global Nucleic Acid Amplification Industry Revenue billion Forecast, by Product 2020 & 2033
- Table 14: Global Nucleic Acid Amplification Industry Revenue billion Forecast, by End-User 2020 & 2033
- Table 15: Global Nucleic Acid Amplification Industry Revenue billion Forecast, by Country 2020 & 2033
- Table 16: Germany Nucleic Acid Amplification Industry Revenue (billion) Forecast, by Application 2020 & 2033
- Table 17: United Kingdom Nucleic Acid Amplification Industry Revenue (billion) Forecast, by Application 2020 & 2033
- Table 18: France Nucleic Acid Amplification Industry Revenue (billion) Forecast, by Application 2020 & 2033
- Table 19: Italy Nucleic Acid Amplification Industry Revenue (billion) Forecast, by Application 2020 & 2033
- Table 20: Spain Nucleic Acid Amplification Industry Revenue (billion) Forecast, by Application 2020 & 2033
- Table 21: Rest of Europe Nucleic Acid Amplification Industry Revenue (billion) Forecast, by Application 2020 & 2033
- Table 22: Global Nucleic Acid Amplification Industry Revenue billion Forecast, by Technology 2020 & 2033
- Table 23: Global Nucleic Acid Amplification Industry Revenue billion Forecast, by Product 2020 & 2033
- Table 24: Global Nucleic Acid Amplification Industry Revenue billion Forecast, by End-User 2020 & 2033
- Table 25: Global Nucleic Acid Amplification Industry Revenue billion Forecast, by Country 2020 & 2033
- Table 26: China Nucleic Acid Amplification Industry Revenue (billion) Forecast, by Application 2020 & 2033
- Table 27: Japan Nucleic Acid Amplification Industry Revenue (billion) Forecast, by Application 2020 & 2033
- Table 28: India Nucleic Acid Amplification Industry Revenue (billion) Forecast, by Application 2020 & 2033
- Table 29: Australia Nucleic Acid Amplification Industry Revenue (billion) Forecast, by Application 2020 & 2033
- Table 30: South Korea Nucleic Acid Amplification Industry Revenue (billion) Forecast, by Application 2020 & 2033
- Table 31: Rest of Asia Pacific Nucleic Acid Amplification Industry Revenue (billion) Forecast, by Application 2020 & 2033
- Table 32: Global Nucleic Acid Amplification Industry Revenue billion Forecast, by Technology 2020 & 2033
- Table 33: Global Nucleic Acid Amplification Industry Revenue billion Forecast, by Product 2020 & 2033
- Table 34: Global Nucleic Acid Amplification Industry Revenue billion Forecast, by End-User 2020 & 2033
- Table 35: Global Nucleic Acid Amplification Industry Revenue billion Forecast, by Country 2020 & 2033
- Table 36: GCC Nucleic Acid Amplification Industry Revenue (billion) Forecast, by Application 2020 & 2033
- Table 37: South Africa Nucleic Acid Amplification Industry Revenue (billion) Forecast, by Application 2020 & 2033
- Table 38: Rest of Middle East and Africa Nucleic Acid Amplification Industry Revenue (billion) Forecast, by Application 2020 & 2033
- Table 39: Global Nucleic Acid Amplification Industry Revenue billion Forecast, by Technology 2020 & 2033
- Table 40: Global Nucleic Acid Amplification Industry Revenue billion Forecast, by Product 2020 & 2033
- Table 41: Global Nucleic Acid Amplification Industry Revenue billion Forecast, by End-User 2020 & 2033
- Table 42: Global Nucleic Acid Amplification Industry Revenue billion Forecast, by Country 2020 & 2033
- Table 43: Brazil Nucleic Acid Amplification Industry Revenue (billion) Forecast, by Application 2020 & 2033
- Table 44: Argentina Nucleic Acid Amplification Industry Revenue (billion) Forecast, by Application 2020 & 2033
- Table 45: Rest of South America Nucleic Acid Amplification Industry Revenue (billion) Forecast, by Application 2020 & 2033
Frequently Asked Questions
1. What is the projected Compound Annual Growth Rate (CAGR) of the Nucleic Acid Amplification Industry?
The projected CAGR is approximately 9.3%.
2. Which companies are prominent players in the Nucleic Acid Amplification Industry?
Key companies in the market include Quidel Corporation*List Not Exhaustive, BioMerieux SA, OptiGene Limited, Meridian Bioscience, Becton Dickinson & Company, Tecan Genomics Inc, Lucigen, Qiagen NV, Eiken Chemical Co Ltd.
3. What are the main segments of the Nucleic Acid Amplification Industry?
The market segments include Technology, Product, End-User.
4. Can you provide details about the market size?
The market size is estimated to be USD 10.31 billion as of 2022.
5. What are some drivers contributing to market growth?
Increasing Incidences of Chronic Diseases And Aging Population; Increase in the Adoption of INAAT Over PCR; Rise In The Miniaturization of Nucleic Acid-based Diagnostics; Rise In Demand for Low-cost And Effective Diagnostics Procedures.
6. What are the notable trends driving market growth?
Loop-mediated Isothermal Amplification (LAMP) Segment is Expected to Hold a Major Market Share in the Isothermal Nucleic Acid Amplification Technology (INAAT) Market.
7. Are there any restraints impacting market growth?
Threatening Opposition from PCR Technologies; Lack of Awareness about New Diagnostics Technologies.
8. Can you provide examples of recent developments in the market?
In August 2022, LGC Clinical Diagnostics announced the extension of their exclusive collaboration with Stanford Medicine's Department of Obstetrics and Gynecology and Metabolic Health Center supporting global genetic and metabolic diagnostic testing.
9. What pricing options are available for accessing the report?
Pricing options include single-user, multi-user, and enterprise licenses priced at USD 4750, USD 5250, and USD 8750 respectively.
10. Is the market size provided in terms of value or volume?
The market size is provided in terms of value, measured in billion.
11. Are there any specific market keywords associated with the report?
Yes, the market keyword associated with the report is "Nucleic Acid Amplification Industry," which aids in identifying and referencing the specific market segment covered.
12. How do I determine which pricing option suits my needs best?
The pricing options vary based on user requirements and access needs. Individual users may opt for single-user licenses, while businesses requiring broader access may choose multi-user or enterprise licenses for cost-effective access to the report.
13. Are there any additional resources or data provided in the Nucleic Acid Amplification Industry report?
While the report offers comprehensive insights, it's advisable to review the specific contents or supplementary materials provided to ascertain if additional resources or data are available.
14. How can I stay updated on further developments or reports in the Nucleic Acid Amplification Industry?
To stay informed about further developments, trends, and reports in the Nucleic Acid Amplification Industry, consider subscribing to industry newsletters, following relevant companies and organizations, or regularly checking reputable industry news sources and publications.
Methodology
Step 1 - Identification of Relevant Samples Size from Population Database


Step 2 - Approaches for Defining Global Market Size (Value, Volume* & Price*)

Note*: In applicable scenarios
Step 3 - Data Sources
Primary Research
- Web Analytics
- Survey Reports
- Research Institute
- Latest Research Reports
- Opinion Leaders
Secondary Research
- Annual Reports
- White Paper
- Latest Press Release
- Industry Association
- Paid Database
- Investor Presentations

Step 4 - Data Triangulation
Involves using different sources of information in order to increase the validity of a study
These sources are likely to be stakeholders in a program - participants, other researchers, program staff, other community members, and so on.
Then we put all data in single framework & apply various statistical tools to find out the dynamic on the market.
During the analysis stage, feedback from the stakeholder groups would be compared to determine areas of agreement as well as areas of divergence