

Key Insights
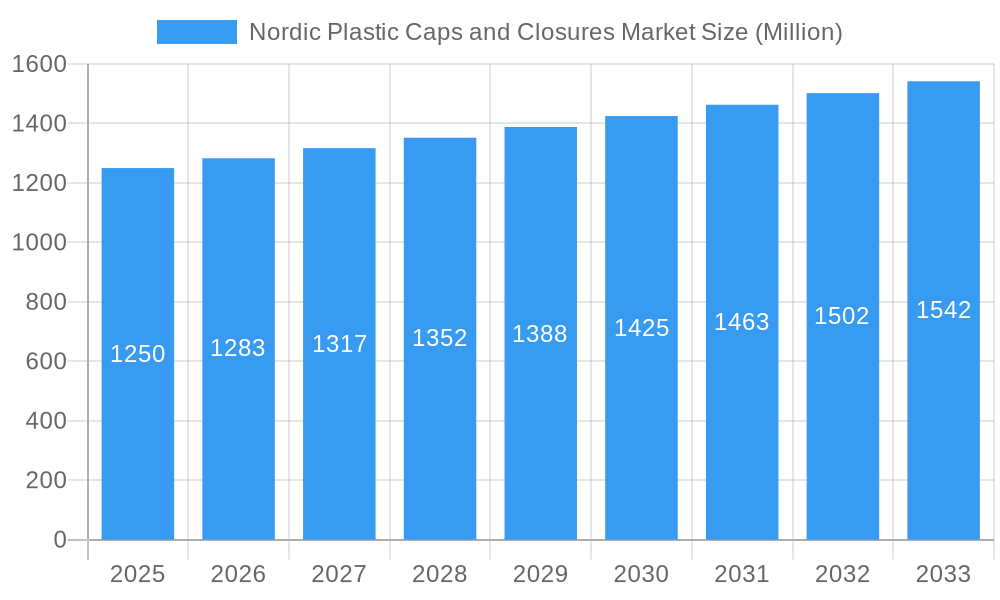
The Nordic plastic caps and closures market, valued at $1.25 billion in 2025, is projected to experience steady growth, driven by the region's robust food and beverage industry, increasing demand for convenient packaging, and a burgeoning e-commerce sector fueling the need for tamper-evident and secure closures. The market's Compound Annual Growth Rate (CAGR) of 2.58% from 2025 to 2033 reflects a consistent, albeit moderate, expansion. Key drivers include the rising adoption of lightweighting technologies in packaging to reduce material costs and environmental impact, growing consumer preference for sustainable and recyclable packaging options, and increased investments in advanced closure technologies like induction seals and child-resistant closures. While the market faces some restraints, such as fluctuating raw material prices and environmental regulations concerning plastic waste, the overall outlook remains positive, largely due to the region's focus on innovation and sustainable packaging solutions. Companies like Amcor, Bericap, Berry Global, and Tetra Pak are key players, constantly innovating to meet evolving consumer and regulatory demands. The market segmentation likely includes various closure types (e.g., screw caps, snap caps, flip-top closures), material types (e.g., HDPE, PP, PET), and end-use industries (food & beverage, pharmaceuticals, chemicals). The forecast period of 2025-2033 reveals a continuous market evolution, with the emphasis shifting towards eco-friendly materials and innovative designs.
Nordic Plastic Caps and Closures Market Market Size (In Billion)
The competitive landscape is dynamic, with both established multinational corporations and emerging regional players vying for market share. Established players leverage their extensive distribution networks and brand recognition, while emerging players often focus on niche markets and innovative product offerings. Future growth will likely depend on companies' abilities to adapt to evolving consumer preferences, stringent environmental regulations, and technological advancements within the packaging industry. Strategic partnerships and acquisitions are likely to play a significant role in shaping the market's future landscape. Regional variations in demand are expected, with potentially higher growth in countries experiencing faster economic development and increasing consumer spending. The market analysis suggests a favorable outlook with continuous growth driven by innovation and adaptation within a responsible packaging framework.
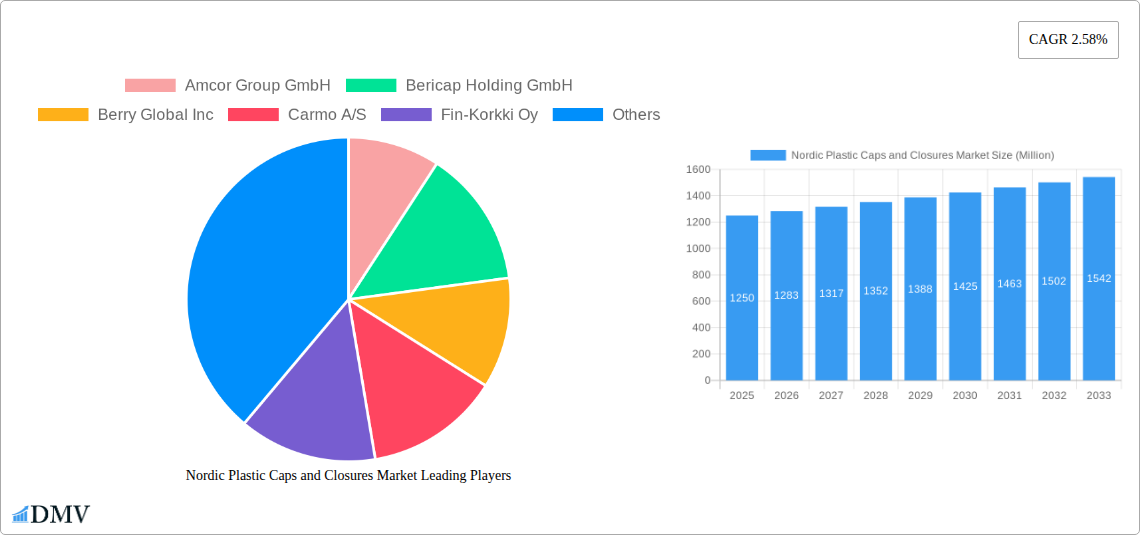
Nordic Plastic Caps and Closures Market Company Market Share
Nordic Plastic Caps and Closures Market Report: 2019-2033
This comprehensive report provides a detailed analysis of the Nordic plastic caps and closures market, offering invaluable insights for stakeholders seeking to navigate this dynamic industry. The study period spans 2019-2033, with a base year of 2025 and a forecast period of 2025-2033. The report leverages extensive market research to provide a clear understanding of current market trends and future growth potential, valued at xx Million in 2025 and projected to reach xx Million by 2033.
Nordic Plastic Caps and Closures Market Composition & Trends
This section delves into the intricate structure of the Nordic plastic caps and closures market, examining its concentration, innovation drivers, regulatory landscape, substitute products, end-user profiles, and merger & acquisition (M&A) activities. The market displays a moderately concentrated landscape, with key players like Amcor Group GmbH, Bericap Holding GmbH, and Berry Global Inc. holding significant market share. However, smaller regional players also contribute substantially, indicating a dynamic competitive environment.
- Market Share Distribution (2025): Amcor Group GmbH (xx%), Bericap Holding GmbH (xx%), Berry Global Inc. (xx%), Others (xx%).
- Innovation Catalysts: Sustainable packaging solutions, lightweight designs, and smart closures are driving innovation.
- Regulatory Landscape: Stringent regulations concerning plastic waste and recyclability are shaping market dynamics.
- Substitute Products: Materials like metal and bioplastics are emerging as potential substitutes, though their market penetration remains limited.
- End-User Profiles: The market is driven by diverse end-use sectors, including food and beverages, pharmaceuticals, personal care, and industrial chemicals.
- M&A Activities (2019-2024): A total of xx M&A deals were recorded, with an estimated aggregate value of xx Million. These transactions primarily focused on expanding product portfolios and geographical reach.
Nordic Plastic Caps and Closures Market Industry Evolution
This section analyzes the evolution of the Nordic plastic caps and closures market, focusing on growth trajectories, technological advancements, and evolving consumer preferences. The market has witnessed robust growth over the historical period (2019-2024), with a Compound Annual Growth Rate (CAGR) of xx%. This growth is attributed to factors such as increasing demand for convenience packaging, expanding end-use sectors, and technological advancements in materials and manufacturing processes. Consumer demand for sustainable and eco-friendly packaging solutions is a significant factor influencing the market's trajectory. The adoption of lightweight designs and recyclable materials is accelerating, driven by both consumer preferences and regulatory pressures. Technological advancements in closure mechanisms, including tamper-evident and reclosable designs, are also contributing to market growth. Further, the integration of smart packaging technologies is gradually gaining traction, though its current adoption rate remains relatively low.
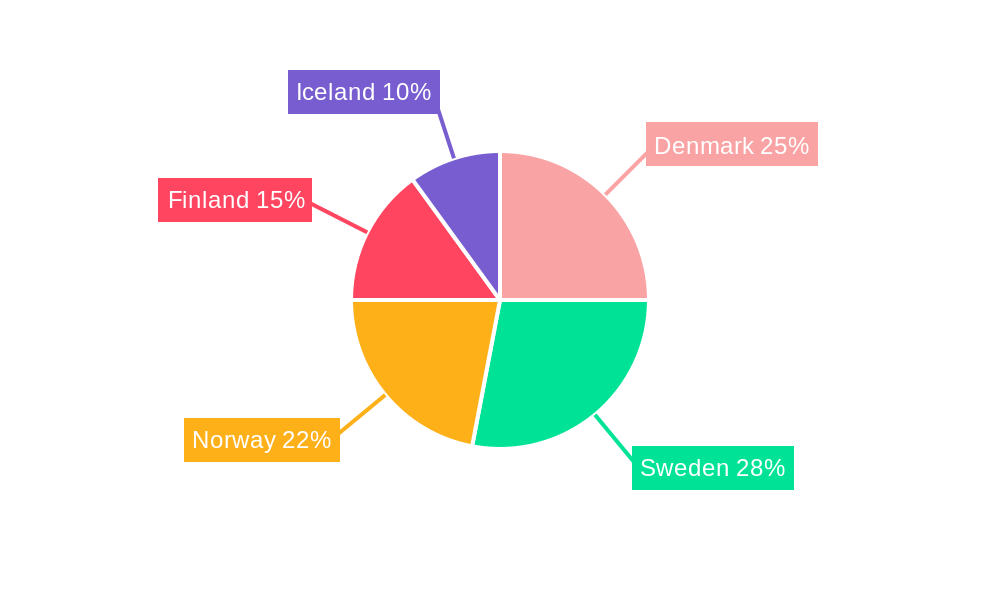
Leading Regions, Countries, or Segments in Nordic Plastic Caps and Closures Market
This section identifies the dominant regions, countries, or segments within the Nordic plastic caps and closures market. While specific data needs further clarification, it is expected that Denmark and Sweden will show higher market shares due to their developed economies and strong consumer markets.
- Key Drivers in Dominant Regions:
- High disposable incomes and strong consumer demand
- Favorable regulatory frameworks promoting sustainable packaging
- Significant investments in advanced manufacturing facilities
The dominance of specific regions is primarily attributed to their robust economies, high consumer spending on packaged goods, and well-established infrastructure supporting packaging manufacturing and distribution. Moreover, supportive regulatory environments encouraging sustainable practices further contribute to the dominance of these areas.
Nordic Plastic Caps and Closures Market Product Innovations
Recent innovations in the Nordic plastic caps and closures market include the introduction of lightweight designs utilizing materials like PE and PP, enhancing both sustainability and cost-effectiveness. For example, Berry Global Inc.'s Slimline range exemplifies this trend, catering to diverse applications in personal care and pharmaceuticals. Focus remains on improved recyclability and enhanced functionalities, such as tamper-evident seals and easy-open mechanisms.
Propelling Factors for Nordic Plastic Caps and Closures Market Growth
Several factors are driving the growth of the Nordic plastic caps and closures market. These include increasing demand for packaged goods across various industries, advancements in materials science leading to more sustainable and efficient packaging solutions, and supportive government regulations promoting recyclability and reducing plastic waste. The rising popularity of e-commerce further fuels demand for convenient and protective packaging, boosting the market's overall growth.
Obstacles in the Nordic Plastic Caps and Closures Market
The Nordic plastic caps and closures market faces challenges including fluctuating raw material prices, stringent environmental regulations impacting material choices, and intensifying competition among established and emerging players. Supply chain disruptions, particularly felt during the recent global events, can also impact production and pricing. The market's ability to adapt to these challenges and embrace sustainable solutions will be crucial for future success.
Future Opportunities in Nordic Plastic Caps and Closures Market
Future growth opportunities lie in the adoption of sustainable and innovative packaging solutions. This includes increased focus on bioplastics, compostable materials, and improved recycling infrastructure. The market also presents opportunities in smart packaging technologies, offering enhanced consumer engagement and product tracking. Further exploration of new applications, including medical devices and specialized industrial uses, can further expand market potential.
Major Players in the Nordic Plastic Caps and Closures Market Ecosystem
- Amcor Group GmbH
- Bericap Holding GmbH
- Berry Global Inc.
- Carmo A/S
- Fin-Korkki Oy
- Modulpac AB
- Tetra Pak International SV
- Robinson PLC
Key Developments in Nordic Plastic Caps and Closures Market Industry
- October 2023: Berry Global Inc. launched the Slimline range, a lightweight tube closure solution made from PE and PP, targeting personal care and pharmaceutical applications.
- February 2024: Robinson PLC exhibited its products at Packaging Innovations and Empack in Birmingham, UK, showcasing its presence in the Danish market.
Strategic Nordic Plastic Caps and Closures Market Forecast
The Nordic plastic caps and closures market is poised for continued growth, driven by innovative product developments, increasing demand from various sectors, and a growing emphasis on sustainability. The market's future trajectory will be significantly influenced by advancements in materials science, consumer preference shifts towards eco-friendly packaging, and the regulatory landscape governing plastic waste management. Continued innovation and strategic partnerships will be crucial for success in this dynamic and competitive market.
Nordic Plastic Caps and Closures Market Segmentation
-
1. Resin
- 1.1. Polyethylene (PE)
- 1.2. Polyethylene Terephthalate (PET)
- 1.3. Polypropylene (PP)
- 1.4. Other Pl
-
2. Product Type
- 2.1. Threaded - Screw Caps, Vacuum, etc.
- 2.2. Dispensing
- 2.3. Unthread
- 2.4. Child-resistant
-
3. End-user Industries
- 3.1. Food
-
3.2. Beverage
- 3.2.1. Bottled Water
- 3.2.2. Carbonated Soft Drinks
- 3.2.3. Alcoholic Beverages
- 3.2.4. Juices and Energy Drinks
- 3.2.5. Other Beverages
- 3.3. Personal Care and Cosmetics
- 3.4. Household Chemicals
- 3.5. Other End-user Industries
Nordic Plastic Caps and Closures Market Segmentation By Geography
-
1. North America
- 1.1. United States
- 1.2. Canada
- 1.3. Mexico
-
2. South America
- 2.1. Brazil
- 2.2. Argentina
- 2.3. Rest of South America
-
3. Europe
- 3.1. United Kingdom
- 3.2. Germany
- 3.3. France
- 3.4. Italy
- 3.5. Spain
- 3.6. Russia
- 3.7. Benelux
- 3.8. Nordics
- 3.9. Rest of Europe
-
4. Middle East & Africa
- 4.1. Turkey
- 4.2. Israel
- 4.3. GCC
- 4.4. North Africa
- 4.5. South Africa
- 4.6. Rest of Middle East & Africa
-
5. Asia Pacific
- 5.1. China
- 5.2. India
- 5.3. Japan
- 5.4. South Korea
- 5.5. ASEAN
- 5.6. Oceania
- 5.7. Rest of Asia Pacific
Nordic Plastic Caps and Closures Market Regional Market Share
Geographic Coverage of Nordic Plastic Caps and Closures Market
Nordic Plastic Caps and Closures Market REPORT HIGHLIGHTS
| Aspects | Details |
|---|---|
| Study Period | 2020-2034 |
| Base Year | 2025 |
| Estimated Year | 2026 |
| Forecast Period | 2026-2034 |
| Historical Period | 2020-2025 |
| Growth Rate | CAGR of 2.58% from 2020-2034 |
| Segmentation |
|
Table of Contents
- 1. Introduction
- 1.1. Research Scope
- 1.2. Market Segmentation
- 1.3. Research Objective
- 1.4. Definitions and Assumptions
- 2. Executive Summary
- 2.1. Market Snapshot
- 3. Market Dynamics
- 3.1. Market Drivers
- 3.2. Market Restrains
- 3.3. Market Trends
- 3.4. Market Opportunities
- 4. Market Factor Analysis
- 4.1. Porters Five Forces
- 4.1.1. Bargaining Power of Suppliers
- 4.1.2. Bargaining Power of Buyers
- 4.1.3. Threat of New Entrants
- 4.1.4. Threat of Substitutes
- 4.1.5. Competitive Rivalry
- 4.2. PESTEL analysis
- 4.3. BCG Analysis
- 4.3.1. Stars (High Growth, High Market Share)
- 4.3.2. Cash Cows (Low Growth, High Market Share)
- 4.3.3. Question Mark (High Growth, Low Market Share)
- 4.3.4. Dogs (Low Growth, Low Market Share)
- 4.4. Ansoff Matrix Analysis
- 4.5. Supply Chain Analysis
- 4.6. Regulatory Landscape
- 4.7. Current Market Potential and Opportunity Assessment (TAM–SAM–SOM Framework)
- 4.8. DMV Analyst Note
- 4.1. Porters Five Forces
- 5. Market Analysis, Insights and Forecast 2021-2033
- 5.1. Market Analysis, Insights and Forecast - by Resin
- 5.1.1. Polyethylene (PE)
- 5.1.2. Polyethylene Terephthalate (PET)
- 5.1.3. Polypropylene (PP)
- 5.1.4. Other Pl
- 5.2. Market Analysis, Insights and Forecast - by Product Type
- 5.2.1. Threaded - Screw Caps, Vacuum, etc.
- 5.2.2. Dispensing
- 5.2.3. Unthread
- 5.2.4. Child-resistant
- 5.3. Market Analysis, Insights and Forecast - by End-user Industries
- 5.3.1. Food
- 5.3.2. Beverage
- 5.3.2.1. Bottled Water
- 5.3.2.2. Carbonated Soft Drinks
- 5.3.2.3. Alcoholic Beverages
- 5.3.2.4. Juices and Energy Drinks
- 5.3.2.5. Other Beverages
- 5.3.3. Personal Care and Cosmetics
- 5.3.4. Household Chemicals
- 5.3.5. Other End-user Industries
- 5.4. Market Analysis, Insights and Forecast - by Region
- 5.4.1. North America
- 5.4.2. South America
- 5.4.3. Europe
- 5.4.4. Middle East & Africa
- 5.4.5. Asia Pacific
- 5.1. Market Analysis, Insights and Forecast - by Resin
- 6. Global Nordic Plastic Caps and Closures Market Analysis, Insights and Forecast, 2021-2033
- 6.1. Market Analysis, Insights and Forecast - by Resin
- 6.1.1. Polyethylene (PE)
- 6.1.2. Polyethylene Terephthalate (PET)
- 6.1.3. Polypropylene (PP)
- 6.1.4. Other Pl
- 6.2. Market Analysis, Insights and Forecast - by Product Type
- 6.2.1. Threaded - Screw Caps, Vacuum, etc.
- 6.2.2. Dispensing
- 6.2.3. Unthread
- 6.2.4. Child-resistant
- 6.3. Market Analysis, Insights and Forecast - by End-user Industries
- 6.3.1. Food
- 6.3.2. Beverage
- 6.3.2.1. Bottled Water
- 6.3.2.2. Carbonated Soft Drinks
- 6.3.2.3. Alcoholic Beverages
- 6.3.2.4. Juices and Energy Drinks
- 6.3.2.5. Other Beverages
- 6.3.3. Personal Care and Cosmetics
- 6.3.4. Household Chemicals
- 6.3.5. Other End-user Industries
- 6.1. Market Analysis, Insights and Forecast - by Resin
- 7. North America Nordic Plastic Caps and Closures Market Analysis, Insights and Forecast, 2020-2032
- 7.1. Market Analysis, Insights and Forecast - by Resin
- 7.1.1. Polyethylene (PE)
- 7.1.2. Polyethylene Terephthalate (PET)
- 7.1.3. Polypropylene (PP)
- 7.1.4. Other Pl
- 7.2. Market Analysis, Insights and Forecast - by Product Type
- 7.2.1. Threaded - Screw Caps, Vacuum, etc.
- 7.2.2. Dispensing
- 7.2.3. Unthread
- 7.2.4. Child-resistant
- 7.3. Market Analysis, Insights and Forecast - by End-user Industries
- 7.3.1. Food
- 7.3.2. Beverage
- 7.3.2.1. Bottled Water
- 7.3.2.2. Carbonated Soft Drinks
- 7.3.2.3. Alcoholic Beverages
- 7.3.2.4. Juices and Energy Drinks
- 7.3.2.5. Other Beverages
- 7.3.3. Personal Care and Cosmetics
- 7.3.4. Household Chemicals
- 7.3.5. Other End-user Industries
- 7.1. Market Analysis, Insights and Forecast - by Resin
- 8. South America Nordic Plastic Caps and Closures Market Analysis, Insights and Forecast, 2020-2032
- 8.1. Market Analysis, Insights and Forecast - by Resin
- 8.1.1. Polyethylene (PE)
- 8.1.2. Polyethylene Terephthalate (PET)
- 8.1.3. Polypropylene (PP)
- 8.1.4. Other Pl
- 8.2. Market Analysis, Insights and Forecast - by Product Type
- 8.2.1. Threaded - Screw Caps, Vacuum, etc.
- 8.2.2. Dispensing
- 8.2.3. Unthread
- 8.2.4. Child-resistant
- 8.3. Market Analysis, Insights and Forecast - by End-user Industries
- 8.3.1. Food
- 8.3.2. Beverage
- 8.3.2.1. Bottled Water
- 8.3.2.2. Carbonated Soft Drinks
- 8.3.2.3. Alcoholic Beverages
- 8.3.2.4. Juices and Energy Drinks
- 8.3.2.5. Other Beverages
- 8.3.3. Personal Care and Cosmetics
- 8.3.4. Household Chemicals
- 8.3.5. Other End-user Industries
- 8.1. Market Analysis, Insights and Forecast - by Resin
- 9. Europe Nordic Plastic Caps and Closures Market Analysis, Insights and Forecast, 2020-2032
- 9.1. Market Analysis, Insights and Forecast - by Resin
- 9.1.1. Polyethylene (PE)
- 9.1.2. Polyethylene Terephthalate (PET)
- 9.1.3. Polypropylene (PP)
- 9.1.4. Other Pl
- 9.2. Market Analysis, Insights and Forecast - by Product Type
- 9.2.1. Threaded - Screw Caps, Vacuum, etc.
- 9.2.2. Dispensing
- 9.2.3. Unthread
- 9.2.4. Child-resistant
- 9.3. Market Analysis, Insights and Forecast - by End-user Industries
- 9.3.1. Food
- 9.3.2. Beverage
- 9.3.2.1. Bottled Water
- 9.3.2.2. Carbonated Soft Drinks
- 9.3.2.3. Alcoholic Beverages
- 9.3.2.4. Juices and Energy Drinks
- 9.3.2.5. Other Beverages
- 9.3.3. Personal Care and Cosmetics
- 9.3.4. Household Chemicals
- 9.3.5. Other End-user Industries
- 9.1. Market Analysis, Insights and Forecast - by Resin
- 10. Middle East & Africa Nordic Plastic Caps and Closures Market Analysis, Insights and Forecast, 2020-2032
- 10.1. Market Analysis, Insights and Forecast - by Resin
- 10.1.1. Polyethylene (PE)
- 10.1.2. Polyethylene Terephthalate (PET)
- 10.1.3. Polypropylene (PP)
- 10.1.4. Other Pl
- 10.2. Market Analysis, Insights and Forecast - by Product Type
- 10.2.1. Threaded - Screw Caps, Vacuum, etc.
- 10.2.2. Dispensing
- 10.2.3. Unthread
- 10.2.4. Child-resistant
- 10.3. Market Analysis, Insights and Forecast - by End-user Industries
- 10.3.1. Food
- 10.3.2. Beverage
- 10.3.2.1. Bottled Water
- 10.3.2.2. Carbonated Soft Drinks
- 10.3.2.3. Alcoholic Beverages
- 10.3.2.4. Juices and Energy Drinks
- 10.3.2.5. Other Beverages
- 10.3.3. Personal Care and Cosmetics
- 10.3.4. Household Chemicals
- 10.3.5. Other End-user Industries
- 10.1. Market Analysis, Insights and Forecast - by Resin
- 11. Asia Pacific Nordic Plastic Caps and Closures Market Analysis, Insights and Forecast, 2020-2032
- 11.1. Market Analysis, Insights and Forecast - by Resin
- 11.1.1. Polyethylene (PE)
- 11.1.2. Polyethylene Terephthalate (PET)
- 11.1.3. Polypropylene (PP)
- 11.1.4. Other Pl
- 11.2. Market Analysis, Insights and Forecast - by Product Type
- 11.2.1. Threaded - Screw Caps, Vacuum, etc.
- 11.2.2. Dispensing
- 11.2.3. Unthread
- 11.2.4. Child-resistant
- 11.3. Market Analysis, Insights and Forecast - by End-user Industries
- 11.3.1. Food
- 11.3.2. Beverage
- 11.3.2.1. Bottled Water
- 11.3.2.2. Carbonated Soft Drinks
- 11.3.2.3. Alcoholic Beverages
- 11.3.2.4. Juices and Energy Drinks
- 11.3.2.5. Other Beverages
- 11.3.3. Personal Care and Cosmetics
- 11.3.4. Household Chemicals
- 11.3.5. Other End-user Industries
- 11.1. Market Analysis, Insights and Forecast - by Resin
- 12. Competitive Analysis
- 12.1. Company Profiles
- 12.1.1 Amcor Group GmbH
- 12.1.1.1. Company Overview
- 12.1.1.2. Products
- 12.1.1.3. Company Financials
- 12.1.1.4. SWOT Analysis
- 12.1.2 Bericap Holding GmbH
- 12.1.2.1. Company Overview
- 12.1.2.2. Products
- 12.1.2.3. Company Financials
- 12.1.2.4. SWOT Analysis
- 12.1.3 Berry Global Inc
- 12.1.3.1. Company Overview
- 12.1.3.2. Products
- 12.1.3.3. Company Financials
- 12.1.3.4. SWOT Analysis
- 12.1.4 Carmo A/S
- 12.1.4.1. Company Overview
- 12.1.4.2. Products
- 12.1.4.3. Company Financials
- 12.1.4.4. SWOT Analysis
- 12.1.5 Fin-Korkki Oy
- 12.1.5.1. Company Overview
- 12.1.5.2. Products
- 12.1.5.3. Company Financials
- 12.1.5.4. SWOT Analysis
- 12.1.6 Modulpac AB
- 12.1.6.1. Company Overview
- 12.1.6.2. Products
- 12.1.6.3. Company Financials
- 12.1.6.4. SWOT Analysis
- 12.1.7 Tetra Pak International SV
- 12.1.7.1. Company Overview
- 12.1.7.2. Products
- 12.1.7.3. Company Financials
- 12.1.7.4. SWOT Analysis
- 12.1.8 Robinson PLC8 2 Heat Map Analysis8 3 Competitor Analysis - Emerging vs Established Player
- 12.1.8.1. Company Overview
- 12.1.8.2. Products
- 12.1.8.3. Company Financials
- 12.1.8.4. SWOT Analysis
- 12.1.1 Amcor Group GmbH
- 12.2. Market Entropy
- 12.2.1 Company's Key Areas Served
- 12.2.2 Recent Developments
- 12.3. Company Market Share Analysis 2025
- 12.3.1 Top 5 Companies Market Share Analysis
- 12.3.2 Top 3 Companies Market Share Analysis
- 12.4. List of Potential Customers
- 13. Research Methodology
List of Figures
- Figure 1: Global Nordic Plastic Caps and Closures Market Revenue Breakdown (Million, %) by Region 2025 & 2033
- Figure 2: Global Nordic Plastic Caps and Closures Market Volume Breakdown (Billion, %) by Region 2025 & 2033
- Figure 3: North America Nordic Plastic Caps and Closures Market Revenue (Million), by Resin 2025 & 2033
- Figure 4: North America Nordic Plastic Caps and Closures Market Volume (Billion), by Resin 2025 & 2033
- Figure 5: North America Nordic Plastic Caps and Closures Market Revenue Share (%), by Resin 2025 & 2033
- Figure 6: North America Nordic Plastic Caps and Closures Market Volume Share (%), by Resin 2025 & 2033
- Figure 7: North America Nordic Plastic Caps and Closures Market Revenue (Million), by Product Type 2025 & 2033
- Figure 8: North America Nordic Plastic Caps and Closures Market Volume (Billion), by Product Type 2025 & 2033
- Figure 9: North America Nordic Plastic Caps and Closures Market Revenue Share (%), by Product Type 2025 & 2033
- Figure 10: North America Nordic Plastic Caps and Closures Market Volume Share (%), by Product Type 2025 & 2033
- Figure 11: North America Nordic Plastic Caps and Closures Market Revenue (Million), by End-user Industries 2025 & 2033
- Figure 12: North America Nordic Plastic Caps and Closures Market Volume (Billion), by End-user Industries 2025 & 2033
- Figure 13: North America Nordic Plastic Caps and Closures Market Revenue Share (%), by End-user Industries 2025 & 2033
- Figure 14: North America Nordic Plastic Caps and Closures Market Volume Share (%), by End-user Industries 2025 & 2033
- Figure 15: North America Nordic Plastic Caps and Closures Market Revenue (Million), by Country 2025 & 2033
- Figure 16: North America Nordic Plastic Caps and Closures Market Volume (Billion), by Country 2025 & 2033
- Figure 17: North America Nordic Plastic Caps and Closures Market Revenue Share (%), by Country 2025 & 2033
- Figure 18: North America Nordic Plastic Caps and Closures Market Volume Share (%), by Country 2025 & 2033
- Figure 19: South America Nordic Plastic Caps and Closures Market Revenue (Million), by Resin 2025 & 2033
- Figure 20: South America Nordic Plastic Caps and Closures Market Volume (Billion), by Resin 2025 & 2033
- Figure 21: South America Nordic Plastic Caps and Closures Market Revenue Share (%), by Resin 2025 & 2033
- Figure 22: South America Nordic Plastic Caps and Closures Market Volume Share (%), by Resin 2025 & 2033
- Figure 23: South America Nordic Plastic Caps and Closures Market Revenue (Million), by Product Type 2025 & 2033
- Figure 24: South America Nordic Plastic Caps and Closures Market Volume (Billion), by Product Type 2025 & 2033
- Figure 25: South America Nordic Plastic Caps and Closures Market Revenue Share (%), by Product Type 2025 & 2033
- Figure 26: South America Nordic Plastic Caps and Closures Market Volume Share (%), by Product Type 2025 & 2033
- Figure 27: South America Nordic Plastic Caps and Closures Market Revenue (Million), by End-user Industries 2025 & 2033
- Figure 28: South America Nordic Plastic Caps and Closures Market Volume (Billion), by End-user Industries 2025 & 2033
- Figure 29: South America Nordic Plastic Caps and Closures Market Revenue Share (%), by End-user Industries 2025 & 2033
- Figure 30: South America Nordic Plastic Caps and Closures Market Volume Share (%), by End-user Industries 2025 & 2033
- Figure 31: South America Nordic Plastic Caps and Closures Market Revenue (Million), by Country 2025 & 2033
- Figure 32: South America Nordic Plastic Caps and Closures Market Volume (Billion), by Country 2025 & 2033
- Figure 33: South America Nordic Plastic Caps and Closures Market Revenue Share (%), by Country 2025 & 2033
- Figure 34: South America Nordic Plastic Caps and Closures Market Volume Share (%), by Country 2025 & 2033
- Figure 35: Europe Nordic Plastic Caps and Closures Market Revenue (Million), by Resin 2025 & 2033
- Figure 36: Europe Nordic Plastic Caps and Closures Market Volume (Billion), by Resin 2025 & 2033
- Figure 37: Europe Nordic Plastic Caps and Closures Market Revenue Share (%), by Resin 2025 & 2033
- Figure 38: Europe Nordic Plastic Caps and Closures Market Volume Share (%), by Resin 2025 & 2033
- Figure 39: Europe Nordic Plastic Caps and Closures Market Revenue (Million), by Product Type 2025 & 2033
- Figure 40: Europe Nordic Plastic Caps and Closures Market Volume (Billion), by Product Type 2025 & 2033
- Figure 41: Europe Nordic Plastic Caps and Closures Market Revenue Share (%), by Product Type 2025 & 2033
- Figure 42: Europe Nordic Plastic Caps and Closures Market Volume Share (%), by Product Type 2025 & 2033
- Figure 43: Europe Nordic Plastic Caps and Closures Market Revenue (Million), by End-user Industries 2025 & 2033
- Figure 44: Europe Nordic Plastic Caps and Closures Market Volume (Billion), by End-user Industries 2025 & 2033
- Figure 45: Europe Nordic Plastic Caps and Closures Market Revenue Share (%), by End-user Industries 2025 & 2033
- Figure 46: Europe Nordic Plastic Caps and Closures Market Volume Share (%), by End-user Industries 2025 & 2033
- Figure 47: Europe Nordic Plastic Caps and Closures Market Revenue (Million), by Country 2025 & 2033
- Figure 48: Europe Nordic Plastic Caps and Closures Market Volume (Billion), by Country 2025 & 2033
- Figure 49: Europe Nordic Plastic Caps and Closures Market Revenue Share (%), by Country 2025 & 2033
- Figure 50: Europe Nordic Plastic Caps and Closures Market Volume Share (%), by Country 2025 & 2033
- Figure 51: Middle East & Africa Nordic Plastic Caps and Closures Market Revenue (Million), by Resin 2025 & 2033
- Figure 52: Middle East & Africa Nordic Plastic Caps and Closures Market Volume (Billion), by Resin 2025 & 2033
- Figure 53: Middle East & Africa Nordic Plastic Caps and Closures Market Revenue Share (%), by Resin 2025 & 2033
- Figure 54: Middle East & Africa Nordic Plastic Caps and Closures Market Volume Share (%), by Resin 2025 & 2033
- Figure 55: Middle East & Africa Nordic Plastic Caps and Closures Market Revenue (Million), by Product Type 2025 & 2033
- Figure 56: Middle East & Africa Nordic Plastic Caps and Closures Market Volume (Billion), by Product Type 2025 & 2033
- Figure 57: Middle East & Africa Nordic Plastic Caps and Closures Market Revenue Share (%), by Product Type 2025 & 2033
- Figure 58: Middle East & Africa Nordic Plastic Caps and Closures Market Volume Share (%), by Product Type 2025 & 2033
- Figure 59: Middle East & Africa Nordic Plastic Caps and Closures Market Revenue (Million), by End-user Industries 2025 & 2033
- Figure 60: Middle East & Africa Nordic Plastic Caps and Closures Market Volume (Billion), by End-user Industries 2025 & 2033
- Figure 61: Middle East & Africa Nordic Plastic Caps and Closures Market Revenue Share (%), by End-user Industries 2025 & 2033
- Figure 62: Middle East & Africa Nordic Plastic Caps and Closures Market Volume Share (%), by End-user Industries 2025 & 2033
- Figure 63: Middle East & Africa Nordic Plastic Caps and Closures Market Revenue (Million), by Country 2025 & 2033
- Figure 64: Middle East & Africa Nordic Plastic Caps and Closures Market Volume (Billion), by Country 2025 & 2033
- Figure 65: Middle East & Africa Nordic Plastic Caps and Closures Market Revenue Share (%), by Country 2025 & 2033
- Figure 66: Middle East & Africa Nordic Plastic Caps and Closures Market Volume Share (%), by Country 2025 & 2033
- Figure 67: Asia Pacific Nordic Plastic Caps and Closures Market Revenue (Million), by Resin 2025 & 2033
- Figure 68: Asia Pacific Nordic Plastic Caps and Closures Market Volume (Billion), by Resin 2025 & 2033
- Figure 69: Asia Pacific Nordic Plastic Caps and Closures Market Revenue Share (%), by Resin 2025 & 2033
- Figure 70: Asia Pacific Nordic Plastic Caps and Closures Market Volume Share (%), by Resin 2025 & 2033
- Figure 71: Asia Pacific Nordic Plastic Caps and Closures Market Revenue (Million), by Product Type 2025 & 2033
- Figure 72: Asia Pacific Nordic Plastic Caps and Closures Market Volume (Billion), by Product Type 2025 & 2033
- Figure 73: Asia Pacific Nordic Plastic Caps and Closures Market Revenue Share (%), by Product Type 2025 & 2033
- Figure 74: Asia Pacific Nordic Plastic Caps and Closures Market Volume Share (%), by Product Type 2025 & 2033
- Figure 75: Asia Pacific Nordic Plastic Caps and Closures Market Revenue (Million), by End-user Industries 2025 & 2033
- Figure 76: Asia Pacific Nordic Plastic Caps and Closures Market Volume (Billion), by End-user Industries 2025 & 2033
- Figure 77: Asia Pacific Nordic Plastic Caps and Closures Market Revenue Share (%), by End-user Industries 2025 & 2033
- Figure 78: Asia Pacific Nordic Plastic Caps and Closures Market Volume Share (%), by End-user Industries 2025 & 2033
- Figure 79: Asia Pacific Nordic Plastic Caps and Closures Market Revenue (Million), by Country 2025 & 2033
- Figure 80: Asia Pacific Nordic Plastic Caps and Closures Market Volume (Billion), by Country 2025 & 2033
- Figure 81: Asia Pacific Nordic Plastic Caps and Closures Market Revenue Share (%), by Country 2025 & 2033
- Figure 82: Asia Pacific Nordic Plastic Caps and Closures Market Volume Share (%), by Country 2025 & 2033
List of Tables
- Table 1: Global Nordic Plastic Caps and Closures Market Revenue Million Forecast, by Resin 2020 & 2033
- Table 2: Global Nordic Plastic Caps and Closures Market Volume Billion Forecast, by Resin 2020 & 2033
- Table 3: Global Nordic Plastic Caps and Closures Market Revenue Million Forecast, by Product Type 2020 & 2033
- Table 4: Global Nordic Plastic Caps and Closures Market Volume Billion Forecast, by Product Type 2020 & 2033
- Table 5: Global Nordic Plastic Caps and Closures Market Revenue Million Forecast, by End-user Industries 2020 & 2033
- Table 6: Global Nordic Plastic Caps and Closures Market Volume Billion Forecast, by End-user Industries 2020 & 2033
- Table 7: Global Nordic Plastic Caps and Closures Market Revenue Million Forecast, by Region 2020 & 2033
- Table 8: Global Nordic Plastic Caps and Closures Market Volume Billion Forecast, by Region 2020 & 2033
- Table 9: Global Nordic Plastic Caps and Closures Market Revenue Million Forecast, by Resin 2020 & 2033
- Table 10: Global Nordic Plastic Caps and Closures Market Volume Billion Forecast, by Resin 2020 & 2033
- Table 11: Global Nordic Plastic Caps and Closures Market Revenue Million Forecast, by Product Type 2020 & 2033
- Table 12: Global Nordic Plastic Caps and Closures Market Volume Billion Forecast, by Product Type 2020 & 2033
- Table 13: Global Nordic Plastic Caps and Closures Market Revenue Million Forecast, by End-user Industries 2020 & 2033
- Table 14: Global Nordic Plastic Caps and Closures Market Volume Billion Forecast, by End-user Industries 2020 & 2033
- Table 15: Global Nordic Plastic Caps and Closures Market Revenue Million Forecast, by Country 2020 & 2033
- Table 16: Global Nordic Plastic Caps and Closures Market Volume Billion Forecast, by Country 2020 & 2033
- Table 17: United States Nordic Plastic Caps and Closures Market Revenue (Million) Forecast, by Application 2020 & 2033
- Table 18: United States Nordic Plastic Caps and Closures Market Volume (Billion) Forecast, by Application 2020 & 2033
- Table 19: Canada Nordic Plastic Caps and Closures Market Revenue (Million) Forecast, by Application 2020 & 2033
- Table 20: Canada Nordic Plastic Caps and Closures Market Volume (Billion) Forecast, by Application 2020 & 2033
- Table 21: Mexico Nordic Plastic Caps and Closures Market Revenue (Million) Forecast, by Application 2020 & 2033
- Table 22: Mexico Nordic Plastic Caps and Closures Market Volume (Billion) Forecast, by Application 2020 & 2033
- Table 23: Global Nordic Plastic Caps and Closures Market Revenue Million Forecast, by Resin 2020 & 2033
- Table 24: Global Nordic Plastic Caps and Closures Market Volume Billion Forecast, by Resin 2020 & 2033
- Table 25: Global Nordic Plastic Caps and Closures Market Revenue Million Forecast, by Product Type 2020 & 2033
- Table 26: Global Nordic Plastic Caps and Closures Market Volume Billion Forecast, by Product Type 2020 & 2033
- Table 27: Global Nordic Plastic Caps and Closures Market Revenue Million Forecast, by End-user Industries 2020 & 2033
- Table 28: Global Nordic Plastic Caps and Closures Market Volume Billion Forecast, by End-user Industries 2020 & 2033
- Table 29: Global Nordic Plastic Caps and Closures Market Revenue Million Forecast, by Country 2020 & 2033
- Table 30: Global Nordic Plastic Caps and Closures Market Volume Billion Forecast, by Country 2020 & 2033
- Table 31: Brazil Nordic Plastic Caps and Closures Market Revenue (Million) Forecast, by Application 2020 & 2033
- Table 32: Brazil Nordic Plastic Caps and Closures Market Volume (Billion) Forecast, by Application 2020 & 2033
- Table 33: Argentina Nordic Plastic Caps and Closures Market Revenue (Million) Forecast, by Application 2020 & 2033
- Table 34: Argentina Nordic Plastic Caps and Closures Market Volume (Billion) Forecast, by Application 2020 & 2033
- Table 35: Rest of South America Nordic Plastic Caps and Closures Market Revenue (Million) Forecast, by Application 2020 & 2033
- Table 36: Rest of South America Nordic Plastic Caps and Closures Market Volume (Billion) Forecast, by Application 2020 & 2033
- Table 37: Global Nordic Plastic Caps and Closures Market Revenue Million Forecast, by Resin 2020 & 2033
- Table 38: Global Nordic Plastic Caps and Closures Market Volume Billion Forecast, by Resin 2020 & 2033
- Table 39: Global Nordic Plastic Caps and Closures Market Revenue Million Forecast, by Product Type 2020 & 2033
- Table 40: Global Nordic Plastic Caps and Closures Market Volume Billion Forecast, by Product Type 2020 & 2033
- Table 41: Global Nordic Plastic Caps and Closures Market Revenue Million Forecast, by End-user Industries 2020 & 2033
- Table 42: Global Nordic Plastic Caps and Closures Market Volume Billion Forecast, by End-user Industries 2020 & 2033
- Table 43: Global Nordic Plastic Caps and Closures Market Revenue Million Forecast, by Country 2020 & 2033
- Table 44: Global Nordic Plastic Caps and Closures Market Volume Billion Forecast, by Country 2020 & 2033
- Table 45: United Kingdom Nordic Plastic Caps and Closures Market Revenue (Million) Forecast, by Application 2020 & 2033
- Table 46: United Kingdom Nordic Plastic Caps and Closures Market Volume (Billion) Forecast, by Application 2020 & 2033
- Table 47: Germany Nordic Plastic Caps and Closures Market Revenue (Million) Forecast, by Application 2020 & 2033
- Table 48: Germany Nordic Plastic Caps and Closures Market Volume (Billion) Forecast, by Application 2020 & 2033
- Table 49: France Nordic Plastic Caps and Closures Market Revenue (Million) Forecast, by Application 2020 & 2033
- Table 50: France Nordic Plastic Caps and Closures Market Volume (Billion) Forecast, by Application 2020 & 2033
- Table 51: Italy Nordic Plastic Caps and Closures Market Revenue (Million) Forecast, by Application 2020 & 2033
- Table 52: Italy Nordic Plastic Caps and Closures Market Volume (Billion) Forecast, by Application 2020 & 2033
- Table 53: Spain Nordic Plastic Caps and Closures Market Revenue (Million) Forecast, by Application 2020 & 2033
- Table 54: Spain Nordic Plastic Caps and Closures Market Volume (Billion) Forecast, by Application 2020 & 2033
- Table 55: Russia Nordic Plastic Caps and Closures Market Revenue (Million) Forecast, by Application 2020 & 2033
- Table 56: Russia Nordic Plastic Caps and Closures Market Volume (Billion) Forecast, by Application 2020 & 2033
- Table 57: Benelux Nordic Plastic Caps and Closures Market Revenue (Million) Forecast, by Application 2020 & 2033
- Table 58: Benelux Nordic Plastic Caps and Closures Market Volume (Billion) Forecast, by Application 2020 & 2033
- Table 59: Nordics Nordic Plastic Caps and Closures Market Revenue (Million) Forecast, by Application 2020 & 2033
- Table 60: Nordics Nordic Plastic Caps and Closures Market Volume (Billion) Forecast, by Application 2020 & 2033
- Table 61: Rest of Europe Nordic Plastic Caps and Closures Market Revenue (Million) Forecast, by Application 2020 & 2033
- Table 62: Rest of Europe Nordic Plastic Caps and Closures Market Volume (Billion) Forecast, by Application 2020 & 2033
- Table 63: Global Nordic Plastic Caps and Closures Market Revenue Million Forecast, by Resin 2020 & 2033
- Table 64: Global Nordic Plastic Caps and Closures Market Volume Billion Forecast, by Resin 2020 & 2033
- Table 65: Global Nordic Plastic Caps and Closures Market Revenue Million Forecast, by Product Type 2020 & 2033
- Table 66: Global Nordic Plastic Caps and Closures Market Volume Billion Forecast, by Product Type 2020 & 2033
- Table 67: Global Nordic Plastic Caps and Closures Market Revenue Million Forecast, by End-user Industries 2020 & 2033
- Table 68: Global Nordic Plastic Caps and Closures Market Volume Billion Forecast, by End-user Industries 2020 & 2033
- Table 69: Global Nordic Plastic Caps and Closures Market Revenue Million Forecast, by Country 2020 & 2033
- Table 70: Global Nordic Plastic Caps and Closures Market Volume Billion Forecast, by Country 2020 & 2033
- Table 71: Turkey Nordic Plastic Caps and Closures Market Revenue (Million) Forecast, by Application 2020 & 2033
- Table 72: Turkey Nordic Plastic Caps and Closures Market Volume (Billion) Forecast, by Application 2020 & 2033
- Table 73: Israel Nordic Plastic Caps and Closures Market Revenue (Million) Forecast, by Application 2020 & 2033
- Table 74: Israel Nordic Plastic Caps and Closures Market Volume (Billion) Forecast, by Application 2020 & 2033
- Table 75: GCC Nordic Plastic Caps and Closures Market Revenue (Million) Forecast, by Application 2020 & 2033
- Table 76: GCC Nordic Plastic Caps and Closures Market Volume (Billion) Forecast, by Application 2020 & 2033
- Table 77: North Africa Nordic Plastic Caps and Closures Market Revenue (Million) Forecast, by Application 2020 & 2033
- Table 78: North Africa Nordic Plastic Caps and Closures Market Volume (Billion) Forecast, by Application 2020 & 2033
- Table 79: South Africa Nordic Plastic Caps and Closures Market Revenue (Million) Forecast, by Application 2020 & 2033
- Table 80: South Africa Nordic Plastic Caps and Closures Market Volume (Billion) Forecast, by Application 2020 & 2033
- Table 81: Rest of Middle East & Africa Nordic Plastic Caps and Closures Market Revenue (Million) Forecast, by Application 2020 & 2033
- Table 82: Rest of Middle East & Africa Nordic Plastic Caps and Closures Market Volume (Billion) Forecast, by Application 2020 & 2033
- Table 83: Global Nordic Plastic Caps and Closures Market Revenue Million Forecast, by Resin 2020 & 2033
- Table 84: Global Nordic Plastic Caps and Closures Market Volume Billion Forecast, by Resin 2020 & 2033
- Table 85: Global Nordic Plastic Caps and Closures Market Revenue Million Forecast, by Product Type 2020 & 2033
- Table 86: Global Nordic Plastic Caps and Closures Market Volume Billion Forecast, by Product Type 2020 & 2033
- Table 87: Global Nordic Plastic Caps and Closures Market Revenue Million Forecast, by End-user Industries 2020 & 2033
- Table 88: Global Nordic Plastic Caps and Closures Market Volume Billion Forecast, by End-user Industries 2020 & 2033
- Table 89: Global Nordic Plastic Caps and Closures Market Revenue Million Forecast, by Country 2020 & 2033
- Table 90: Global Nordic Plastic Caps and Closures Market Volume Billion Forecast, by Country 2020 & 2033
- Table 91: China Nordic Plastic Caps and Closures Market Revenue (Million) Forecast, by Application 2020 & 2033
- Table 92: China Nordic Plastic Caps and Closures Market Volume (Billion) Forecast, by Application 2020 & 2033
- Table 93: India Nordic Plastic Caps and Closures Market Revenue (Million) Forecast, by Application 2020 & 2033
- Table 94: India Nordic Plastic Caps and Closures Market Volume (Billion) Forecast, by Application 2020 & 2033
- Table 95: Japan Nordic Plastic Caps and Closures Market Revenue (Million) Forecast, by Application 2020 & 2033
- Table 96: Japan Nordic Plastic Caps and Closures Market Volume (Billion) Forecast, by Application 2020 & 2033
- Table 97: South Korea Nordic Plastic Caps and Closures Market Revenue (Million) Forecast, by Application 2020 & 2033
- Table 98: South Korea Nordic Plastic Caps and Closures Market Volume (Billion) Forecast, by Application 2020 & 2033
- Table 99: ASEAN Nordic Plastic Caps and Closures Market Revenue (Million) Forecast, by Application 2020 & 2033
- Table 100: ASEAN Nordic Plastic Caps and Closures Market Volume (Billion) Forecast, by Application 2020 & 2033
- Table 101: Oceania Nordic Plastic Caps and Closures Market Revenue (Million) Forecast, by Application 2020 & 2033
- Table 102: Oceania Nordic Plastic Caps and Closures Market Volume (Billion) Forecast, by Application 2020 & 2033
- Table 103: Rest of Asia Pacific Nordic Plastic Caps and Closures Market Revenue (Million) Forecast, by Application 2020 & 2033
- Table 104: Rest of Asia Pacific Nordic Plastic Caps and Closures Market Volume (Billion) Forecast, by Application 2020 & 2033
Frequently Asked Questions
1. What is the projected Compound Annual Growth Rate (CAGR) of the Nordic Plastic Caps and Closures Market?
The projected CAGR is approximately 2.58%.
2. Which companies are prominent players in the Nordic Plastic Caps and Closures Market?
Key companies in the market include Amcor Group GmbH, Bericap Holding GmbH, Berry Global Inc, Carmo A/S, Fin-Korkki Oy, Modulpac AB, Tetra Pak International SV, Robinson PLC8 2 Heat Map Analysis8 3 Competitor Analysis - Emerging vs Established Player.
3. What are the main segments of the Nordic Plastic Caps and Closures Market?
The market segments include Resin, Product Type, End-user Industries.
4. Can you provide details about the market size?
The market size is estimated to be USD 1.25 Million as of 2022.
5. What are some drivers contributing to market growth?
Growing Tourism Boosts the Food and Beverage Industry; Increasing Product Innovation in the Market.
6. What are the notable trends driving market growth?
Polypropylene (PP) Segment is Estimated to Have the Largest Market Share.
7. Are there any restraints impacting market growth?
Growing Tourism Boosts the Food and Beverage Industry; Increasing Product Innovation in the Market.
8. Can you provide examples of recent developments in the market?
February 2024: Robinson PLC, a UK-based company operating in Denmark, exhibited its products at Packaging Innovations and Empack, hosted at Birmingham's National Exhibition Centre (NEC).
9. What pricing options are available for accessing the report?
Pricing options include single-user, multi-user, and enterprise licenses priced at USD 3800, USD 4500, and USD 5800 respectively.
10. Is the market size provided in terms of value or volume?
The market size is provided in terms of value, measured in Million and volume, measured in Billion.
11. Are there any specific market keywords associated with the report?
Yes, the market keyword associated with the report is "Nordic Plastic Caps and Closures Market," which aids in identifying and referencing the specific market segment covered.
12. How do I determine which pricing option suits my needs best?
The pricing options vary based on user requirements and access needs. Individual users may opt for single-user licenses, while businesses requiring broader access may choose multi-user or enterprise licenses for cost-effective access to the report.
13. Are there any additional resources or data provided in the Nordic Plastic Caps and Closures Market report?
While the report offers comprehensive insights, it's advisable to review the specific contents or supplementary materials provided to ascertain if additional resources or data are available.
14. How can I stay updated on further developments or reports in the Nordic Plastic Caps and Closures Market?
To stay informed about further developments, trends, and reports in the Nordic Plastic Caps and Closures Market, consider subscribing to industry newsletters, following relevant companies and organizations, or regularly checking reputable industry news sources and publications.
Methodology
Step 1 - Identification of Relevant Samples Size from Population Database


Step 2 - Approaches for Defining Global Market Size (Value, Volume* & Price*)

Note*: In applicable scenarios
Step 3 - Data Sources
Primary Research
- Web Analytics
- Survey Reports
- Research Institute
- Latest Research Reports
- Opinion Leaders
Secondary Research
- Annual Reports
- White Paper
- Latest Press Release
- Industry Association
- Paid Database
- Investor Presentations

Step 4 - Data Triangulation
Involves using different sources of information in order to increase the validity of a study
These sources are likely to be stakeholders in a program - participants, other researchers, program staff, other community members, and so on.
Then we put all data in single framework & apply various statistical tools to find out the dynamic on the market.
During the analysis stage, feedback from the stakeholder groups would be compared to determine areas of agreement as well as areas of divergence