

Key Insights
The North American liquid hand soap market is projected to reach $25.3 billion by 2025 and grow at a Compound Annual Growth Rate (CAGR) of 6.7% from 2025 to 2033. Increased hygiene awareness, driven by global health concerns, is a primary growth catalyst. Demand for moisturizing and natural formulations is rising due to a growing concern for skin health. The convenience of pump dispensers and refillable options further enhances product adoption. A significant trend towards sustainable and eco-friendly packaging is also influencing consumer choices. Key market players, including Unilever and Procter & Gamble, are investing in product innovation, marketing, and distribution to capture market share.
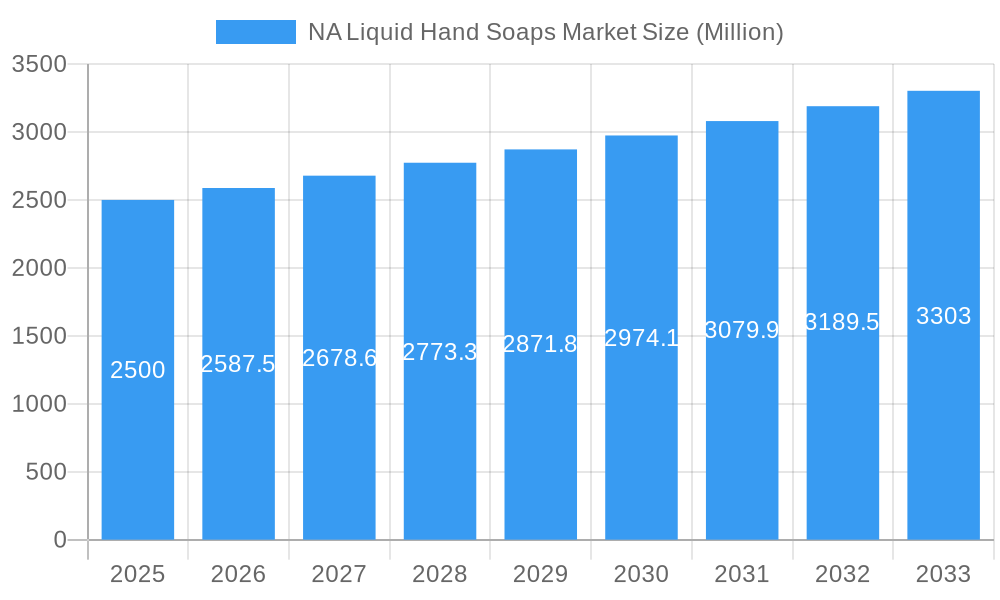
NA Liquid Hand Soaps Market Market Size (In Billion)
Market challenges include fluctuating raw material costs, impacting profitability, and intense competition from generic and private label brands. Adapting to evolving consumer preferences and emerging hygiene trends is crucial for sustained growth. Segmentation by packaging (dispensers, bottles, pouches) and distribution channels (supermarkets, convenience stores, online) offers targeted opportunities. With rising household incomes and a continued emphasis on personal hygiene, the North American liquid hand soap market is poised for robust expansion. Careful management of market constraints will be essential for maximizing performance.
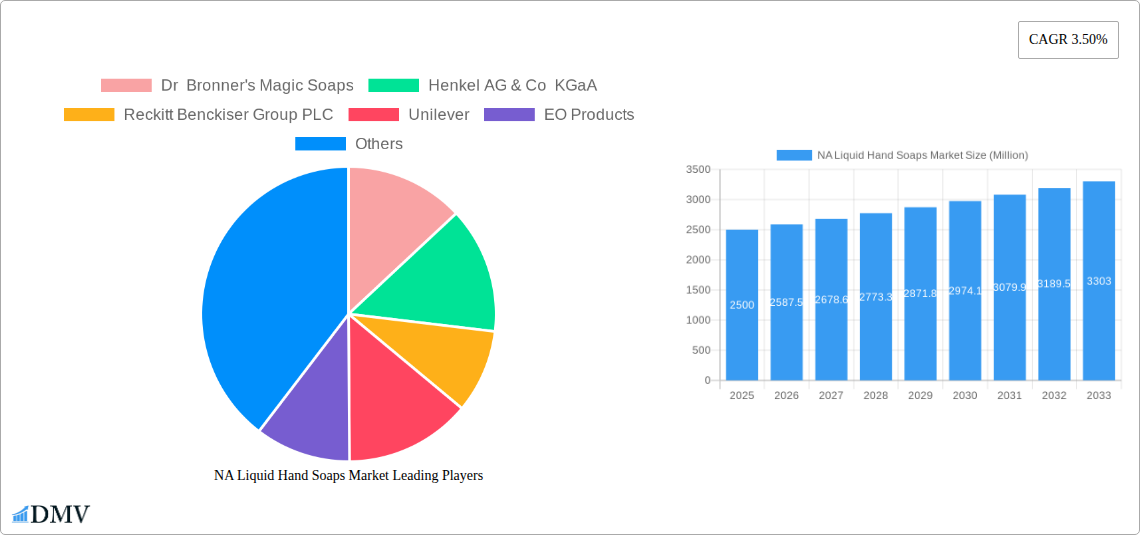
NA Liquid Hand Soaps Market Company Market Share
North American Liquid Hand Soaps Market: A Comprehensive Market Report (2019-2033)
This insightful report provides a detailed analysis of the North American liquid hand soaps market, offering a comprehensive overview of its current state, future trajectory, and key players. The study period covers 2019-2033, with 2025 serving as the base and estimated year. This report is essential for stakeholders seeking to understand market dynamics, identify growth opportunities, and make informed strategic decisions. The market is valued at xx Million in 2025 and is projected to reach xx Million by 2033, exhibiting a CAGR of xx% during the forecast period (2025-2033).
NA Liquid Hand Soaps Market Composition & Trends
This section delves into the competitive landscape of the North American liquid hand soaps market, evaluating market concentration, innovation, regulation, substitutes, end-users, and M&A activities. The market is moderately concentrated, with key players like Unilever, Reckitt Benckiser, and Colgate-Palmolive holding significant market share. However, smaller, specialized brands like Dr. Bronner's are gaining traction through their focus on natural and sustainable ingredients.
- Market Share Distribution (2025): Unilever (xx%), Reckitt Benckiser (xx%), Colgate-Palmolive (xx%), Others (xx%).
- Innovation Catalysts: Growing consumer preference for natural and sustainable products, increasing demand for antibacterial and antimicrobial soaps, and advancements in packaging technology.
- Regulatory Landscape: Stringent regulations regarding ingredient labeling and safety standards influence product formulations and marketing claims.
- Substitute Products: Other hand hygiene products like hand sanitizers and wipes compete for market share.
- End-User Profiles: Households, commercial establishments (restaurants, offices, healthcare facilities), and industrial settings.
- M&A Activities (2019-2024): A total of xx M&A deals were recorded, with a total estimated value of xx Million. Most deals focused on expanding product portfolios and strengthening distribution networks.
NA Liquid Hand Soaps Market Industry Evolution
The North American liquid hand soaps market has witnessed significant evolution driven by several factors. The historical period (2019-2024) saw consistent growth, fueled by increased consumer awareness of hygiene and the outbreak of the COVID-19 pandemic. This led to a surge in demand, particularly for antibacterial and antimicrobial soaps. The market then experienced a period of stabilization post-pandemic, with growth rates gradually returning to pre-pandemic levels. Technological advancements, such as the introduction of eco-friendly packaging and innovative dispensing systems, further shaped market dynamics. Consumer preferences are shifting towards natural, plant-based ingredients and sustainable packaging options, driving innovation and competition within the sector. The forecast period (2025-2033) is expected to see continued growth, albeit at a more moderate pace, driven by factors such as increasing disposable incomes and the ongoing focus on health and hygiene.
Leading Regions, Countries, or Segments in NA Liquid Hand Soaps Market
The US dominates the North American liquid hand soaps market, followed by Canada and Mexico. Within the US, key regions contributing significantly include the West Coast and the East Coast. By packaging type, pump dispensers hold the largest market share due to their convenience and cost-effectiveness. Supermarkets/hypermarkets represent the most significant distribution channel, followed by online retailers.
- Key Drivers (US): High per capita income, strong retail infrastructure, increased focus on personal hygiene, and a large consumer base.
- Key Drivers (Pump Dispensers): Consumer preference for convenience and ease of use, cost-effectiveness for manufacturers.
- Key Drivers (Supermarkets/Hypermarkets): Wide reach, established distribution networks, and the ability to offer a broad range of products.
The dominance of the US stems from its large population, high disposable income, and strong retail infrastructure. The popularity of pump dispensers reflects their convenience and cost-effectiveness for both manufacturers and consumers. The dominance of supermarket/hypermarkets as a distribution channel is rooted in their widespread presence and established distribution networks.
NA Liquid Hand Soaps Market Product Innovations
Recent innovations focus on incorporating natural and plant-based ingredients, enhancing antibacterial properties, and adopting sustainable packaging materials. Manufacturers are emphasizing unique selling propositions (USPs) like eco-friendly formulations, dermatological benefits, and innovative dispensing mechanisms. Technological advancements, such as improved formulation techniques and advanced packaging designs, are boosting product performance and appealing to environmentally conscious consumers. The introduction of refill pouches and the use of recycled plastics highlight the growing focus on sustainability.
Propelling Factors for NA Liquid Hand Soaps Market Growth
The market’s growth is fueled by several factors. Increased consumer awareness of hygiene practices, particularly after the COVID-19 pandemic, has spurred demand. Technological advancements in formulation and packaging have led to the development of more effective and environmentally friendly products. Favorable economic conditions in North America have increased disposable income, leading to higher spending on personal care products.
Obstacles in the NA Liquid Hand Soaps Market Market
Several challenges hinder market growth. Stringent regulations on ingredients and labeling can increase production costs and limit innovation. Supply chain disruptions, especially regarding raw materials, can affect product availability and pricing. Intense competition among established players and the emergence of new entrants create a challenging market environment.
Future Opportunities in NA Liquid Hand Soaps Market
Emerging opportunities lie in the development of premium, specialized hand soaps targeting specific consumer needs, such as those with sensitive skin. The growing demand for sustainable and eco-friendly products presents significant opportunities for manufacturers who can offer innovative and environmentally responsible solutions. Expanding distribution channels into emerging online marketplaces and reaching new demographic segments will also unlock significant growth potential.
Major Players in the NA Liquid Hand Soaps Market Ecosystem
- Dr. Bronner's Magic Soaps
- Henkel AG & Co KGaA
- Reckitt Benckiser Group PLC
- Unilever
- EO Products
- The Hain Celestial Group Inc
- Colgate-Palmolive Company
- S C Johnson & Son Inc
- Kao Corporation
- The J R Watkins Co
Key Developments in NA Liquid Hand Soaps Market Industry
- 2022 Q4: Unilever launches a new range of plant-based hand soaps.
- 2023 Q1: Reckitt Benckiser acquires a smaller hand soap manufacturer, expanding its product portfolio.
- 2023 Q3: Colgate-Palmolive introduces innovative refill packaging to promote sustainability.
- Further details on specific developments with dates and impact will be included in the full report.
Strategic NA Liquid Hand Soaps Market Forecast
The North American liquid hand soaps market is poised for continued growth, driven by rising consumer demand for hygiene products, innovation in sustainable packaging, and a focus on natural ingredients. New product development, expansion into emerging distribution channels, and targeted marketing campaigns will play a crucial role in shaping market dynamics and unlocking future growth potential. The market's trajectory is promising, with opportunities for significant expansion across various segments and regions.
NA Liquid Hand Soaps Market Segmentation
-
1. Packaging Type
- 1.1. Pump Dispensers
- 1.2. Bottles/Containers (Refill)
- 1.3. Pouches (Refill)
-
2. Distribution Channel
- 2.1. Supermarkets/Hypermarkets
- 2.2. Convenience Stores
- 2.3. Online Retailers
- 2.4. Other Distribution Channels
-
3. Geography
- 3.1. United States
- 3.2. Canada
- 3.3. Mexico
- 3.4. Rest of North America
NA Liquid Hand Soaps Market Segmentation By Geography
- 1. United States
- 2. Canada
- 3. Mexico
- 4. Rest of North America
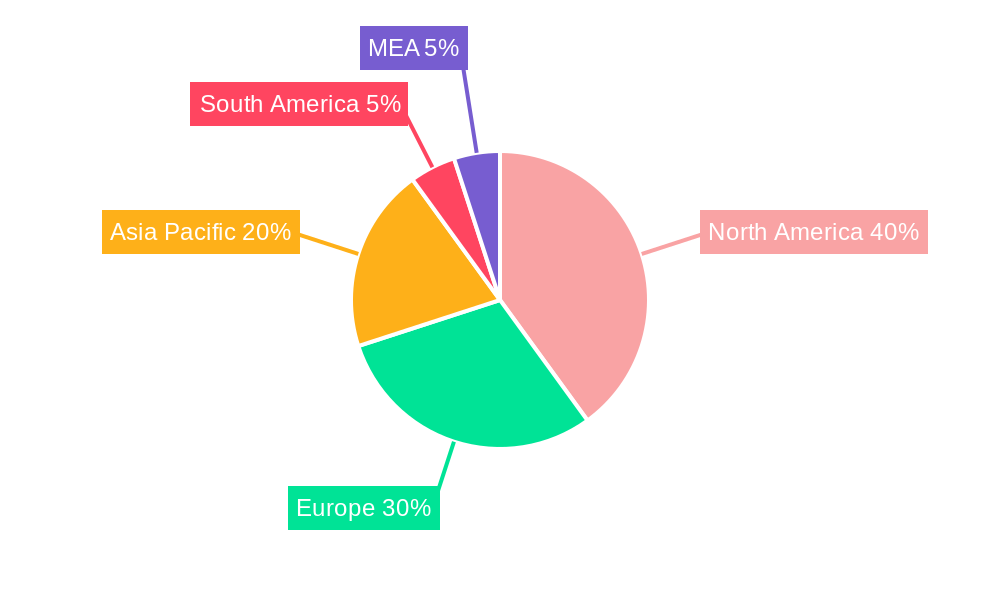
NA Liquid Hand Soaps Market Regional Market Share
Geographic Coverage of NA Liquid Hand Soaps Market
NA Liquid Hand Soaps Market REPORT HIGHLIGHTS
| Aspects | Details |
|---|---|
| Study Period | 2020-2034 |
| Base Year | 2025 |
| Estimated Year | 2026 |
| Forecast Period | 2026-2034 |
| Historical Period | 2020-2025 |
| Growth Rate | CAGR of 6.7% from 2020-2034 |
| Segmentation |
|
Table of Contents
- 1. Introduction
- 1.1. Research Scope
- 1.2. Market Segmentation
- 1.3. Research Objective
- 1.4. Definitions and Assumptions
- 2. Executive Summary
- 2.1. Market Snapshot
- 3. Market Dynamics
- 3.1. Market Drivers
- 3.2. Market Restrains
- 3.3. Market Trends
- 3.4. Market Opportunities
- 4. Market Factor Analysis
- 4.1. Porters Five Forces
- 4.1.1. Bargaining Power of Suppliers
- 4.1.2. Bargaining Power of Buyers
- 4.1.3. Threat of New Entrants
- 4.1.4. Threat of Substitutes
- 4.1.5. Competitive Rivalry
- 4.2. PESTEL analysis
- 4.3. BCG Analysis
- 4.3.1. Stars (High Growth, High Market Share)
- 4.3.2. Cash Cows (Low Growth, High Market Share)
- 4.3.3. Question Mark (High Growth, Low Market Share)
- 4.3.4. Dogs (Low Growth, Low Market Share)
- 4.4. Ansoff Matrix Analysis
- 4.5. Supply Chain Analysis
- 4.6. Regulatory Landscape
- 4.7. Current Market Potential and Opportunity Assessment (TAM–SAM–SOM Framework)
- 4.8. DMV Analyst Note
- 4.1. Porters Five Forces
- 5. Market Analysis, Insights and Forecast 2021-2033
- 5.1. Market Analysis, Insights and Forecast - by Packaging Type
- 5.1.1. Pump Dispensers
- 5.1.2. Bottles/Containers (Refill)
- 5.1.3. Pouches (Refill)
- 5.2. Market Analysis, Insights and Forecast - by Distribution Channel
- 5.2.1. Supermarkets/Hypermarkets
- 5.2.2. Convenience Stores
- 5.2.3. Online Retailers
- 5.2.4. Other Distribution Channels
- 5.3. Market Analysis, Insights and Forecast - by Geography
- 5.3.1. United States
- 5.3.2. Canada
- 5.3.3. Mexico
- 5.3.4. Rest of North America
- 5.4. Market Analysis, Insights and Forecast - by Region
- 5.4.1. United States
- 5.4.2. Canada
- 5.4.3. Mexico
- 5.4.4. Rest of North America
- 5.1. Market Analysis, Insights and Forecast - by Packaging Type
- 6. Global NA Liquid Hand Soaps Market Analysis, Insights and Forecast, 2021-2033
- 6.1. Market Analysis, Insights and Forecast - by Packaging Type
- 6.1.1. Pump Dispensers
- 6.1.2. Bottles/Containers (Refill)
- 6.1.3. Pouches (Refill)
- 6.2. Market Analysis, Insights and Forecast - by Distribution Channel
- 6.2.1. Supermarkets/Hypermarkets
- 6.2.2. Convenience Stores
- 6.2.3. Online Retailers
- 6.2.4. Other Distribution Channels
- 6.3. Market Analysis, Insights and Forecast - by Geography
- 6.3.1. United States
- 6.3.2. Canada
- 6.3.3. Mexico
- 6.3.4. Rest of North America
- 6.1. Market Analysis, Insights and Forecast - by Packaging Type
- 7. United States NA Liquid Hand Soaps Market Analysis, Insights and Forecast, 2020-2032
- 7.1. Market Analysis, Insights and Forecast - by Packaging Type
- 7.1.1. Pump Dispensers
- 7.1.2. Bottles/Containers (Refill)
- 7.1.3. Pouches (Refill)
- 7.2. Market Analysis, Insights and Forecast - by Distribution Channel
- 7.2.1. Supermarkets/Hypermarkets
- 7.2.2. Convenience Stores
- 7.2.3. Online Retailers
- 7.2.4. Other Distribution Channels
- 7.3. Market Analysis, Insights and Forecast - by Geography
- 7.3.1. United States
- 7.3.2. Canada
- 7.3.3. Mexico
- 7.3.4. Rest of North America
- 7.1. Market Analysis, Insights and Forecast - by Packaging Type
- 8. Canada NA Liquid Hand Soaps Market Analysis, Insights and Forecast, 2020-2032
- 8.1. Market Analysis, Insights and Forecast - by Packaging Type
- 8.1.1. Pump Dispensers
- 8.1.2. Bottles/Containers (Refill)
- 8.1.3. Pouches (Refill)
- 8.2. Market Analysis, Insights and Forecast - by Distribution Channel
- 8.2.1. Supermarkets/Hypermarkets
- 8.2.2. Convenience Stores
- 8.2.3. Online Retailers
- 8.2.4. Other Distribution Channels
- 8.3. Market Analysis, Insights and Forecast - by Geography
- 8.3.1. United States
- 8.3.2. Canada
- 8.3.3. Mexico
- 8.3.4. Rest of North America
- 8.1. Market Analysis, Insights and Forecast - by Packaging Type
- 9. Mexico NA Liquid Hand Soaps Market Analysis, Insights and Forecast, 2020-2032
- 9.1. Market Analysis, Insights and Forecast - by Packaging Type
- 9.1.1. Pump Dispensers
- 9.1.2. Bottles/Containers (Refill)
- 9.1.3. Pouches (Refill)
- 9.2. Market Analysis, Insights and Forecast - by Distribution Channel
- 9.2.1. Supermarkets/Hypermarkets
- 9.2.2. Convenience Stores
- 9.2.3. Online Retailers
- 9.2.4. Other Distribution Channels
- 9.3. Market Analysis, Insights and Forecast - by Geography
- 9.3.1. United States
- 9.3.2. Canada
- 9.3.3. Mexico
- 9.3.4. Rest of North America
- 9.1. Market Analysis, Insights and Forecast - by Packaging Type
- 10. Rest of North America NA Liquid Hand Soaps Market Analysis, Insights and Forecast, 2020-2032
- 10.1. Market Analysis, Insights and Forecast - by Packaging Type
- 10.1.1. Pump Dispensers
- 10.1.2. Bottles/Containers (Refill)
- 10.1.3. Pouches (Refill)
- 10.2. Market Analysis, Insights and Forecast - by Distribution Channel
- 10.2.1. Supermarkets/Hypermarkets
- 10.2.2. Convenience Stores
- 10.2.3. Online Retailers
- 10.2.4. Other Distribution Channels
- 10.3. Market Analysis, Insights and Forecast - by Geography
- 10.3.1. United States
- 10.3.2. Canada
- 10.3.3. Mexico
- 10.3.4. Rest of North America
- 10.1. Market Analysis, Insights and Forecast - by Packaging Type
- 11. Competitive Analysis
- 11.1. Company Profiles
- 11.1.1 Dr Bronner's Magic Soaps
- 11.1.1.1. Company Overview
- 11.1.1.2. Products
- 11.1.1.3. Company Financials
- 11.1.1.4. SWOT Analysis
- 11.1.2 Henkel AG & Co KGaA
- 11.1.2.1. Company Overview
- 11.1.2.2. Products
- 11.1.2.3. Company Financials
- 11.1.2.4. SWOT Analysis
- 11.1.3 Reckitt Benckiser Group PLC
- 11.1.3.1. Company Overview
- 11.1.3.2. Products
- 11.1.3.3. Company Financials
- 11.1.3.4. SWOT Analysis
- 11.1.4 Unilever
- 11.1.4.1. Company Overview
- 11.1.4.2. Products
- 11.1.4.3. Company Financials
- 11.1.4.4. SWOT Analysis
- 11.1.5 EO Products
- 11.1.5.1. Company Overview
- 11.1.5.2. Products
- 11.1.5.3. Company Financials
- 11.1.5.4. SWOT Analysis
- 11.1.6 The Hain Celestial Group Inc *List Not Exhaustive
- 11.1.6.1. Company Overview
- 11.1.6.2. Products
- 11.1.6.3. Company Financials
- 11.1.6.4. SWOT Analysis
- 11.1.7 Colgate-Palmolive Company
- 11.1.7.1. Company Overview
- 11.1.7.2. Products
- 11.1.7.3. Company Financials
- 11.1.7.4. SWOT Analysis
- 11.1.8 S C Johnson & Son Inc
- 11.1.8.1. Company Overview
- 11.1.8.2. Products
- 11.1.8.3. Company Financials
- 11.1.8.4. SWOT Analysis
- 11.1.9 Kao Corporation
- 11.1.9.1. Company Overview
- 11.1.9.2. Products
- 11.1.9.3. Company Financials
- 11.1.9.4. SWOT Analysis
- 11.1.10 The J R Watkins Co
- 11.1.10.1. Company Overview
- 11.1.10.2. Products
- 11.1.10.3. Company Financials
- 11.1.10.4. SWOT Analysis
- 11.1.1 Dr Bronner's Magic Soaps
- 11.2. Market Entropy
- 11.2.1 Company's Key Areas Served
- 11.2.2 Recent Developments
- 11.3. Company Market Share Analysis 2025
- 11.3.1 Top 5 Companies Market Share Analysis
- 11.3.2 Top 3 Companies Market Share Analysis
- 11.4. List of Potential Customers
- 12. Research Methodology
List of Figures
- Figure 1: Global NA Liquid Hand Soaps Market Revenue Breakdown (billion, %) by Region 2025 & 2033
- Figure 2: Global NA Liquid Hand Soaps Market Volume Breakdown (K Units, %) by Region 2025 & 2033
- Figure 3: United States NA Liquid Hand Soaps Market Revenue (billion), by Packaging Type 2025 & 2033
- Figure 4: United States NA Liquid Hand Soaps Market Volume (K Units), by Packaging Type 2025 & 2033
- Figure 5: United States NA Liquid Hand Soaps Market Revenue Share (%), by Packaging Type 2025 & 2033
- Figure 6: United States NA Liquid Hand Soaps Market Volume Share (%), by Packaging Type 2025 & 2033
- Figure 7: United States NA Liquid Hand Soaps Market Revenue (billion), by Distribution Channel 2025 & 2033
- Figure 8: United States NA Liquid Hand Soaps Market Volume (K Units), by Distribution Channel 2025 & 2033
- Figure 9: United States NA Liquid Hand Soaps Market Revenue Share (%), by Distribution Channel 2025 & 2033
- Figure 10: United States NA Liquid Hand Soaps Market Volume Share (%), by Distribution Channel 2025 & 2033
- Figure 11: United States NA Liquid Hand Soaps Market Revenue (billion), by Geography 2025 & 2033
- Figure 12: United States NA Liquid Hand Soaps Market Volume (K Units), by Geography 2025 & 2033
- Figure 13: United States NA Liquid Hand Soaps Market Revenue Share (%), by Geography 2025 & 2033
- Figure 14: United States NA Liquid Hand Soaps Market Volume Share (%), by Geography 2025 & 2033
- Figure 15: United States NA Liquid Hand Soaps Market Revenue (billion), by Country 2025 & 2033
- Figure 16: United States NA Liquid Hand Soaps Market Volume (K Units), by Country 2025 & 2033
- Figure 17: United States NA Liquid Hand Soaps Market Revenue Share (%), by Country 2025 & 2033
- Figure 18: United States NA Liquid Hand Soaps Market Volume Share (%), by Country 2025 & 2033
- Figure 19: Canada NA Liquid Hand Soaps Market Revenue (billion), by Packaging Type 2025 & 2033
- Figure 20: Canada NA Liquid Hand Soaps Market Volume (K Units), by Packaging Type 2025 & 2033
- Figure 21: Canada NA Liquid Hand Soaps Market Revenue Share (%), by Packaging Type 2025 & 2033
- Figure 22: Canada NA Liquid Hand Soaps Market Volume Share (%), by Packaging Type 2025 & 2033
- Figure 23: Canada NA Liquid Hand Soaps Market Revenue (billion), by Distribution Channel 2025 & 2033
- Figure 24: Canada NA Liquid Hand Soaps Market Volume (K Units), by Distribution Channel 2025 & 2033
- Figure 25: Canada NA Liquid Hand Soaps Market Revenue Share (%), by Distribution Channel 2025 & 2033
- Figure 26: Canada NA Liquid Hand Soaps Market Volume Share (%), by Distribution Channel 2025 & 2033
- Figure 27: Canada NA Liquid Hand Soaps Market Revenue (billion), by Geography 2025 & 2033
- Figure 28: Canada NA Liquid Hand Soaps Market Volume (K Units), by Geography 2025 & 2033
- Figure 29: Canada NA Liquid Hand Soaps Market Revenue Share (%), by Geography 2025 & 2033
- Figure 30: Canada NA Liquid Hand Soaps Market Volume Share (%), by Geography 2025 & 2033
- Figure 31: Canada NA Liquid Hand Soaps Market Revenue (billion), by Country 2025 & 2033
- Figure 32: Canada NA Liquid Hand Soaps Market Volume (K Units), by Country 2025 & 2033
- Figure 33: Canada NA Liquid Hand Soaps Market Revenue Share (%), by Country 2025 & 2033
- Figure 34: Canada NA Liquid Hand Soaps Market Volume Share (%), by Country 2025 & 2033
- Figure 35: Mexico NA Liquid Hand Soaps Market Revenue (billion), by Packaging Type 2025 & 2033
- Figure 36: Mexico NA Liquid Hand Soaps Market Volume (K Units), by Packaging Type 2025 & 2033
- Figure 37: Mexico NA Liquid Hand Soaps Market Revenue Share (%), by Packaging Type 2025 & 2033
- Figure 38: Mexico NA Liquid Hand Soaps Market Volume Share (%), by Packaging Type 2025 & 2033
- Figure 39: Mexico NA Liquid Hand Soaps Market Revenue (billion), by Distribution Channel 2025 & 2033
- Figure 40: Mexico NA Liquid Hand Soaps Market Volume (K Units), by Distribution Channel 2025 & 2033
- Figure 41: Mexico NA Liquid Hand Soaps Market Revenue Share (%), by Distribution Channel 2025 & 2033
- Figure 42: Mexico NA Liquid Hand Soaps Market Volume Share (%), by Distribution Channel 2025 & 2033
- Figure 43: Mexico NA Liquid Hand Soaps Market Revenue (billion), by Geography 2025 & 2033
- Figure 44: Mexico NA Liquid Hand Soaps Market Volume (K Units), by Geography 2025 & 2033
- Figure 45: Mexico NA Liquid Hand Soaps Market Revenue Share (%), by Geography 2025 & 2033
- Figure 46: Mexico NA Liquid Hand Soaps Market Volume Share (%), by Geography 2025 & 2033
- Figure 47: Mexico NA Liquid Hand Soaps Market Revenue (billion), by Country 2025 & 2033
- Figure 48: Mexico NA Liquid Hand Soaps Market Volume (K Units), by Country 2025 & 2033
- Figure 49: Mexico NA Liquid Hand Soaps Market Revenue Share (%), by Country 2025 & 2033
- Figure 50: Mexico NA Liquid Hand Soaps Market Volume Share (%), by Country 2025 & 2033
- Figure 51: Rest of North America NA Liquid Hand Soaps Market Revenue (billion), by Packaging Type 2025 & 2033
- Figure 52: Rest of North America NA Liquid Hand Soaps Market Volume (K Units), by Packaging Type 2025 & 2033
- Figure 53: Rest of North America NA Liquid Hand Soaps Market Revenue Share (%), by Packaging Type 2025 & 2033
- Figure 54: Rest of North America NA Liquid Hand Soaps Market Volume Share (%), by Packaging Type 2025 & 2033
- Figure 55: Rest of North America NA Liquid Hand Soaps Market Revenue (billion), by Distribution Channel 2025 & 2033
- Figure 56: Rest of North America NA Liquid Hand Soaps Market Volume (K Units), by Distribution Channel 2025 & 2033
- Figure 57: Rest of North America NA Liquid Hand Soaps Market Revenue Share (%), by Distribution Channel 2025 & 2033
- Figure 58: Rest of North America NA Liquid Hand Soaps Market Volume Share (%), by Distribution Channel 2025 & 2033
- Figure 59: Rest of North America NA Liquid Hand Soaps Market Revenue (billion), by Geography 2025 & 2033
- Figure 60: Rest of North America NA Liquid Hand Soaps Market Volume (K Units), by Geography 2025 & 2033
- Figure 61: Rest of North America NA Liquid Hand Soaps Market Revenue Share (%), by Geography 2025 & 2033
- Figure 62: Rest of North America NA Liquid Hand Soaps Market Volume Share (%), by Geography 2025 & 2033
- Figure 63: Rest of North America NA Liquid Hand Soaps Market Revenue (billion), by Country 2025 & 2033
- Figure 64: Rest of North America NA Liquid Hand Soaps Market Volume (K Units), by Country 2025 & 2033
- Figure 65: Rest of North America NA Liquid Hand Soaps Market Revenue Share (%), by Country 2025 & 2033
- Figure 66: Rest of North America NA Liquid Hand Soaps Market Volume Share (%), by Country 2025 & 2033
List of Tables
- Table 1: Global NA Liquid Hand Soaps Market Revenue billion Forecast, by Packaging Type 2020 & 2033
- Table 2: Global NA Liquid Hand Soaps Market Volume K Units Forecast, by Packaging Type 2020 & 2033
- Table 3: Global NA Liquid Hand Soaps Market Revenue billion Forecast, by Distribution Channel 2020 & 2033
- Table 4: Global NA Liquid Hand Soaps Market Volume K Units Forecast, by Distribution Channel 2020 & 2033
- Table 5: Global NA Liquid Hand Soaps Market Revenue billion Forecast, by Geography 2020 & 2033
- Table 6: Global NA Liquid Hand Soaps Market Volume K Units Forecast, by Geography 2020 & 2033
- Table 7: Global NA Liquid Hand Soaps Market Revenue billion Forecast, by Region 2020 & 2033
- Table 8: Global NA Liquid Hand Soaps Market Volume K Units Forecast, by Region 2020 & 2033
- Table 9: Global NA Liquid Hand Soaps Market Revenue billion Forecast, by Packaging Type 2020 & 2033
- Table 10: Global NA Liquid Hand Soaps Market Volume K Units Forecast, by Packaging Type 2020 & 2033
- Table 11: Global NA Liquid Hand Soaps Market Revenue billion Forecast, by Distribution Channel 2020 & 2033
- Table 12: Global NA Liquid Hand Soaps Market Volume K Units Forecast, by Distribution Channel 2020 & 2033
- Table 13: Global NA Liquid Hand Soaps Market Revenue billion Forecast, by Geography 2020 & 2033
- Table 14: Global NA Liquid Hand Soaps Market Volume K Units Forecast, by Geography 2020 & 2033
- Table 15: Global NA Liquid Hand Soaps Market Revenue billion Forecast, by Country 2020 & 2033
- Table 16: Global NA Liquid Hand Soaps Market Volume K Units Forecast, by Country 2020 & 2033
- Table 17: Global NA Liquid Hand Soaps Market Revenue billion Forecast, by Packaging Type 2020 & 2033
- Table 18: Global NA Liquid Hand Soaps Market Volume K Units Forecast, by Packaging Type 2020 & 2033
- Table 19: Global NA Liquid Hand Soaps Market Revenue billion Forecast, by Distribution Channel 2020 & 2033
- Table 20: Global NA Liquid Hand Soaps Market Volume K Units Forecast, by Distribution Channel 2020 & 2033
- Table 21: Global NA Liquid Hand Soaps Market Revenue billion Forecast, by Geography 2020 & 2033
- Table 22: Global NA Liquid Hand Soaps Market Volume K Units Forecast, by Geography 2020 & 2033
- Table 23: Global NA Liquid Hand Soaps Market Revenue billion Forecast, by Country 2020 & 2033
- Table 24: Global NA Liquid Hand Soaps Market Volume K Units Forecast, by Country 2020 & 2033
- Table 25: Global NA Liquid Hand Soaps Market Revenue billion Forecast, by Packaging Type 2020 & 2033
- Table 26: Global NA Liquid Hand Soaps Market Volume K Units Forecast, by Packaging Type 2020 & 2033
- Table 27: Global NA Liquid Hand Soaps Market Revenue billion Forecast, by Distribution Channel 2020 & 2033
- Table 28: Global NA Liquid Hand Soaps Market Volume K Units Forecast, by Distribution Channel 2020 & 2033
- Table 29: Global NA Liquid Hand Soaps Market Revenue billion Forecast, by Geography 2020 & 2033
- Table 30: Global NA Liquid Hand Soaps Market Volume K Units Forecast, by Geography 2020 & 2033
- Table 31: Global NA Liquid Hand Soaps Market Revenue billion Forecast, by Country 2020 & 2033
- Table 32: Global NA Liquid Hand Soaps Market Volume K Units Forecast, by Country 2020 & 2033
- Table 33: Global NA Liquid Hand Soaps Market Revenue billion Forecast, by Packaging Type 2020 & 2033
- Table 34: Global NA Liquid Hand Soaps Market Volume K Units Forecast, by Packaging Type 2020 & 2033
- Table 35: Global NA Liquid Hand Soaps Market Revenue billion Forecast, by Distribution Channel 2020 & 2033
- Table 36: Global NA Liquid Hand Soaps Market Volume K Units Forecast, by Distribution Channel 2020 & 2033
- Table 37: Global NA Liquid Hand Soaps Market Revenue billion Forecast, by Geography 2020 & 2033
- Table 38: Global NA Liquid Hand Soaps Market Volume K Units Forecast, by Geography 2020 & 2033
- Table 39: Global NA Liquid Hand Soaps Market Revenue billion Forecast, by Country 2020 & 2033
- Table 40: Global NA Liquid Hand Soaps Market Volume K Units Forecast, by Country 2020 & 2033
Frequently Asked Questions
1. What is the projected Compound Annual Growth Rate (CAGR) of the NA Liquid Hand Soaps Market?
The projected CAGR is approximately 6.7%.
2. Which companies are prominent players in the NA Liquid Hand Soaps Market?
Key companies in the market include Dr Bronner's Magic Soaps, Henkel AG & Co KGaA, Reckitt Benckiser Group PLC, Unilever, EO Products, The Hain Celestial Group Inc *List Not Exhaustive, Colgate-Palmolive Company, S C Johnson & Son Inc, Kao Corporation, The J R Watkins Co.
3. What are the main segments of the NA Liquid Hand Soaps Market?
The market segments include Packaging Type, Distribution Channel, Geography.
4. Can you provide details about the market size?
The market size is estimated to be USD 25.3 billion as of 2022.
5. What are some drivers contributing to market growth?
Evolving Consumer Perception Toward Oral Hygiene Routines; Increased Focus on Marketing Activities & Distribution Network.
6. What are the notable trends driving market growth?
Consumer Inclination Toward Personal Hygiene Coupled with Government Initiatives.
7. Are there any restraints impacting market growth?
Adverse Effects of Synthetic Chemicals Used in Mouth Washes.
8. Can you provide examples of recent developments in the market?
N/A
9. What pricing options are available for accessing the report?
Pricing options include single-user, multi-user, and enterprise licenses priced at USD 4750, USD 5250, and USD 8750 respectively.
10. Is the market size provided in terms of value or volume?
The market size is provided in terms of value, measured in billion and volume, measured in K Units.
11. Are there any specific market keywords associated with the report?
Yes, the market keyword associated with the report is "NA Liquid Hand Soaps Market," which aids in identifying and referencing the specific market segment covered.
12. How do I determine which pricing option suits my needs best?
The pricing options vary based on user requirements and access needs. Individual users may opt for single-user licenses, while businesses requiring broader access may choose multi-user or enterprise licenses for cost-effective access to the report.
13. Are there any additional resources or data provided in the NA Liquid Hand Soaps Market report?
While the report offers comprehensive insights, it's advisable to review the specific contents or supplementary materials provided to ascertain if additional resources or data are available.
14. How can I stay updated on further developments or reports in the NA Liquid Hand Soaps Market?
To stay informed about further developments, trends, and reports in the NA Liquid Hand Soaps Market, consider subscribing to industry newsletters, following relevant companies and organizations, or regularly checking reputable industry news sources and publications.
Methodology
Step 1 - Identification of Relevant Samples Size from Population Database


Step 2 - Approaches for Defining Global Market Size (Value, Volume* & Price*)

Note*: In applicable scenarios
Step 3 - Data Sources
Primary Research
- Web Analytics
- Survey Reports
- Research Institute
- Latest Research Reports
- Opinion Leaders
Secondary Research
- Annual Reports
- White Paper
- Latest Press Release
- Industry Association
- Paid Database
- Investor Presentations

Step 4 - Data Triangulation
Involves using different sources of information in order to increase the validity of a study
These sources are likely to be stakeholders in a program - participants, other researchers, program staff, other community members, and so on.
Then we put all data in single framework & apply various statistical tools to find out the dynamic on the market.
During the analysis stage, feedback from the stakeholder groups would be compared to determine areas of agreement as well as areas of divergence