

Key Insights
The global mobile phone glass cover market is poised for significant expansion, projected to reach $46.58 billion by 2025. The market is expected to grow at a Compound Annual Growth Rate (CAGR) of 3.5% from the base year of 2025 through 2033. This growth is driven by escalating smartphone demand, particularly for devices with enhanced durability and sophisticated aesthetics. The evolution of smartphone designs, featuring larger and edge-to-edge displays, necessitates advanced protective glass solutions. Rising disposable incomes in emerging markets and increasing smartphone penetration across diverse demographics further fuel market expansion. Consumers increasingly value premium features and device longevity, making robust screen protection a critical purchasing consideration. Technological advancements in glass manufacturing, yielding stronger, thinner, and more scratch-resistant materials like advanced Gorilla Glass and DragonTrail Glass, are accelerating this trend.
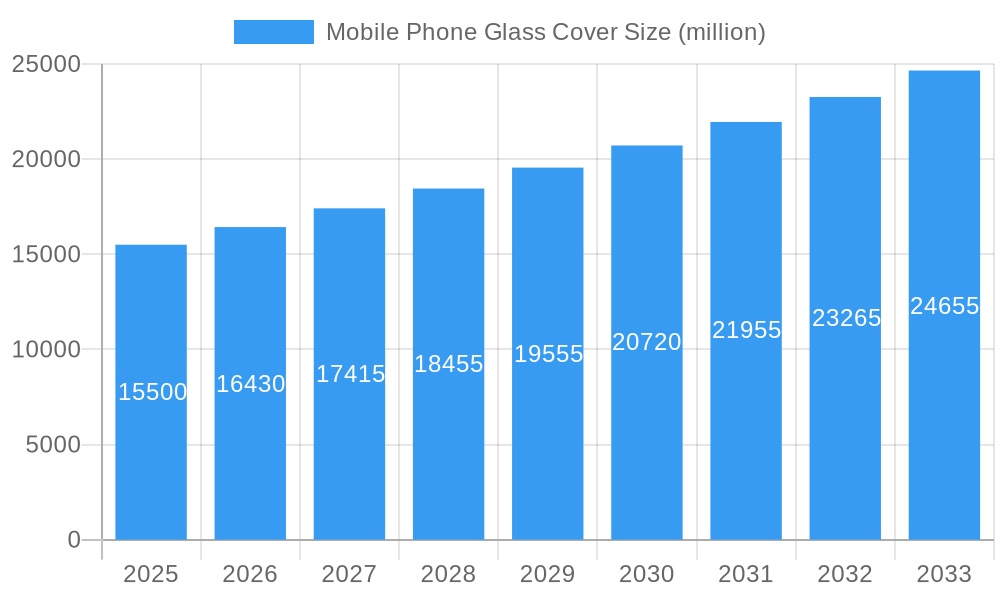
Mobile Phone Glass Cover Market Size (In Billion)
Key market dynamics include the growing adoption of curved and foldable displays, requiring specialized flexible glass. The integration of antimicrobial coatings on glass surfaces is also a rising trend, addressing consumer hygiene concerns. Furthermore, a focus on sustainability is driving research into eco-friendly manufacturing and recyclable materials. However, the market faces challenges such as the high cost of advanced material development and manufacturing, impacting affordability for budget-conscious consumers. Fluctuations in raw material prices and potential supply chain disruptions can also pose obstacles. Despite these restraints, continuous smartphone innovation and consumer demand for superior protection are expected to propel sustained market growth.
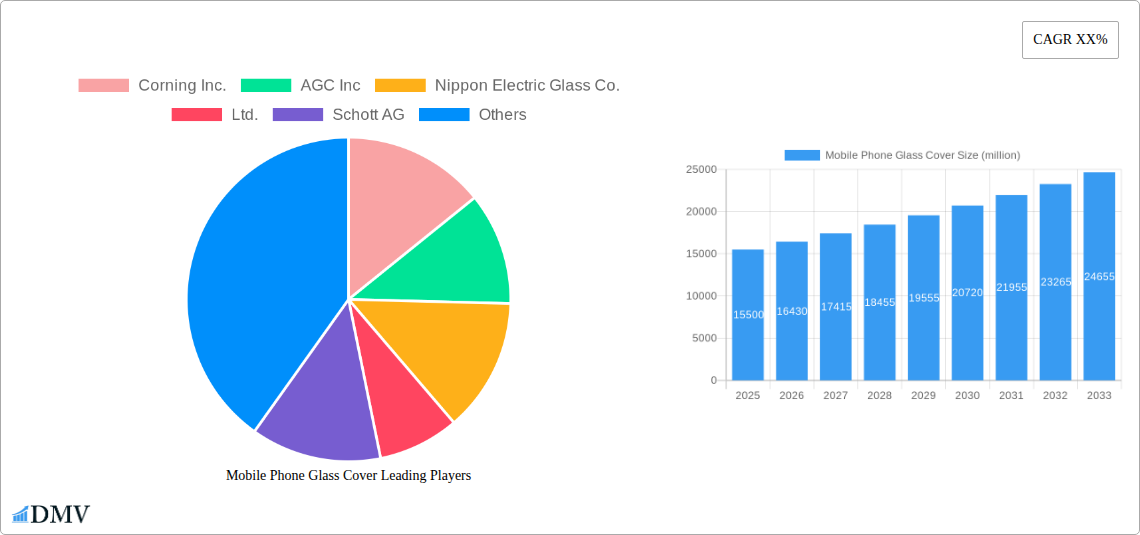
Mobile Phone Glass Cover Company Market Share
Mobile Phone Glass Cover Market Composition & Trends
The mobile phone glass cover market is characterized by intense competition and significant technological innovation, driving a dynamic landscape for stakeholders. Key players like Corning Inc. and AGC Inc. hold substantial market share, their dominance stemming from decades of research and development in advanced glass technologies, including Gorilla Glass and Draggontrail Glass. Market concentration is moderate to high, with a few dominant manufacturers supplying a vast ecosystem of mobile device producers. Innovation is a primary catalyst, with continuous advancements in scratch resistance, shatterproof capabilities, and aesthetic appeal, directly impacting consumer purchasing decisions. The regulatory environment, while generally supportive of technological advancement, can introduce nuances related to material safety and recyclability. Substitute products, such as plastic or hybrid screen protectors, exist but often fall short in delivering the premium feel and durability expected by consumers of high-end IOS Mobile Phone and Android Mobile Phone devices. End-user profiles are diverse, ranging from tech-savvy early adopters prioritizing cutting-edge protection to mainstream consumers seeking reliable durability for their everyday devices. Mergers and acquisitions (M&A) play a role in market consolidation, with deal values in the past few years estimated to be in the hundreds of millions. For instance, strategic acquisitions by larger entities aim to secure intellectual property, expand manufacturing capacity, and gain access to new geographic markets, further influencing market share distribution which saw leading players command approximately 60% of the market in recent years. The market is projected to witness continued M&A activity, with estimated deal values for strategic acquisitions reaching up to $500 million in the coming years, driven by the pursuit of enhanced technological capabilities and market penetration.
Mobile Phone Glass Cover Industry Evolution
The mobile phone glass cover industry has witnessed a remarkable evolution, marked by a consistent upward trajectory in market growth, driven by an insatiable demand for advanced smartphone protection and enhanced user experience. Over the historical period of 2019-2024, the global mobile phone glass cover market experienced a Compound Annual Growth Rate (CAGR) of approximately 7.5%, with market value surging from an estimated $7 billion in 2019 to over $10 billion by the end of 2024. This robust growth is directly attributable to the increasing penetration of smartphones globally, projected to reach over 7 billion active users by 2025. Technological advancements have been the cornerstone of this evolution. The introduction and subsequent iterations of advanced chemically strengthened glass, such as Gorilla Glass from Corning Inc. and Draggontrail Glass from AGC Inc., have revolutionized screen protection. These materials offer superior scratch resistance, impact durability, and a premium feel that has become a standard expectation for consumers, especially for premium IOS Mobile Phone and Android Mobile Phone models. The market has also seen a significant shift towards thinner yet stronger glass formulations, allowing for sleeker device designs without compromising on protection. Adoption metrics for these advanced glass types consistently surpassed 80% for flagship and mid-range devices by 2024. Consumer demands have also played a pivotal role. Beyond basic scratch resistance, users now expect enhanced features like oleophobic coatings to resist fingerprints, anti-glare properties, and even integrated privacy filters. The lifecycle of smartphone upgrades, averaging around 2.5 years, ensures a continuous demand for replacement screens and devices incorporating the latest glass technology. Furthermore, the growing popularity of foldable smartphones, while presenting unique manufacturing challenges, has spurred innovation in flexible glass technologies, opening new avenues for market expansion. The estimated market value in the base year of 2025 is projected to be around $11.5 billion, with a projected CAGR of 6.8% from 2025 to 2033, indicating sustained, albeit slightly moderated, growth driven by ongoing technological innovation and expanding smartphone adoption in emerging economies.
Leading Regions, Countries, or Segments in Mobile Phone Glass Cover
The global mobile phone glass cover market is a highly segmented landscape, with dominance shifting based on technological adoption, manufacturing prowess, and consumer demand. When examining the Application segment, both IOS Mobile Phone and Android Mobile Phone applications represent colossal markets, with Android holding a larger volume due to its widespread adoption across various price points and global regions. However, the premium segment, heavily influenced by Apple's IOS Mobile Phone ecosystem, often drives innovation and higher average selling prices for advanced glass types. The Types segment clearly illustrates the impact of specialized brands. Gorilla Glass, manufactured by Corning Inc., remains a dominant force, particularly in high-end smartphones, commanding an estimated 45% market share in 2025 due to its widespread adoption by major OEMs and its reputation for superior durability. Draggontrail Glass from AGC Inc. also holds a significant position, especially in mid-range to premium Android devices, with an estimated 25% market share. The "Others" category, encompassing a variety of specialized and regional glass producers, collectively accounts for the remaining 30%, highlighting the presence of competitive alternatives.
Key Drivers of Dominance in the Mobile Phone Glass Cover Market:
- Technological Superiority and Brand Recognition: The "Gorilla Glass" brand, in particular, has achieved near-ubiquitous brand recognition among consumers, creating a strong pull for its inclusion in devices. This brand equity translates into a significant competitive advantage, influencing both manufacturer specifications and consumer preferences.
- Investment in Research and Development (R&D): Leading companies like Corning Inc. and AGC Inc. consistently invest billions of dollars annually in R&D. This sustained investment fuels continuous innovation in material science, leading to breakthroughs in strength, flexibility, and functionality, thereby maintaining their technological edge and justifying premium pricing. Estimated R&D spending by top players in 2025 is projected to exceed $800 million.
- Strong OEM Partnerships and Supply Chain Integration: Deep-rooted partnerships with major smartphone manufacturers like Apple, Samsung, and Xiaomi are critical. These collaborations ensure that new glass technologies are integrated into flagship devices from their inception, solidifying their market presence and establishing long-term supply contracts. The value of these integrated supply chain contracts is estimated to be in the billions of dollars annually.
- Manufacturing Capacity and Scalability: The ability to produce high-quality glass covers at scale is paramount. Companies with extensive manufacturing facilities and efficient production processes can meet the massive demand from global smartphone production. Regions with robust manufacturing infrastructure, particularly in Asia, are central to the global supply chain.
- Emerging Market Penetration: While established markets drive premium demand, the growing adoption of smartphones in emerging economies presents significant volume opportunities. The accessibility and cost-effectiveness of certain glass types within the "Others" category can influence market share in these regions.
The dominance of Gorilla Glass and Draggontrail Glass is particularly pronounced in the premium IOS Mobile Phone and high-end Android Mobile Phone segments, where consumers are willing to pay a premium for perceived superior protection and brand assurance. As the market evolves, innovation in flexible glass for foldable devices and the integration of advanced functionalities like biometric sensors within the glass itself will continue to shape regional and segmental dominance.
Mobile Phone Glass Cover Product Innovations
Recent product innovations in mobile phone glass covers are revolutionizing device durability and user experience. Manufacturers are increasingly focusing on developing ultra-thin yet incredibly strong glass formulations, significantly reducing device weight and enabling sleeker designs. Advancements in chemically strengthened glass, such as the latest iterations of Gorilla Glass and Draggontrail Glass, boast unprecedented scratch and drop resistance, often exceeding previous benchmarks by over 30% in impact tests. Beyond mere protection, innovations include integrated oleophobic coatings that repel fingerprints more effectively, anti-reflective coatings that improve screen visibility in bright sunlight, and even embedded privacy filters that limit viewing angles. The development of flexible glass for foldable smartphones is a groundbreaking area, addressing the unique challenges of bendable displays. These innovations directly translate into enhanced product longevity, reduced repair costs, and an improved aesthetic appeal for mobile devices, catering to the discerning demands of today's consumers.
Propelling Factors for Mobile Phone Glass Cover Growth
The mobile phone glass cover market is propelled by several key factors. Firstly, the relentless demand for premium smartphones, particularly IOS Mobile Phone and high-end Android Mobile Phone models, necessitates advanced screen protection. Secondly, continuous technological innovation by companies like Corning Inc. and AGC Inc., introducing stronger, more durable, and aesthetically pleasing glass types such as Gorilla Glass and Draggontrail Glass, drives adoption. Thirdly, the increasing average selling price of smartphones, driven by sophisticated features, further justifies investment in high-quality glass covers. Finally, evolving consumer expectations for device longevity and resistance to everyday wear and tear play a crucial role in market expansion.
Obstacles in the Mobile Phone Glass Cover Market
Despite robust growth, the mobile phone glass cover market faces certain obstacles. Intense price competition among manufacturers, especially in the mid-range and budget segments, can compress profit margins. The constant need for significant R&D investment to maintain a technological edge requires substantial capital outlay. Supply chain disruptions, exacerbated by geopolitical events or raw material shortages, can impact production and lead times, with potential delays affecting a significant portion of the global supply chain. Furthermore, the emergence of alternative display technologies or protective solutions, though currently less dominant, could pose a long-term threat.
Future Opportunities in Mobile Phone Glass Cover
Emerging opportunities in the mobile phone glass cover market are abundant. The burgeoning foldable smartphone segment presents a significant avenue for innovation in flexible glass technologies, promising substantial growth. The increasing integration of advanced functionalities directly into the glass, such as embedded sensors or self-healing properties, offers new avenues for product differentiation. Expansion into emerging economies with rapidly growing smartphone adoption will continue to drive volume demand. Furthermore, the development of more sustainable and recyclable glass materials aligns with growing environmental consciousness among consumers and regulatory bodies, opening new market niches.
Major Players in the Mobile Phone Glass Cover Ecosystem
- Corning Inc.
- AGC Inc.
- Nippon Electric Glass Co.,Ltd.
- Schott AG
- Biel Crystal Manufactory Limited
- TPK Holding Co.,Ltd.
- O-film Tech Co.,Ltd.
- NEG
- Tunghsu Group
- KMTC
Key Developments in Mobile Phone Glass Cover Industry
- 2023: Introduction of Corning® Gorilla® Glass Victus® 2, offering enhanced drop performance on rough surfaces.
- 2023: AGC Inc. announces advancements in its Dragontrail™ X glass, focusing on improved scratch resistance and thinner profiles.
- 2024: O-film Tech Co.,Ltd. announces significant investment in R&D for next-generation smartphone screen protection technologies.
- 2024: Tunghsu Group highlights its capabilities in large-format glass production for emerging display technologies.
- 2025: Launch of new iterations of chemically strengthened glass with embedded biometric sensor compatibility.
- 2025: Increased focus on flexible glass solutions for the rapidly expanding foldable smartphone market.
- 2026: Potential M&A activities among mid-tier manufacturers to consolidate market share and gain technological expertise.
- 2027: Greater adoption of recycled materials in mobile phone glass cover manufacturing driven by sustainability initiatives.
- 2028: Innovations in anti-microbial coatings for mobile phone glass surfaces gain traction.
- 2029: Development of smart glass functionalities, such as dynamic privacy filters, integrated into device screens.
- 2030: Continued advancements in thin-film deposition techniques for enhanced optical clarity and durability.
- 2031: Exploration of novel material compositions to further enhance shatter resistance beyond current benchmarks.
- 2032: Increasing emphasis on integrated antenna and sensor technologies within the glass cover.
- 2033: Emerging players demonstrating breakthroughs in cost-effective, high-performance glass alternatives.
Strategic Mobile Phone Glass Cover Market Forecast
The strategic outlook for the mobile phone glass cover market is exceptionally positive, driven by sustained demand for premium smartphones and continuous technological innovation. The forecast period from 2025 to 2033 is expected to witness consistent growth, fueled by the increasing adoption of advanced glass types like Gorilla Glass and Draggontrail Glass across both IOS Mobile Phone and Android Mobile Phone applications. The burgeoning foldable phone market presents a significant opportunity for flexible glass solutions, while ongoing R&D promises further advancements in durability, functionality, and aesthetics. Strategic investments in emerging markets and a focus on sustainable manufacturing practices will further solidify the market's upward trajectory, ensuring robust market potential for stakeholders.
Mobile Phone Glass Cover Segmentation
-
1. Application
- 1.1. IOS Mobile Phone
- 1.2. Android Mobile Phone
-
2. Types
- 2.1. Gorilla Glass
- 2.2. Draggontrail Glass
- 2.3. Others
Mobile Phone Glass Cover Segmentation By Geography
-
1. North America
- 1.1. United States
- 1.2. Canada
- 1.3. Mexico
-
2. South America
- 2.1. Brazil
- 2.2. Argentina
- 2.3. Rest of South America
-
3. Europe
- 3.1. United Kingdom
- 3.2. Germany
- 3.3. France
- 3.4. Italy
- 3.5. Spain
- 3.6. Russia
- 3.7. Benelux
- 3.8. Nordics
- 3.9. Rest of Europe
-
4. Middle East & Africa
- 4.1. Turkey
- 4.2. Israel
- 4.3. GCC
- 4.4. North Africa
- 4.5. South Africa
- 4.6. Rest of Middle East & Africa
-
5. Asia Pacific
- 5.1. China
- 5.2. India
- 5.3. Japan
- 5.4. South Korea
- 5.5. ASEAN
- 5.6. Oceania
- 5.7. Rest of Asia Pacific
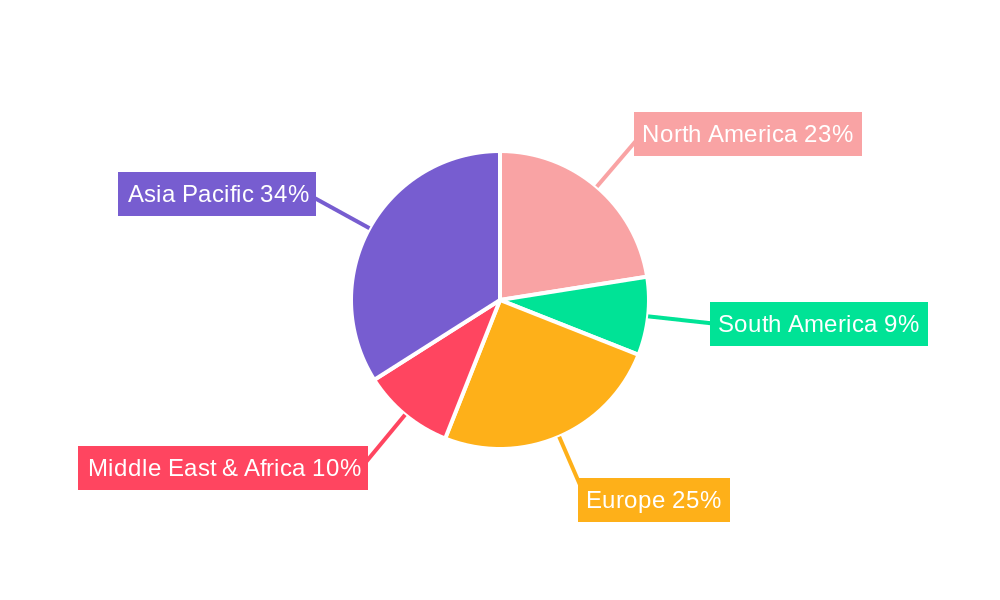
Mobile Phone Glass Cover Regional Market Share
Geographic Coverage of Mobile Phone Glass Cover
Mobile Phone Glass Cover REPORT HIGHLIGHTS
| Aspects | Details |
|---|---|
| Study Period | 2020-2034 |
| Base Year | 2025 |
| Estimated Year | 2026 |
| Forecast Period | 2026-2034 |
| Historical Period | 2020-2025 |
| Growth Rate | CAGR of 3.5% from 2020-2034 |
| Segmentation |
|
Table of Contents
- 1. Introduction
- 1.1. Research Scope
- 1.2. Market Segmentation
- 1.3. Research Methodology
- 1.4. Definitions and Assumptions
- 2. Executive Summary
- 2.1. Introduction
- 3. Market Dynamics
- 3.1. Introduction
- 3.2. Market Drivers
- 3.3. Market Restrains
- 3.4. Market Trends
- 4. Market Factor Analysis
- 4.1. Porters Five Forces
- 4.2. Supply/Value Chain
- 4.3. PESTEL analysis
- 4.4. Market Entropy
- 4.5. Patent/Trademark Analysis
- 5. Global Mobile Phone Glass Cover Analysis, Insights and Forecast, 2020-2032
- 5.1. Market Analysis, Insights and Forecast - by Application
- 5.1.1. IOS Mobile Phone
- 5.1.2. Android Mobile Phone
- 5.2. Market Analysis, Insights and Forecast - by Types
- 5.2.1. Gorilla Glass
- 5.2.2. Draggontrail Glass
- 5.2.3. Others
- 5.3. Market Analysis, Insights and Forecast - by Region
- 5.3.1. North America
- 5.3.2. South America
- 5.3.3. Europe
- 5.3.4. Middle East & Africa
- 5.3.5. Asia Pacific
- 5.1. Market Analysis, Insights and Forecast - by Application
- 6. North America Mobile Phone Glass Cover Analysis, Insights and Forecast, 2020-2032
- 6.1. Market Analysis, Insights and Forecast - by Application
- 6.1.1. IOS Mobile Phone
- 6.1.2. Android Mobile Phone
- 6.2. Market Analysis, Insights and Forecast - by Types
- 6.2.1. Gorilla Glass
- 6.2.2. Draggontrail Glass
- 6.2.3. Others
- 6.1. Market Analysis, Insights and Forecast - by Application
- 7. South America Mobile Phone Glass Cover Analysis, Insights and Forecast, 2020-2032
- 7.1. Market Analysis, Insights and Forecast - by Application
- 7.1.1. IOS Mobile Phone
- 7.1.2. Android Mobile Phone
- 7.2. Market Analysis, Insights and Forecast - by Types
- 7.2.1. Gorilla Glass
- 7.2.2. Draggontrail Glass
- 7.2.3. Others
- 7.1. Market Analysis, Insights and Forecast - by Application
- 8. Europe Mobile Phone Glass Cover Analysis, Insights and Forecast, 2020-2032
- 8.1. Market Analysis, Insights and Forecast - by Application
- 8.1.1. IOS Mobile Phone
- 8.1.2. Android Mobile Phone
- 8.2. Market Analysis, Insights and Forecast - by Types
- 8.2.1. Gorilla Glass
- 8.2.2. Draggontrail Glass
- 8.2.3. Others
- 8.1. Market Analysis, Insights and Forecast - by Application
- 9. Middle East & Africa Mobile Phone Glass Cover Analysis, Insights and Forecast, 2020-2032
- 9.1. Market Analysis, Insights and Forecast - by Application
- 9.1.1. IOS Mobile Phone
- 9.1.2. Android Mobile Phone
- 9.2. Market Analysis, Insights and Forecast - by Types
- 9.2.1. Gorilla Glass
- 9.2.2. Draggontrail Glass
- 9.2.3. Others
- 9.1. Market Analysis, Insights and Forecast - by Application
- 10. Asia Pacific Mobile Phone Glass Cover Analysis, Insights and Forecast, 2020-2032
- 10.1. Market Analysis, Insights and Forecast - by Application
- 10.1.1. IOS Mobile Phone
- 10.1.2. Android Mobile Phone
- 10.2. Market Analysis, Insights and Forecast - by Types
- 10.2.1. Gorilla Glass
- 10.2.2. Draggontrail Glass
- 10.2.3. Others
- 10.1. Market Analysis, Insights and Forecast - by Application
- 11. Competitive Analysis
- 11.1. Global Market Share Analysis 2025
- 11.2. Company Profiles
- 11.2.1 Corning Inc.
- 11.2.1.1. Overview
- 11.2.1.2. Products
- 11.2.1.3. SWOT Analysis
- 11.2.1.4. Recent Developments
- 11.2.1.5. Financials (Based on Availability)
- 11.2.2 AGC Inc
- 11.2.2.1. Overview
- 11.2.2.2. Products
- 11.2.2.3. SWOT Analysis
- 11.2.2.4. Recent Developments
- 11.2.2.5. Financials (Based on Availability)
- 11.2.3 Nippon Electric Glass Co.
- 11.2.3.1. Overview
- 11.2.3.2. Products
- 11.2.3.3. SWOT Analysis
- 11.2.3.4. Recent Developments
- 11.2.3.5. Financials (Based on Availability)
- 11.2.4 Ltd.
- 11.2.4.1. Overview
- 11.2.4.2. Products
- 11.2.4.3. SWOT Analysis
- 11.2.4.4. Recent Developments
- 11.2.4.5. Financials (Based on Availability)
- 11.2.5 Schott AG
- 11.2.5.1. Overview
- 11.2.5.2. Products
- 11.2.5.3. SWOT Analysis
- 11.2.5.4. Recent Developments
- 11.2.5.5. Financials (Based on Availability)
- 11.2.6 Biel Crystal Manufactory Limited
- 11.2.6.1. Overview
- 11.2.6.2. Products
- 11.2.6.3. SWOT Analysis
- 11.2.6.4. Recent Developments
- 11.2.6.5. Financials (Based on Availability)
- 11.2.7 TPK Holding Co.
- 11.2.7.1. Overview
- 11.2.7.2. Products
- 11.2.7.3. SWOT Analysis
- 11.2.7.4. Recent Developments
- 11.2.7.5. Financials (Based on Availability)
- 11.2.8 Ltd.
- 11.2.8.1. Overview
- 11.2.8.2. Products
- 11.2.8.3. SWOT Analysis
- 11.2.8.4. Recent Developments
- 11.2.8.5. Financials (Based on Availability)
- 11.2.9 O-film Tech Co.
- 11.2.9.1. Overview
- 11.2.9.2. Products
- 11.2.9.3. SWOT Analysis
- 11.2.9.4. Recent Developments
- 11.2.9.5. Financials (Based on Availability)
- 11.2.10 Ltd.
- 11.2.10.1. Overview
- 11.2.10.2. Products
- 11.2.10.3. SWOT Analysis
- 11.2.10.4. Recent Developments
- 11.2.10.5. Financials (Based on Availability)
- 11.2.11 NEG
- 11.2.11.1. Overview
- 11.2.11.2. Products
- 11.2.11.3. SWOT Analysis
- 11.2.11.4. Recent Developments
- 11.2.11.5. Financials (Based on Availability)
- 11.2.12 Tunghsu Group
- 11.2.12.1. Overview
- 11.2.12.2. Products
- 11.2.12.3. SWOT Analysis
- 11.2.12.4. Recent Developments
- 11.2.12.5. Financials (Based on Availability)
- 11.2.13 KMTC
- 11.2.13.1. Overview
- 11.2.13.2. Products
- 11.2.13.3. SWOT Analysis
- 11.2.13.4. Recent Developments
- 11.2.13.5. Financials (Based on Availability)
- 11.2.1 Corning Inc.
List of Figures
- Figure 1: Global Mobile Phone Glass Cover Revenue Breakdown (billion, %) by Region 2025 & 2033
- Figure 2: Global Mobile Phone Glass Cover Volume Breakdown (K, %) by Region 2025 & 2033
- Figure 3: North America Mobile Phone Glass Cover Revenue (billion), by Application 2025 & 2033
- Figure 4: North America Mobile Phone Glass Cover Volume (K), by Application 2025 & 2033
- Figure 5: North America Mobile Phone Glass Cover Revenue Share (%), by Application 2025 & 2033
- Figure 6: North America Mobile Phone Glass Cover Volume Share (%), by Application 2025 & 2033
- Figure 7: North America Mobile Phone Glass Cover Revenue (billion), by Types 2025 & 2033
- Figure 8: North America Mobile Phone Glass Cover Volume (K), by Types 2025 & 2033
- Figure 9: North America Mobile Phone Glass Cover Revenue Share (%), by Types 2025 & 2033
- Figure 10: North America Mobile Phone Glass Cover Volume Share (%), by Types 2025 & 2033
- Figure 11: North America Mobile Phone Glass Cover Revenue (billion), by Country 2025 & 2033
- Figure 12: North America Mobile Phone Glass Cover Volume (K), by Country 2025 & 2033
- Figure 13: North America Mobile Phone Glass Cover Revenue Share (%), by Country 2025 & 2033
- Figure 14: North America Mobile Phone Glass Cover Volume Share (%), by Country 2025 & 2033
- Figure 15: South America Mobile Phone Glass Cover Revenue (billion), by Application 2025 & 2033
- Figure 16: South America Mobile Phone Glass Cover Volume (K), by Application 2025 & 2033
- Figure 17: South America Mobile Phone Glass Cover Revenue Share (%), by Application 2025 & 2033
- Figure 18: South America Mobile Phone Glass Cover Volume Share (%), by Application 2025 & 2033
- Figure 19: South America Mobile Phone Glass Cover Revenue (billion), by Types 2025 & 2033
- Figure 20: South America Mobile Phone Glass Cover Volume (K), by Types 2025 & 2033
- Figure 21: South America Mobile Phone Glass Cover Revenue Share (%), by Types 2025 & 2033
- Figure 22: South America Mobile Phone Glass Cover Volume Share (%), by Types 2025 & 2033
- Figure 23: South America Mobile Phone Glass Cover Revenue (billion), by Country 2025 & 2033
- Figure 24: South America Mobile Phone Glass Cover Volume (K), by Country 2025 & 2033
- Figure 25: South America Mobile Phone Glass Cover Revenue Share (%), by Country 2025 & 2033
- Figure 26: South America Mobile Phone Glass Cover Volume Share (%), by Country 2025 & 2033
- Figure 27: Europe Mobile Phone Glass Cover Revenue (billion), by Application 2025 & 2033
- Figure 28: Europe Mobile Phone Glass Cover Volume (K), by Application 2025 & 2033
- Figure 29: Europe Mobile Phone Glass Cover Revenue Share (%), by Application 2025 & 2033
- Figure 30: Europe Mobile Phone Glass Cover Volume Share (%), by Application 2025 & 2033
- Figure 31: Europe Mobile Phone Glass Cover Revenue (billion), by Types 2025 & 2033
- Figure 32: Europe Mobile Phone Glass Cover Volume (K), by Types 2025 & 2033
- Figure 33: Europe Mobile Phone Glass Cover Revenue Share (%), by Types 2025 & 2033
- Figure 34: Europe Mobile Phone Glass Cover Volume Share (%), by Types 2025 & 2033
- Figure 35: Europe Mobile Phone Glass Cover Revenue (billion), by Country 2025 & 2033
- Figure 36: Europe Mobile Phone Glass Cover Volume (K), by Country 2025 & 2033
- Figure 37: Europe Mobile Phone Glass Cover Revenue Share (%), by Country 2025 & 2033
- Figure 38: Europe Mobile Phone Glass Cover Volume Share (%), by Country 2025 & 2033
- Figure 39: Middle East & Africa Mobile Phone Glass Cover Revenue (billion), by Application 2025 & 2033
- Figure 40: Middle East & Africa Mobile Phone Glass Cover Volume (K), by Application 2025 & 2033
- Figure 41: Middle East & Africa Mobile Phone Glass Cover Revenue Share (%), by Application 2025 & 2033
- Figure 42: Middle East & Africa Mobile Phone Glass Cover Volume Share (%), by Application 2025 & 2033
- Figure 43: Middle East & Africa Mobile Phone Glass Cover Revenue (billion), by Types 2025 & 2033
- Figure 44: Middle East & Africa Mobile Phone Glass Cover Volume (K), by Types 2025 & 2033
- Figure 45: Middle East & Africa Mobile Phone Glass Cover Revenue Share (%), by Types 2025 & 2033
- Figure 46: Middle East & Africa Mobile Phone Glass Cover Volume Share (%), by Types 2025 & 2033
- Figure 47: Middle East & Africa Mobile Phone Glass Cover Revenue (billion), by Country 2025 & 2033
- Figure 48: Middle East & Africa Mobile Phone Glass Cover Volume (K), by Country 2025 & 2033
- Figure 49: Middle East & Africa Mobile Phone Glass Cover Revenue Share (%), by Country 2025 & 2033
- Figure 50: Middle East & Africa Mobile Phone Glass Cover Volume Share (%), by Country 2025 & 2033
- Figure 51: Asia Pacific Mobile Phone Glass Cover Revenue (billion), by Application 2025 & 2033
- Figure 52: Asia Pacific Mobile Phone Glass Cover Volume (K), by Application 2025 & 2033
- Figure 53: Asia Pacific Mobile Phone Glass Cover Revenue Share (%), by Application 2025 & 2033
- Figure 54: Asia Pacific Mobile Phone Glass Cover Volume Share (%), by Application 2025 & 2033
- Figure 55: Asia Pacific Mobile Phone Glass Cover Revenue (billion), by Types 2025 & 2033
- Figure 56: Asia Pacific Mobile Phone Glass Cover Volume (K), by Types 2025 & 2033
- Figure 57: Asia Pacific Mobile Phone Glass Cover Revenue Share (%), by Types 2025 & 2033
- Figure 58: Asia Pacific Mobile Phone Glass Cover Volume Share (%), by Types 2025 & 2033
- Figure 59: Asia Pacific Mobile Phone Glass Cover Revenue (billion), by Country 2025 & 2033
- Figure 60: Asia Pacific Mobile Phone Glass Cover Volume (K), by Country 2025 & 2033
- Figure 61: Asia Pacific Mobile Phone Glass Cover Revenue Share (%), by Country 2025 & 2033
- Figure 62: Asia Pacific Mobile Phone Glass Cover Volume Share (%), by Country 2025 & 2033
List of Tables
- Table 1: Global Mobile Phone Glass Cover Revenue billion Forecast, by Application 2020 & 2033
- Table 2: Global Mobile Phone Glass Cover Volume K Forecast, by Application 2020 & 2033
- Table 3: Global Mobile Phone Glass Cover Revenue billion Forecast, by Types 2020 & 2033
- Table 4: Global Mobile Phone Glass Cover Volume K Forecast, by Types 2020 & 2033
- Table 5: Global Mobile Phone Glass Cover Revenue billion Forecast, by Region 2020 & 2033
- Table 6: Global Mobile Phone Glass Cover Volume K Forecast, by Region 2020 & 2033
- Table 7: Global Mobile Phone Glass Cover Revenue billion Forecast, by Application 2020 & 2033
- Table 8: Global Mobile Phone Glass Cover Volume K Forecast, by Application 2020 & 2033
- Table 9: Global Mobile Phone Glass Cover Revenue billion Forecast, by Types 2020 & 2033
- Table 10: Global Mobile Phone Glass Cover Volume K Forecast, by Types 2020 & 2033
- Table 11: Global Mobile Phone Glass Cover Revenue billion Forecast, by Country 2020 & 2033
- Table 12: Global Mobile Phone Glass Cover Volume K Forecast, by Country 2020 & 2033
- Table 13: United States Mobile Phone Glass Cover Revenue (billion) Forecast, by Application 2020 & 2033
- Table 14: United States Mobile Phone Glass Cover Volume (K) Forecast, by Application 2020 & 2033
- Table 15: Canada Mobile Phone Glass Cover Revenue (billion) Forecast, by Application 2020 & 2033
- Table 16: Canada Mobile Phone Glass Cover Volume (K) Forecast, by Application 2020 & 2033
- Table 17: Mexico Mobile Phone Glass Cover Revenue (billion) Forecast, by Application 2020 & 2033
- Table 18: Mexico Mobile Phone Glass Cover Volume (K) Forecast, by Application 2020 & 2033
- Table 19: Global Mobile Phone Glass Cover Revenue billion Forecast, by Application 2020 & 2033
- Table 20: Global Mobile Phone Glass Cover Volume K Forecast, by Application 2020 & 2033
- Table 21: Global Mobile Phone Glass Cover Revenue billion Forecast, by Types 2020 & 2033
- Table 22: Global Mobile Phone Glass Cover Volume K Forecast, by Types 2020 & 2033
- Table 23: Global Mobile Phone Glass Cover Revenue billion Forecast, by Country 2020 & 2033
- Table 24: Global Mobile Phone Glass Cover Volume K Forecast, by Country 2020 & 2033
- Table 25: Brazil Mobile Phone Glass Cover Revenue (billion) Forecast, by Application 2020 & 2033
- Table 26: Brazil Mobile Phone Glass Cover Volume (K) Forecast, by Application 2020 & 2033
- Table 27: Argentina Mobile Phone Glass Cover Revenue (billion) Forecast, by Application 2020 & 2033
- Table 28: Argentina Mobile Phone Glass Cover Volume (K) Forecast, by Application 2020 & 2033
- Table 29: Rest of South America Mobile Phone Glass Cover Revenue (billion) Forecast, by Application 2020 & 2033
- Table 30: Rest of South America Mobile Phone Glass Cover Volume (K) Forecast, by Application 2020 & 2033
- Table 31: Global Mobile Phone Glass Cover Revenue billion Forecast, by Application 2020 & 2033
- Table 32: Global Mobile Phone Glass Cover Volume K Forecast, by Application 2020 & 2033
- Table 33: Global Mobile Phone Glass Cover Revenue billion Forecast, by Types 2020 & 2033
- Table 34: Global Mobile Phone Glass Cover Volume K Forecast, by Types 2020 & 2033
- Table 35: Global Mobile Phone Glass Cover Revenue billion Forecast, by Country 2020 & 2033
- Table 36: Global Mobile Phone Glass Cover Volume K Forecast, by Country 2020 & 2033
- Table 37: United Kingdom Mobile Phone Glass Cover Revenue (billion) Forecast, by Application 2020 & 2033
- Table 38: United Kingdom Mobile Phone Glass Cover Volume (K) Forecast, by Application 2020 & 2033
- Table 39: Germany Mobile Phone Glass Cover Revenue (billion) Forecast, by Application 2020 & 2033
- Table 40: Germany Mobile Phone Glass Cover Volume (K) Forecast, by Application 2020 & 2033
- Table 41: France Mobile Phone Glass Cover Revenue (billion) Forecast, by Application 2020 & 2033
- Table 42: France Mobile Phone Glass Cover Volume (K) Forecast, by Application 2020 & 2033
- Table 43: Italy Mobile Phone Glass Cover Revenue (billion) Forecast, by Application 2020 & 2033
- Table 44: Italy Mobile Phone Glass Cover Volume (K) Forecast, by Application 2020 & 2033
- Table 45: Spain Mobile Phone Glass Cover Revenue (billion) Forecast, by Application 2020 & 2033
- Table 46: Spain Mobile Phone Glass Cover Volume (K) Forecast, by Application 2020 & 2033
- Table 47: Russia Mobile Phone Glass Cover Revenue (billion) Forecast, by Application 2020 & 2033
- Table 48: Russia Mobile Phone Glass Cover Volume (K) Forecast, by Application 2020 & 2033
- Table 49: Benelux Mobile Phone Glass Cover Revenue (billion) Forecast, by Application 2020 & 2033
- Table 50: Benelux Mobile Phone Glass Cover Volume (K) Forecast, by Application 2020 & 2033
- Table 51: Nordics Mobile Phone Glass Cover Revenue (billion) Forecast, by Application 2020 & 2033
- Table 52: Nordics Mobile Phone Glass Cover Volume (K) Forecast, by Application 2020 & 2033
- Table 53: Rest of Europe Mobile Phone Glass Cover Revenue (billion) Forecast, by Application 2020 & 2033
- Table 54: Rest of Europe Mobile Phone Glass Cover Volume (K) Forecast, by Application 2020 & 2033
- Table 55: Global Mobile Phone Glass Cover Revenue billion Forecast, by Application 2020 & 2033
- Table 56: Global Mobile Phone Glass Cover Volume K Forecast, by Application 2020 & 2033
- Table 57: Global Mobile Phone Glass Cover Revenue billion Forecast, by Types 2020 & 2033
- Table 58: Global Mobile Phone Glass Cover Volume K Forecast, by Types 2020 & 2033
- Table 59: Global Mobile Phone Glass Cover Revenue billion Forecast, by Country 2020 & 2033
- Table 60: Global Mobile Phone Glass Cover Volume K Forecast, by Country 2020 & 2033
- Table 61: Turkey Mobile Phone Glass Cover Revenue (billion) Forecast, by Application 2020 & 2033
- Table 62: Turkey Mobile Phone Glass Cover Volume (K) Forecast, by Application 2020 & 2033
- Table 63: Israel Mobile Phone Glass Cover Revenue (billion) Forecast, by Application 2020 & 2033
- Table 64: Israel Mobile Phone Glass Cover Volume (K) Forecast, by Application 2020 & 2033
- Table 65: GCC Mobile Phone Glass Cover Revenue (billion) Forecast, by Application 2020 & 2033
- Table 66: GCC Mobile Phone Glass Cover Volume (K) Forecast, by Application 2020 & 2033
- Table 67: North Africa Mobile Phone Glass Cover Revenue (billion) Forecast, by Application 2020 & 2033
- Table 68: North Africa Mobile Phone Glass Cover Volume (K) Forecast, by Application 2020 & 2033
- Table 69: South Africa Mobile Phone Glass Cover Revenue (billion) Forecast, by Application 2020 & 2033
- Table 70: South Africa Mobile Phone Glass Cover Volume (K) Forecast, by Application 2020 & 2033
- Table 71: Rest of Middle East & Africa Mobile Phone Glass Cover Revenue (billion) Forecast, by Application 2020 & 2033
- Table 72: Rest of Middle East & Africa Mobile Phone Glass Cover Volume (K) Forecast, by Application 2020 & 2033
- Table 73: Global Mobile Phone Glass Cover Revenue billion Forecast, by Application 2020 & 2033
- Table 74: Global Mobile Phone Glass Cover Volume K Forecast, by Application 2020 & 2033
- Table 75: Global Mobile Phone Glass Cover Revenue billion Forecast, by Types 2020 & 2033
- Table 76: Global Mobile Phone Glass Cover Volume K Forecast, by Types 2020 & 2033
- Table 77: Global Mobile Phone Glass Cover Revenue billion Forecast, by Country 2020 & 2033
- Table 78: Global Mobile Phone Glass Cover Volume K Forecast, by Country 2020 & 2033
- Table 79: China Mobile Phone Glass Cover Revenue (billion) Forecast, by Application 2020 & 2033
- Table 80: China Mobile Phone Glass Cover Volume (K) Forecast, by Application 2020 & 2033
- Table 81: India Mobile Phone Glass Cover Revenue (billion) Forecast, by Application 2020 & 2033
- Table 82: India Mobile Phone Glass Cover Volume (K) Forecast, by Application 2020 & 2033
- Table 83: Japan Mobile Phone Glass Cover Revenue (billion) Forecast, by Application 2020 & 2033
- Table 84: Japan Mobile Phone Glass Cover Volume (K) Forecast, by Application 2020 & 2033
- Table 85: South Korea Mobile Phone Glass Cover Revenue (billion) Forecast, by Application 2020 & 2033
- Table 86: South Korea Mobile Phone Glass Cover Volume (K) Forecast, by Application 2020 & 2033
- Table 87: ASEAN Mobile Phone Glass Cover Revenue (billion) Forecast, by Application 2020 & 2033
- Table 88: ASEAN Mobile Phone Glass Cover Volume (K) Forecast, by Application 2020 & 2033
- Table 89: Oceania Mobile Phone Glass Cover Revenue (billion) Forecast, by Application 2020 & 2033
- Table 90: Oceania Mobile Phone Glass Cover Volume (K) Forecast, by Application 2020 & 2033
- Table 91: Rest of Asia Pacific Mobile Phone Glass Cover Revenue (billion) Forecast, by Application 2020 & 2033
- Table 92: Rest of Asia Pacific Mobile Phone Glass Cover Volume (K) Forecast, by Application 2020 & 2033
Frequently Asked Questions
1. What is the projected Compound Annual Growth Rate (CAGR) of the Mobile Phone Glass Cover?
The projected CAGR is approximately 3.5%.
2. Which companies are prominent players in the Mobile Phone Glass Cover?
Key companies in the market include Corning Inc., AGC Inc, Nippon Electric Glass Co., Ltd., Schott AG, Biel Crystal Manufactory Limited, TPK Holding Co., Ltd., O-film Tech Co., Ltd., NEG, Tunghsu Group, KMTC.
3. What are the main segments of the Mobile Phone Glass Cover?
The market segments include Application, Types.
4. Can you provide details about the market size?
The market size is estimated to be USD 46.58 billion as of 2022.
5. What are some drivers contributing to market growth?
N/A
6. What are the notable trends driving market growth?
N/A
7. Are there any restraints impacting market growth?
N/A
8. Can you provide examples of recent developments in the market?
N/A
9. What pricing options are available for accessing the report?
Pricing options include single-user, multi-user, and enterprise licenses priced at USD 3350.00, USD 5025.00, and USD 6700.00 respectively.
10. Is the market size provided in terms of value or volume?
The market size is provided in terms of value, measured in billion and volume, measured in K.
11. Are there any specific market keywords associated with the report?
Yes, the market keyword associated with the report is "Mobile Phone Glass Cover," which aids in identifying and referencing the specific market segment covered.
12. How do I determine which pricing option suits my needs best?
The pricing options vary based on user requirements and access needs. Individual users may opt for single-user licenses, while businesses requiring broader access may choose multi-user or enterprise licenses for cost-effective access to the report.
13. Are there any additional resources or data provided in the Mobile Phone Glass Cover report?
While the report offers comprehensive insights, it's advisable to review the specific contents or supplementary materials provided to ascertain if additional resources or data are available.
14. How can I stay updated on further developments or reports in the Mobile Phone Glass Cover?
To stay informed about further developments, trends, and reports in the Mobile Phone Glass Cover, consider subscribing to industry newsletters, following relevant companies and organizations, or regularly checking reputable industry news sources and publications.
Methodology
Step 1 - Identification of Relevant Samples Size from Population Database


Step 2 - Approaches for Defining Global Market Size (Value, Volume* & Price*)

Note*: In applicable scenarios
Step 3 - Data Sources
Primary Research
- Web Analytics
- Survey Reports
- Research Institute
- Latest Research Reports
- Opinion Leaders
Secondary Research
- Annual Reports
- White Paper
- Latest Press Release
- Industry Association
- Paid Database
- Investor Presentations

Step 4 - Data Triangulation
Involves using different sources of information in order to increase the validity of a study
These sources are likely to be stakeholders in a program - participants, other researchers, program staff, other community members, and so on.
Then we put all data in single framework & apply various statistical tools to find out the dynamic on the market.
During the analysis stage, feedback from the stakeholder groups would be compared to determine areas of agreement as well as areas of divergence