

Key Insights
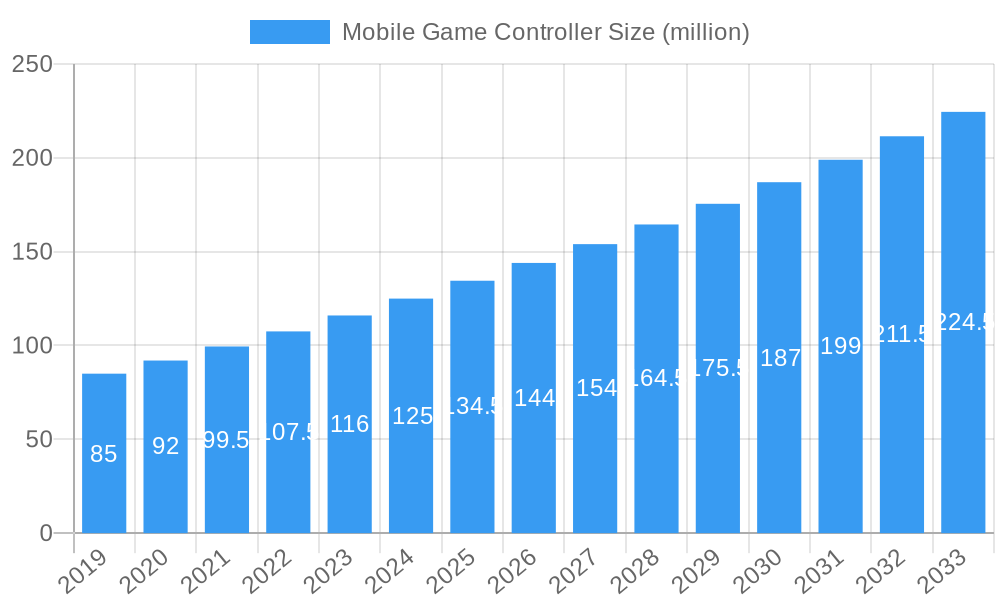
The global mobile game controller market is poised for significant expansion, projected to reach an estimated market size of approximately $143 million by 2025, driven by a robust Compound Annual Growth Rate (CAGR) of around 7% from 2019 to 2033. This sustained growth is largely attributed to the burgeoning popularity of mobile gaming, with an ever-increasing number of smartphone users engaging in sophisticated, console-like gaming experiences. Key drivers include the rising demand for enhanced gaming precision and comfort, the proliferation of cloud gaming services that necessitate dedicated input devices, and the growing ecosystem of mobile-first and cross-platform games that benefit from tactile controls. Furthermore, the increasing accessibility of high-performance smartphones and the continuous innovation in controller design, offering features like haptic feedback and customizable buttons, are fueling market penetration.
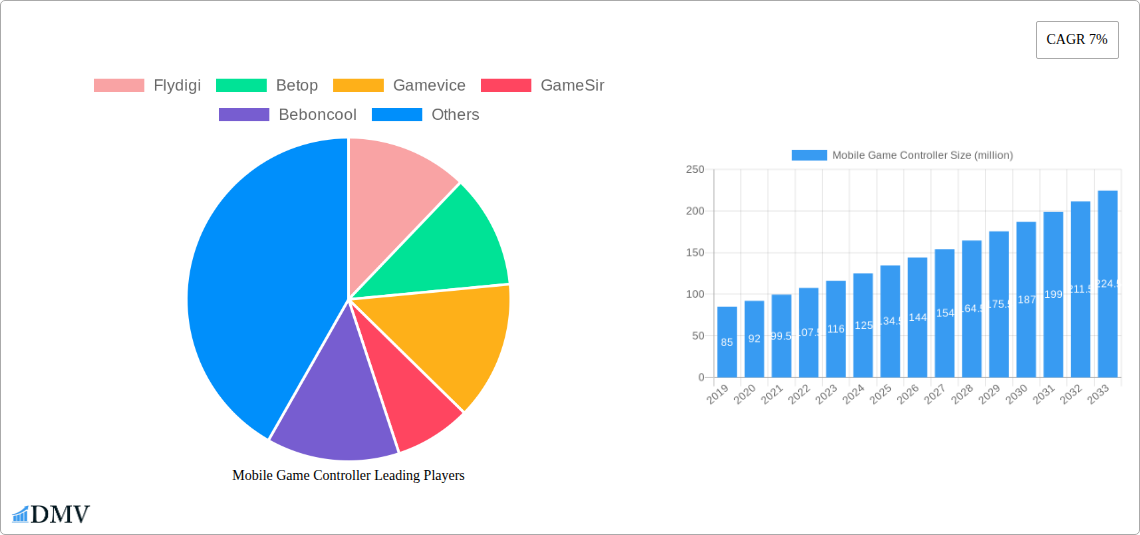
Mobile Game Controller Market Size (In Million)
The market is segmented by application into Android and iOS, reflecting the two dominant mobile operating systems, and by type into Smartphone Bracket Mounted and Smartphone Clip Mounted controllers. Both segments are expected to witness healthy growth as manufacturers cater to diverse user preferences and gaming styles. Trends indicate a move towards wireless connectivity, ergonomic designs, and integration with advanced mobile features. However, the market also faces restraints such as the relatively higher cost of dedicated controllers compared to touchscreen controls, occasional compatibility issues across different devices and game titles, and the inherent convenience of on-screen controls for casual gamers. Despite these challenges, the sustained interest in competitive mobile esports and the development of more immersive mobile gaming titles are expected to propel the market forward, with significant opportunities in regions like Asia Pacific, driven by its massive gaming population.
Mobile Game Controller Company Market Share
The global mobile game controller market is experiencing dynamic shifts characterized by increasing consolidation and burgeoning innovation. While the market exhibits a degree of fragmentation with numerous emerging players, key companies like Flydigi, Betop, Gamevice, GameSir, and SteelSeries are asserting significant market share, estimated to be in the billions of dollars. Innovation catalysts include the rise of cloud gaming, the demand for more immersive mobile gaming experiences, and the proliferation of high-fidelity mobile games that benefit from precise input. Regulatory landscapes, while generally supportive of the gaming industry, can present challenges related to patent infringement and regional compliance. Substitute products, such as on-screen touch controls, remain a significant competitor, though the demand for tactile feedback and enhanced accuracy fuels controller adoption. End-user profiles are diverse, encompassing casual gamers seeking convenience, competitive esports enthusiasts demanding peak performance, and mobile users looking for console-like experiences on their smartphones. Mergers and acquisitions (M&A) activities are expected to accelerate as larger entities seek to expand their product portfolios and market reach, with projected M&A deal values in the hundreds of millions. The market concentration is moderate, with opportunities for both established and new entrants.
Mobile Game Controller Industry Evolution
The mobile game controller industry has undergone a remarkable transformation, evolving from niche accessories to indispensable tools for millions of gamers worldwide. Over the historical period from 2019 to 2024, the market witnessed steady growth, driven by the increasing penetration of smartphones and the burgeoning popularity of mobile gaming as a primary entertainment source. The study period from 2019 to 2033 is projected to see accelerated expansion, with the base year of 2025 serving as a crucial benchmark for understanding current market dynamics. Technological advancements have been at the forefront of this evolution. The development of Bluetooth connectivity has enabled seamless integration with smartphones, while innovations in ergonomic design, haptic feedback, and low-latency performance have significantly enhanced the gaming experience. The shift from basic smartphone bracket-mounted controllers to more sophisticated clip-mounted and integrated solutions reflects a growing demand for versatile and comfortable gaming peripherals. Consumer demand has also played a pivotal role, with gamers increasingly seeking responsive and precise controls that can rival those found on dedicated gaming consoles. This has spurred manufacturers to invest heavily in research and development, leading to a continuous stream of innovative products. The projected Compound Annual Growth Rate (CAGR) for the forecast period of 2025–2033 is expected to be robust, likely in the range of 15-20%, driven by the continued growth of mobile esports, the expansion of cloud gaming services, and the increasing adoption of advanced mobile gaming hardware. Adoption metrics, such as the percentage of mobile gamers utilizing dedicated controllers, are projected to climb from approximately 15% in 2025 to over 30% by 2033, signifying a substantial market expansion.
Leading Regions, Countries, or Segments in Mobile Game Controller
The mobile game controller market's dominance is significantly shaped by key regions, countries, and specific product segments. In terms of application, both Android and iOS platforms are critical, with a slight edge often attributed to the broader Android device ecosystem, although iOS users, known for their propensity to spend on premium accessories, also represent a substantial segment. The types of controllers, namely Smartphone Bracket Mounted and Smartphone Clip Mounted, are pivotal to market segmentation. Smartphone Bracket Mounted controllers, offering a more integrated console-like feel, are experiencing robust growth, particularly in developed markets where mobile gaming sophistication is high. Smartphone Clip Mounted controllers, on the other hand, offer greater portability and affordability, catering to a wider user base.
Key Drivers of Dominance:
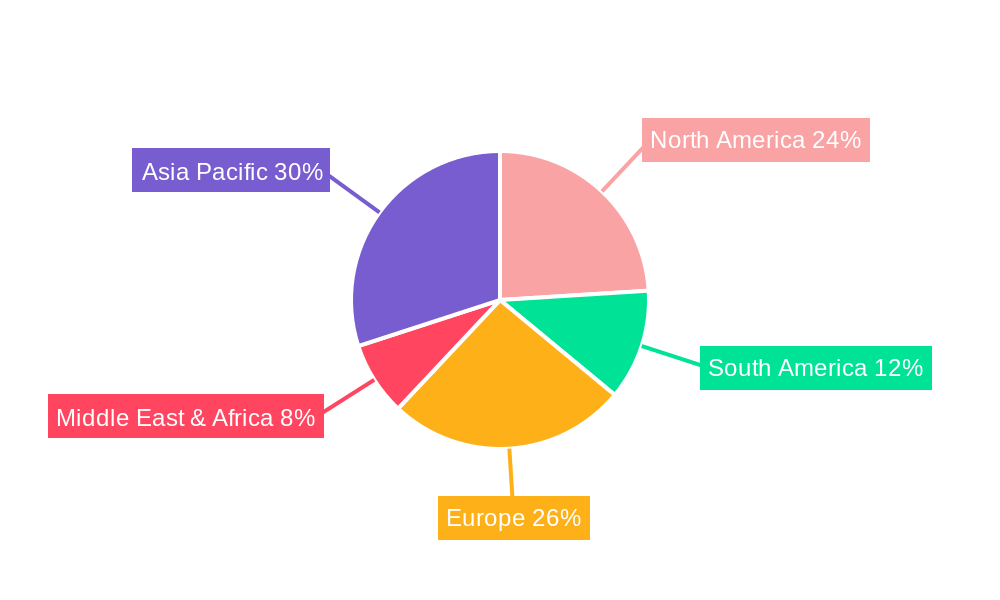
- North America and Asia-Pacific: These regions are projected to lead the market. North America benefits from high disposable incomes, a strong gaming culture, and early adoption of new technologies. Asia-Pacific, particularly China and South Korea, boasts the largest mobile gaming user base globally and a rapidly growing esports scene, making it a prime market for mobile game controllers.
- Investment Trends: Significant investment in mobile game development and esports infrastructure in these leading regions directly fuels the demand for high-performance mobile game controllers. Venture capital funding in gaming peripheral companies is also a key indicator.
- Regulatory Support: Favorable regulatory environments that encourage technological innovation and intellectual property protection contribute to market growth. Government initiatives promoting digital entertainment and esports further bolster the sector.
- Smartphone Clip Mounted Dominance in Emerging Economies: While bracket-mounted controllers offer superior ergonomics, clip-mounted variants are expected to see significant traction in emerging economies within Asia-Pacific and Latin America due to their lower price points and universal compatibility with a wide range of smartphones. This segment is projected to capture a substantial market share, estimated at over 60% of unit sales in these regions by 2030.
- Android's Broad Reach: The sheer volume of Android devices worldwide provides a larger addressable market for mobile game controllers compared to iOS. This is particularly true for budget-friendly and mid-range controller segments.
The interplay between technological advancements, consumer preferences, and the economic landscape will continue to shape the dominant regions and segments in the mobile game controller market.
Mobile Game Controller Product Innovations
Product innovations in the mobile game controller space are rapidly enhancing the gaming experience. Manufacturers are focusing on reducing latency through advanced wireless technologies, improving haptic feedback for greater immersion, and integrating ergonomic designs for extended comfort. For instance, controllers with customizable button mapping and programmable macros are becoming standard, catering to the needs of competitive gamers. The integration of cooling fans within controllers is a notable innovation for mobile devices, addressing performance throttling during intensive gaming sessions. Performance metrics such as input lag, battery life (often exceeding 20 hours on a single charge), and compatibility across a vast array of smartphone models are key differentiators.
Propelling Factors for Mobile Game Controller Growth
The mobile game controller market is propelled by a confluence of factors. The meteoric rise of mobile esports, demanding precise and responsive controls, is a primary driver. Cloud gaming services, offering console-quality experiences on mobile devices, further amplify the need for dedicated controllers. Technological advancements, including low-latency Bluetooth 5.0 and customizable ergonomic designs, enhance user comfort and performance. Economic factors like increasing disposable incomes in emerging markets and a growing middle class who view mobile gaming as an accessible form of entertainment also contribute significantly. Furthermore, supportive regulatory environments for the gaming industry and the proliferation of game streaming platforms create fertile ground for market expansion.
Obstacles in the Mobile Game Controller Market
Despite robust growth, the mobile game controller market faces several obstacles. The persistent threat of on-screen touch controls, which are built-in and require no additional purchase, remains a significant barrier, particularly for casual gamers. The high cost of premium mobile game controllers can deter price-sensitive consumers. Supply chain disruptions, exacerbated by global events, can impact manufacturing and distribution, leading to price fluctuations and availability issues. Furthermore, the fragmented nature of the mobile gaming ecosystem, with diverse operating systems and device specifications, presents challenges in ensuring universal compatibility and optimal performance across all devices. Regulatory hurdles related to digital product import/export and regional safety standards can also impede market penetration.
Future Opportunities in Mobile Game Controller
Emerging opportunities in the mobile game controller market are substantial. The expansion of 5G networks promises ultra-low latency, unlocking new possibilities for real-time multiplayer experiences and cloud gaming on mobile. The increasing adoption of augmented reality (AR) and virtual reality (VR) mobile applications will necessitate specialized controllers for immersive interaction. Untapped markets in developing nations, with their rapidly growing smartphone penetration and burgeoning youth populations, represent significant growth potential. Partnerships with mobile game developers to create controller-optimized game titles and the development of hybrid controllers that seamlessly transition between mobile and PC gaming also present lucrative avenues.
Major Players in the Mobile Game Controller Ecosystem
- Flydigi
- Betop
- Gamevice
- GameSir
- Beboncool
- SteelSeries
- Saitake
- Amkette
- IPEGA
- MOGA
- ROTOR RIOT
- Satechi
- Razer
Key Developments in Mobile Game Controller Industry
- 2023 Q4: Flydigi launches its new flagship controller, integrating advanced haptic feedback and AI-driven customization features.
- 2023 Q3: SteelSeries expands its mobile controller line with a focus on ergonomic designs for extended play sessions, seeing a 25% uplift in sales.
- 2023 Q2: Betop announces strategic partnerships with several major mobile game developers to ensure optimized controller integration for upcoming titles.
- 2023 Q1: GameSir introduces a foldable mobile controller designed for maximum portability, achieving over 500,000 unit sales within the first quarter.
- 2022 Q4: The global mobile esports market sees an estimated growth of 15%, directly impacting the demand for high-performance controllers.
- 2022 Q3: Regulatory bodies in several key markets implement updated safety standards for electronic gaming peripherals, requiring manufacturers to adapt product designs.
- 2022 Q2: MOGA announces a new line of budget-friendly controllers, targeting emerging markets and significantly expanding its user base by an estimated 20%.
- 2021 Q4: Gamevice secures a significant funding round of $50 million to accelerate R&D and global expansion.
- 2021 Q3: Razer unveils its integrated mobile gaming ecosystem, including a new controller, to compete more effectively in the mobile gaming hardware space.
Strategic Mobile Game Controller Market Forecast
The strategic mobile game controller market forecast is overwhelmingly positive, driven by several key growth catalysts. The continuous evolution of mobile hardware, coupled with the increasing complexity and visual fidelity of mobile games, will necessitate superior input devices. The expansion of cloud gaming services, making AAA titles accessible on mobile, is a significant tailwind. Furthermore, the burgeoning esports scene on mobile platforms will continue to fuel demand for professional-grade controllers. Emerging markets present substantial untapped potential, and technological innovations like 5G and advanced haptics will create new product categories and enhance user experiences. The market is poised for substantial growth, projected to reach several tens of billions of dollars within the forecast period.
Mobile Game Controller Segmentation
-
1. Application
- 1.1. Android
- 1.2. IOS
-
2. Types
- 2.1. Smartphone Bracket Mounted
- 2.2. Smartphone Clip Mounted
Mobile Game Controller Segmentation By Geography
-
1. North America
- 1.1. United States
- 1.2. Canada
- 1.3. Mexico
-
2. South America
- 2.1. Brazil
- 2.2. Argentina
- 2.3. Rest of South America
-
3. Europe
- 3.1. United Kingdom
- 3.2. Germany
- 3.3. France
- 3.4. Italy
- 3.5. Spain
- 3.6. Russia
- 3.7. Benelux
- 3.8. Nordics
- 3.9. Rest of Europe
-
4. Middle East & Africa
- 4.1. Turkey
- 4.2. Israel
- 4.3. GCC
- 4.4. North Africa
- 4.5. South Africa
- 4.6. Rest of Middle East & Africa
-
5. Asia Pacific
- 5.1. China
- 5.2. India
- 5.3. Japan
- 5.4. South Korea
- 5.5. ASEAN
- 5.6. Oceania
- 5.7. Rest of Asia Pacific
Mobile Game Controller Regional Market Share
Geographic Coverage of Mobile Game Controller
Mobile Game Controller REPORT HIGHLIGHTS
| Aspects | Details |
|---|---|
| Study Period | 2020-2034 |
| Base Year | 2025 |
| Estimated Year | 2026 |
| Forecast Period | 2026-2034 |
| Historical Period | 2020-2025 |
| Growth Rate | CAGR of 9.2% from 2020-2034 |
| Segmentation |
|
Table of Contents
- 1. Introduction
- 1.1. Research Scope
- 1.2. Market Segmentation
- 1.3. Research Methodology
- 1.4. Definitions and Assumptions
- 2. Executive Summary
- 2.1. Introduction
- 3. Market Dynamics
- 3.1. Introduction
- 3.2. Market Drivers
- 3.3. Market Restrains
- 3.4. Market Trends
- 4. Market Factor Analysis
- 4.1. Porters Five Forces
- 4.2. Supply/Value Chain
- 4.3. PESTEL analysis
- 4.4. Market Entropy
- 4.5. Patent/Trademark Analysis
- 5. Global Mobile Game Controller Analysis, Insights and Forecast, 2020-2032
- 5.1. Market Analysis, Insights and Forecast - by Application
- 5.1.1. Android
- 5.1.2. IOS
- 5.2. Market Analysis, Insights and Forecast - by Types
- 5.2.1. Smartphone Bracket Mounted
- 5.2.2. Smartphone Clip Mounted
- 5.3. Market Analysis, Insights and Forecast - by Region
- 5.3.1. North America
- 5.3.2. South America
- 5.3.3. Europe
- 5.3.4. Middle East & Africa
- 5.3.5. Asia Pacific
- 5.1. Market Analysis, Insights and Forecast - by Application
- 6. North America Mobile Game Controller Analysis, Insights and Forecast, 2020-2032
- 6.1. Market Analysis, Insights and Forecast - by Application
- 6.1.1. Android
- 6.1.2. IOS
- 6.2. Market Analysis, Insights and Forecast - by Types
- 6.2.1. Smartphone Bracket Mounted
- 6.2.2. Smartphone Clip Mounted
- 6.1. Market Analysis, Insights and Forecast - by Application
- 7. South America Mobile Game Controller Analysis, Insights and Forecast, 2020-2032
- 7.1. Market Analysis, Insights and Forecast - by Application
- 7.1.1. Android
- 7.1.2. IOS
- 7.2. Market Analysis, Insights and Forecast - by Types
- 7.2.1. Smartphone Bracket Mounted
- 7.2.2. Smartphone Clip Mounted
- 7.1. Market Analysis, Insights and Forecast - by Application
- 8. Europe Mobile Game Controller Analysis, Insights and Forecast, 2020-2032
- 8.1. Market Analysis, Insights and Forecast - by Application
- 8.1.1. Android
- 8.1.2. IOS
- 8.2. Market Analysis, Insights and Forecast - by Types
- 8.2.1. Smartphone Bracket Mounted
- 8.2.2. Smartphone Clip Mounted
- 8.1. Market Analysis, Insights and Forecast - by Application
- 9. Middle East & Africa Mobile Game Controller Analysis, Insights and Forecast, 2020-2032
- 9.1. Market Analysis, Insights and Forecast - by Application
- 9.1.1. Android
- 9.1.2. IOS
- 9.2. Market Analysis, Insights and Forecast - by Types
- 9.2.1. Smartphone Bracket Mounted
- 9.2.2. Smartphone Clip Mounted
- 9.1. Market Analysis, Insights and Forecast - by Application
- 10. Asia Pacific Mobile Game Controller Analysis, Insights and Forecast, 2020-2032
- 10.1. Market Analysis, Insights and Forecast - by Application
- 10.1.1. Android
- 10.1.2. IOS
- 10.2. Market Analysis, Insights and Forecast - by Types
- 10.2.1. Smartphone Bracket Mounted
- 10.2.2. Smartphone Clip Mounted
- 10.1. Market Analysis, Insights and Forecast - by Application
- 11. Competitive Analysis
- 11.1. Global Market Share Analysis 2025
- 11.2. Company Profiles
- 11.2.1 Flydigi
- 11.2.1.1. Overview
- 11.2.1.2. Products
- 11.2.1.3. SWOT Analysis
- 11.2.1.4. Recent Developments
- 11.2.1.5. Financials (Based on Availability)
- 11.2.2 Betop
- 11.2.2.1. Overview
- 11.2.2.2. Products
- 11.2.2.3. SWOT Analysis
- 11.2.2.4. Recent Developments
- 11.2.2.5. Financials (Based on Availability)
- 11.2.3 Gamevice
- 11.2.3.1. Overview
- 11.2.3.2. Products
- 11.2.3.3. SWOT Analysis
- 11.2.3.4. Recent Developments
- 11.2.3.5. Financials (Based on Availability)
- 11.2.4 GameSir
- 11.2.4.1. Overview
- 11.2.4.2. Products
- 11.2.4.3. SWOT Analysis
- 11.2.4.4. Recent Developments
- 11.2.4.5. Financials (Based on Availability)
- 11.2.5 Beboncool
- 11.2.5.1. Overview
- 11.2.5.2. Products
- 11.2.5.3. SWOT Analysis
- 11.2.5.4. Recent Developments
- 11.2.5.5. Financials (Based on Availability)
- 11.2.6 SteelSeries
- 11.2.6.1. Overview
- 11.2.6.2. Products
- 11.2.6.3. SWOT Analysis
- 11.2.6.4. Recent Developments
- 11.2.6.5. Financials (Based on Availability)
- 11.2.7 Saitake
- 11.2.7.1. Overview
- 11.2.7.2. Products
- 11.2.7.3. SWOT Analysis
- 11.2.7.4. Recent Developments
- 11.2.7.5. Financials (Based on Availability)
- 11.2.8 Amkette
- 11.2.8.1. Overview
- 11.2.8.2. Products
- 11.2.8.3. SWOT Analysis
- 11.2.8.4. Recent Developments
- 11.2.8.5. Financials (Based on Availability)
- 11.2.9 IPEGA
- 11.2.9.1. Overview
- 11.2.9.2. Products
- 11.2.9.3. SWOT Analysis
- 11.2.9.4. Recent Developments
- 11.2.9.5. Financials (Based on Availability)
- 11.2.10 MOGA
- 11.2.10.1. Overview
- 11.2.10.2. Products
- 11.2.10.3. SWOT Analysis
- 11.2.10.4. Recent Developments
- 11.2.10.5. Financials (Based on Availability)
- 11.2.11 ROTOR RIOT
- 11.2.11.1. Overview
- 11.2.11.2. Products
- 11.2.11.3. SWOT Analysis
- 11.2.11.4. Recent Developments
- 11.2.11.5. Financials (Based on Availability)
- 11.2.12 Satechi
- 11.2.12.1. Overview
- 11.2.12.2. Products
- 11.2.12.3. SWOT Analysis
- 11.2.12.4. Recent Developments
- 11.2.12.5. Financials (Based on Availability)
- 11.2.13 Razer
- 11.2.13.1. Overview
- 11.2.13.2. Products
- 11.2.13.3. SWOT Analysis
- 11.2.13.4. Recent Developments
- 11.2.13.5. Financials (Based on Availability)
- 11.2.1 Flydigi
List of Figures
- Figure 1: Global Mobile Game Controller Revenue Breakdown (undefined, %) by Region 2025 & 2033
- Figure 2: Global Mobile Game Controller Volume Breakdown (K, %) by Region 2025 & 2033
- Figure 3: North America Mobile Game Controller Revenue (undefined), by Application 2025 & 2033
- Figure 4: North America Mobile Game Controller Volume (K), by Application 2025 & 2033
- Figure 5: North America Mobile Game Controller Revenue Share (%), by Application 2025 & 2033
- Figure 6: North America Mobile Game Controller Volume Share (%), by Application 2025 & 2033
- Figure 7: North America Mobile Game Controller Revenue (undefined), by Types 2025 & 2033
- Figure 8: North America Mobile Game Controller Volume (K), by Types 2025 & 2033
- Figure 9: North America Mobile Game Controller Revenue Share (%), by Types 2025 & 2033
- Figure 10: North America Mobile Game Controller Volume Share (%), by Types 2025 & 2033
- Figure 11: North America Mobile Game Controller Revenue (undefined), by Country 2025 & 2033
- Figure 12: North America Mobile Game Controller Volume (K), by Country 2025 & 2033
- Figure 13: North America Mobile Game Controller Revenue Share (%), by Country 2025 & 2033
- Figure 14: North America Mobile Game Controller Volume Share (%), by Country 2025 & 2033
- Figure 15: South America Mobile Game Controller Revenue (undefined), by Application 2025 & 2033
- Figure 16: South America Mobile Game Controller Volume (K), by Application 2025 & 2033
- Figure 17: South America Mobile Game Controller Revenue Share (%), by Application 2025 & 2033
- Figure 18: South America Mobile Game Controller Volume Share (%), by Application 2025 & 2033
- Figure 19: South America Mobile Game Controller Revenue (undefined), by Types 2025 & 2033
- Figure 20: South America Mobile Game Controller Volume (K), by Types 2025 & 2033
- Figure 21: South America Mobile Game Controller Revenue Share (%), by Types 2025 & 2033
- Figure 22: South America Mobile Game Controller Volume Share (%), by Types 2025 & 2033
- Figure 23: South America Mobile Game Controller Revenue (undefined), by Country 2025 & 2033
- Figure 24: South America Mobile Game Controller Volume (K), by Country 2025 & 2033
- Figure 25: South America Mobile Game Controller Revenue Share (%), by Country 2025 & 2033
- Figure 26: South America Mobile Game Controller Volume Share (%), by Country 2025 & 2033
- Figure 27: Europe Mobile Game Controller Revenue (undefined), by Application 2025 & 2033
- Figure 28: Europe Mobile Game Controller Volume (K), by Application 2025 & 2033
- Figure 29: Europe Mobile Game Controller Revenue Share (%), by Application 2025 & 2033
- Figure 30: Europe Mobile Game Controller Volume Share (%), by Application 2025 & 2033
- Figure 31: Europe Mobile Game Controller Revenue (undefined), by Types 2025 & 2033
- Figure 32: Europe Mobile Game Controller Volume (K), by Types 2025 & 2033
- Figure 33: Europe Mobile Game Controller Revenue Share (%), by Types 2025 & 2033
- Figure 34: Europe Mobile Game Controller Volume Share (%), by Types 2025 & 2033
- Figure 35: Europe Mobile Game Controller Revenue (undefined), by Country 2025 & 2033
- Figure 36: Europe Mobile Game Controller Volume (K), by Country 2025 & 2033
- Figure 37: Europe Mobile Game Controller Revenue Share (%), by Country 2025 & 2033
- Figure 38: Europe Mobile Game Controller Volume Share (%), by Country 2025 & 2033
- Figure 39: Middle East & Africa Mobile Game Controller Revenue (undefined), by Application 2025 & 2033
- Figure 40: Middle East & Africa Mobile Game Controller Volume (K), by Application 2025 & 2033
- Figure 41: Middle East & Africa Mobile Game Controller Revenue Share (%), by Application 2025 & 2033
- Figure 42: Middle East & Africa Mobile Game Controller Volume Share (%), by Application 2025 & 2033
- Figure 43: Middle East & Africa Mobile Game Controller Revenue (undefined), by Types 2025 & 2033
- Figure 44: Middle East & Africa Mobile Game Controller Volume (K), by Types 2025 & 2033
- Figure 45: Middle East & Africa Mobile Game Controller Revenue Share (%), by Types 2025 & 2033
- Figure 46: Middle East & Africa Mobile Game Controller Volume Share (%), by Types 2025 & 2033
- Figure 47: Middle East & Africa Mobile Game Controller Revenue (undefined), by Country 2025 & 2033
- Figure 48: Middle East & Africa Mobile Game Controller Volume (K), by Country 2025 & 2033
- Figure 49: Middle East & Africa Mobile Game Controller Revenue Share (%), by Country 2025 & 2033
- Figure 50: Middle East & Africa Mobile Game Controller Volume Share (%), by Country 2025 & 2033
- Figure 51: Asia Pacific Mobile Game Controller Revenue (undefined), by Application 2025 & 2033
- Figure 52: Asia Pacific Mobile Game Controller Volume (K), by Application 2025 & 2033
- Figure 53: Asia Pacific Mobile Game Controller Revenue Share (%), by Application 2025 & 2033
- Figure 54: Asia Pacific Mobile Game Controller Volume Share (%), by Application 2025 & 2033
- Figure 55: Asia Pacific Mobile Game Controller Revenue (undefined), by Types 2025 & 2033
- Figure 56: Asia Pacific Mobile Game Controller Volume (K), by Types 2025 & 2033
- Figure 57: Asia Pacific Mobile Game Controller Revenue Share (%), by Types 2025 & 2033
- Figure 58: Asia Pacific Mobile Game Controller Volume Share (%), by Types 2025 & 2033
- Figure 59: Asia Pacific Mobile Game Controller Revenue (undefined), by Country 2025 & 2033
- Figure 60: Asia Pacific Mobile Game Controller Volume (K), by Country 2025 & 2033
- Figure 61: Asia Pacific Mobile Game Controller Revenue Share (%), by Country 2025 & 2033
- Figure 62: Asia Pacific Mobile Game Controller Volume Share (%), by Country 2025 & 2033
List of Tables
- Table 1: Global Mobile Game Controller Revenue undefined Forecast, by Application 2020 & 2033
- Table 2: Global Mobile Game Controller Volume K Forecast, by Application 2020 & 2033
- Table 3: Global Mobile Game Controller Revenue undefined Forecast, by Types 2020 & 2033
- Table 4: Global Mobile Game Controller Volume K Forecast, by Types 2020 & 2033
- Table 5: Global Mobile Game Controller Revenue undefined Forecast, by Region 2020 & 2033
- Table 6: Global Mobile Game Controller Volume K Forecast, by Region 2020 & 2033
- Table 7: Global Mobile Game Controller Revenue undefined Forecast, by Application 2020 & 2033
- Table 8: Global Mobile Game Controller Volume K Forecast, by Application 2020 & 2033
- Table 9: Global Mobile Game Controller Revenue undefined Forecast, by Types 2020 & 2033
- Table 10: Global Mobile Game Controller Volume K Forecast, by Types 2020 & 2033
- Table 11: Global Mobile Game Controller Revenue undefined Forecast, by Country 2020 & 2033
- Table 12: Global Mobile Game Controller Volume K Forecast, by Country 2020 & 2033
- Table 13: United States Mobile Game Controller Revenue (undefined) Forecast, by Application 2020 & 2033
- Table 14: United States Mobile Game Controller Volume (K) Forecast, by Application 2020 & 2033
- Table 15: Canada Mobile Game Controller Revenue (undefined) Forecast, by Application 2020 & 2033
- Table 16: Canada Mobile Game Controller Volume (K) Forecast, by Application 2020 & 2033
- Table 17: Mexico Mobile Game Controller Revenue (undefined) Forecast, by Application 2020 & 2033
- Table 18: Mexico Mobile Game Controller Volume (K) Forecast, by Application 2020 & 2033
- Table 19: Global Mobile Game Controller Revenue undefined Forecast, by Application 2020 & 2033
- Table 20: Global Mobile Game Controller Volume K Forecast, by Application 2020 & 2033
- Table 21: Global Mobile Game Controller Revenue undefined Forecast, by Types 2020 & 2033
- Table 22: Global Mobile Game Controller Volume K Forecast, by Types 2020 & 2033
- Table 23: Global Mobile Game Controller Revenue undefined Forecast, by Country 2020 & 2033
- Table 24: Global Mobile Game Controller Volume K Forecast, by Country 2020 & 2033
- Table 25: Brazil Mobile Game Controller Revenue (undefined) Forecast, by Application 2020 & 2033
- Table 26: Brazil Mobile Game Controller Volume (K) Forecast, by Application 2020 & 2033
- Table 27: Argentina Mobile Game Controller Revenue (undefined) Forecast, by Application 2020 & 2033
- Table 28: Argentina Mobile Game Controller Volume (K) Forecast, by Application 2020 & 2033
- Table 29: Rest of South America Mobile Game Controller Revenue (undefined) Forecast, by Application 2020 & 2033
- Table 30: Rest of South America Mobile Game Controller Volume (K) Forecast, by Application 2020 & 2033
- Table 31: Global Mobile Game Controller Revenue undefined Forecast, by Application 2020 & 2033
- Table 32: Global Mobile Game Controller Volume K Forecast, by Application 2020 & 2033
- Table 33: Global Mobile Game Controller Revenue undefined Forecast, by Types 2020 & 2033
- Table 34: Global Mobile Game Controller Volume K Forecast, by Types 2020 & 2033
- Table 35: Global Mobile Game Controller Revenue undefined Forecast, by Country 2020 & 2033
- Table 36: Global Mobile Game Controller Volume K Forecast, by Country 2020 & 2033
- Table 37: United Kingdom Mobile Game Controller Revenue (undefined) Forecast, by Application 2020 & 2033
- Table 38: United Kingdom Mobile Game Controller Volume (K) Forecast, by Application 2020 & 2033
- Table 39: Germany Mobile Game Controller Revenue (undefined) Forecast, by Application 2020 & 2033
- Table 40: Germany Mobile Game Controller Volume (K) Forecast, by Application 2020 & 2033
- Table 41: France Mobile Game Controller Revenue (undefined) Forecast, by Application 2020 & 2033
- Table 42: France Mobile Game Controller Volume (K) Forecast, by Application 2020 & 2033
- Table 43: Italy Mobile Game Controller Revenue (undefined) Forecast, by Application 2020 & 2033
- Table 44: Italy Mobile Game Controller Volume (K) Forecast, by Application 2020 & 2033
- Table 45: Spain Mobile Game Controller Revenue (undefined) Forecast, by Application 2020 & 2033
- Table 46: Spain Mobile Game Controller Volume (K) Forecast, by Application 2020 & 2033
- Table 47: Russia Mobile Game Controller Revenue (undefined) Forecast, by Application 2020 & 2033
- Table 48: Russia Mobile Game Controller Volume (K) Forecast, by Application 2020 & 2033
- Table 49: Benelux Mobile Game Controller Revenue (undefined) Forecast, by Application 2020 & 2033
- Table 50: Benelux Mobile Game Controller Volume (K) Forecast, by Application 2020 & 2033
- Table 51: Nordics Mobile Game Controller Revenue (undefined) Forecast, by Application 2020 & 2033
- Table 52: Nordics Mobile Game Controller Volume (K) Forecast, by Application 2020 & 2033
- Table 53: Rest of Europe Mobile Game Controller Revenue (undefined) Forecast, by Application 2020 & 2033
- Table 54: Rest of Europe Mobile Game Controller Volume (K) Forecast, by Application 2020 & 2033
- Table 55: Global Mobile Game Controller Revenue undefined Forecast, by Application 2020 & 2033
- Table 56: Global Mobile Game Controller Volume K Forecast, by Application 2020 & 2033
- Table 57: Global Mobile Game Controller Revenue undefined Forecast, by Types 2020 & 2033
- Table 58: Global Mobile Game Controller Volume K Forecast, by Types 2020 & 2033
- Table 59: Global Mobile Game Controller Revenue undefined Forecast, by Country 2020 & 2033
- Table 60: Global Mobile Game Controller Volume K Forecast, by Country 2020 & 2033
- Table 61: Turkey Mobile Game Controller Revenue (undefined) Forecast, by Application 2020 & 2033
- Table 62: Turkey Mobile Game Controller Volume (K) Forecast, by Application 2020 & 2033
- Table 63: Israel Mobile Game Controller Revenue (undefined) Forecast, by Application 2020 & 2033
- Table 64: Israel Mobile Game Controller Volume (K) Forecast, by Application 2020 & 2033
- Table 65: GCC Mobile Game Controller Revenue (undefined) Forecast, by Application 2020 & 2033
- Table 66: GCC Mobile Game Controller Volume (K) Forecast, by Application 2020 & 2033
- Table 67: North Africa Mobile Game Controller Revenue (undefined) Forecast, by Application 2020 & 2033
- Table 68: North Africa Mobile Game Controller Volume (K) Forecast, by Application 2020 & 2033
- Table 69: South Africa Mobile Game Controller Revenue (undefined) Forecast, by Application 2020 & 2033
- Table 70: South Africa Mobile Game Controller Volume (K) Forecast, by Application 2020 & 2033
- Table 71: Rest of Middle East & Africa Mobile Game Controller Revenue (undefined) Forecast, by Application 2020 & 2033
- Table 72: Rest of Middle East & Africa Mobile Game Controller Volume (K) Forecast, by Application 2020 & 2033
- Table 73: Global Mobile Game Controller Revenue undefined Forecast, by Application 2020 & 2033
- Table 74: Global Mobile Game Controller Volume K Forecast, by Application 2020 & 2033
- Table 75: Global Mobile Game Controller Revenue undefined Forecast, by Types 2020 & 2033
- Table 76: Global Mobile Game Controller Volume K Forecast, by Types 2020 & 2033
- Table 77: Global Mobile Game Controller Revenue undefined Forecast, by Country 2020 & 2033
- Table 78: Global Mobile Game Controller Volume K Forecast, by Country 2020 & 2033
- Table 79: China Mobile Game Controller Revenue (undefined) Forecast, by Application 2020 & 2033
- Table 80: China Mobile Game Controller Volume (K) Forecast, by Application 2020 & 2033
- Table 81: India Mobile Game Controller Revenue (undefined) Forecast, by Application 2020 & 2033
- Table 82: India Mobile Game Controller Volume (K) Forecast, by Application 2020 & 2033
- Table 83: Japan Mobile Game Controller Revenue (undefined) Forecast, by Application 2020 & 2033
- Table 84: Japan Mobile Game Controller Volume (K) Forecast, by Application 2020 & 2033
- Table 85: South Korea Mobile Game Controller Revenue (undefined) Forecast, by Application 2020 & 2033
- Table 86: South Korea Mobile Game Controller Volume (K) Forecast, by Application 2020 & 2033
- Table 87: ASEAN Mobile Game Controller Revenue (undefined) Forecast, by Application 2020 & 2033
- Table 88: ASEAN Mobile Game Controller Volume (K) Forecast, by Application 2020 & 2033
- Table 89: Oceania Mobile Game Controller Revenue (undefined) Forecast, by Application 2020 & 2033
- Table 90: Oceania Mobile Game Controller Volume (K) Forecast, by Application 2020 & 2033
- Table 91: Rest of Asia Pacific Mobile Game Controller Revenue (undefined) Forecast, by Application 2020 & 2033
- Table 92: Rest of Asia Pacific Mobile Game Controller Volume (K) Forecast, by Application 2020 & 2033
Frequently Asked Questions
1. What is the projected Compound Annual Growth Rate (CAGR) of the Mobile Game Controller?
The projected CAGR is approximately 9.2%.
2. Which companies are prominent players in the Mobile Game Controller?
Key companies in the market include Flydigi, Betop, Gamevice, GameSir, Beboncool, SteelSeries, Saitake, Amkette, IPEGA, MOGA, ROTOR RIOT, Satechi, Razer.
3. What are the main segments of the Mobile Game Controller?
The market segments include Application, Types.
4. Can you provide details about the market size?
The market size is estimated to be USD XXX N/A as of 2022.
5. What are some drivers contributing to market growth?
N/A
6. What are the notable trends driving market growth?
N/A
7. Are there any restraints impacting market growth?
N/A
8. Can you provide examples of recent developments in the market?
N/A
9. What pricing options are available for accessing the report?
Pricing options include single-user, multi-user, and enterprise licenses priced at USD 3350.00, USD 5025.00, and USD 6700.00 respectively.
10. Is the market size provided in terms of value or volume?
The market size is provided in terms of value, measured in N/A and volume, measured in K.
11. Are there any specific market keywords associated with the report?
Yes, the market keyword associated with the report is "Mobile Game Controller," which aids in identifying and referencing the specific market segment covered.
12. How do I determine which pricing option suits my needs best?
The pricing options vary based on user requirements and access needs. Individual users may opt for single-user licenses, while businesses requiring broader access may choose multi-user or enterprise licenses for cost-effective access to the report.
13. Are there any additional resources or data provided in the Mobile Game Controller report?
While the report offers comprehensive insights, it's advisable to review the specific contents or supplementary materials provided to ascertain if additional resources or data are available.
14. How can I stay updated on further developments or reports in the Mobile Game Controller?
To stay informed about further developments, trends, and reports in the Mobile Game Controller, consider subscribing to industry newsletters, following relevant companies and organizations, or regularly checking reputable industry news sources and publications.
Methodology
Step 1 - Identification of Relevant Samples Size from Population Database


Step 2 - Approaches for Defining Global Market Size (Value, Volume* & Price*)

Note*: In applicable scenarios
Step 3 - Data Sources
Primary Research
- Web Analytics
- Survey Reports
- Research Institute
- Latest Research Reports
- Opinion Leaders
Secondary Research
- Annual Reports
- White Paper
- Latest Press Release
- Industry Association
- Paid Database
- Investor Presentations

Step 4 - Data Triangulation
Involves using different sources of information in order to increase the validity of a study
These sources are likely to be stakeholders in a program - participants, other researchers, program staff, other community members, and so on.
Then we put all data in single framework & apply various statistical tools to find out the dynamic on the market.
During the analysis stage, feedback from the stakeholder groups would be compared to determine areas of agreement as well as areas of divergence