

Key Insights
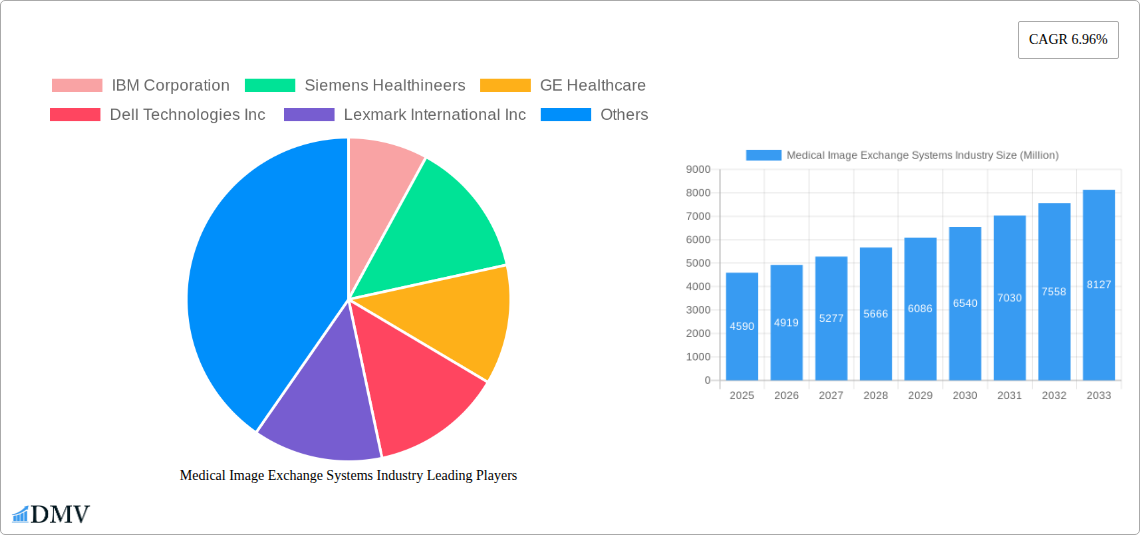
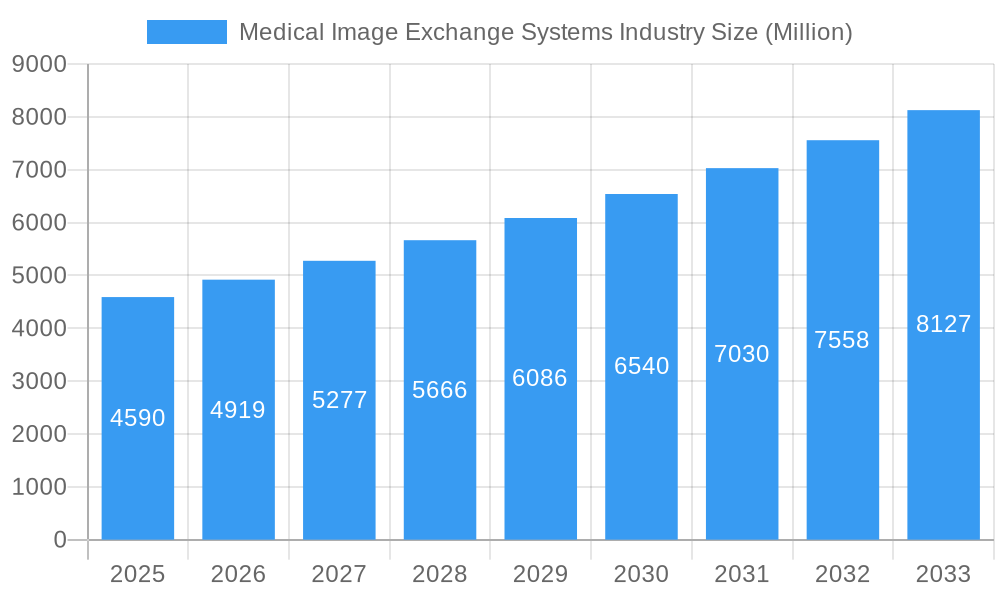
The Medical Image Exchange Systems (MIES) market, valued at $4.59 billion in 2025, is projected to experience robust growth, driven by the increasing volume of medical images generated, the rising adoption of telehealth and remote patient monitoring, and the growing need for efficient and secure image sharing across healthcare settings. The market's Compound Annual Growth Rate (CAGR) of 6.96% from 2025 to 2033 indicates a significant expansion, primarily fueled by technological advancements in PACS (Picture Archiving and Communication Systems) and Vendor Neutral Archives (VNA). Hospitals and diagnostic centers remain the largest end-users, but the adoption of MIES is expanding rapidly within ambulatory surgery centers due to improved workflow efficiency and reduced administrative burden. The integration of artificial intelligence (AI) for image analysis and improved interoperability standards are key trends shaping the market landscape. However, high initial investment costs associated with implementing MIES and the need for robust cybersecurity measures to protect sensitive patient data present challenges for market growth. Competition among established players such as IBM, Siemens Healthineers, and GE Healthcare, alongside smaller, specialized vendors, is fierce, leading to continuous innovation and competitive pricing strategies.
Medical Image Exchange Systems Industry Market Size (In Billion)
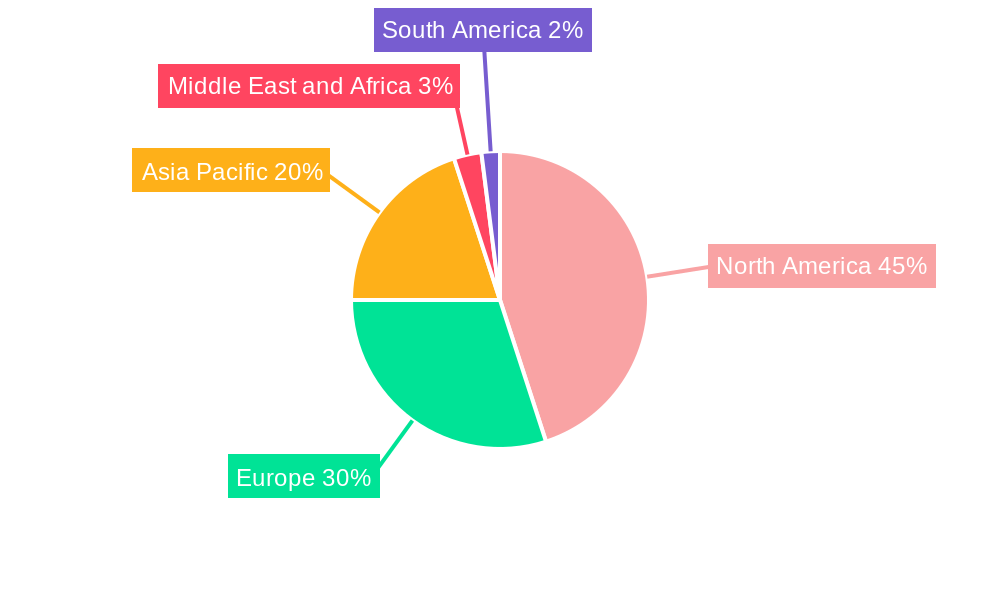
The North American market currently holds a dominant share due to high healthcare spending and advanced technological infrastructure. However, the Asia-Pacific region, particularly China and India, is expected to witness significant growth over the forecast period, driven by increasing healthcare investments and rising demand for improved healthcare services. Europe's market is also expected to grow steadily, influenced by factors like aging populations and growing adoption of advanced medical imaging techniques. The diverse range of system types – including PACS, VNA, and other specialized systems – caters to the varied needs of healthcare providers. Future market expansion will depend on overcoming the challenges related to data security and interoperability, as well as addressing the need for continuous technological upgrades to maintain system performance and functionality.
Medical Image Exchange Systems Industry Company Market Share
Medical Image Exchange Systems Industry: A Comprehensive Market Report (2019-2033)
This insightful report provides a comprehensive analysis of the Medical Image Exchange Systems market, projecting a market value of $XX Million by 2033. It delves into market dynamics, technological advancements, key players, and future growth opportunities, offering invaluable insights for stakeholders across the healthcare IT sector. The study period covers 2019-2033, with 2025 serving as the base and estimated year. The historical period analyzed is 2019-2024, and the forecast period extends from 2025-2033.
Medical Image Exchange Systems Industry Market Composition & Trends
This section analyzes the competitive landscape, innovation drivers, regulatory influences, and market activities within the Medical Image Exchange Systems industry. The market is moderately concentrated, with key players like IBM Corporation, Siemens Healthineers, and GE Healthcare holding significant market share. However, smaller, specialized vendors are also contributing to market growth through innovation. The market share distribution in 2024 is estimated as follows: IBM Corporation (15%), Siemens Healthineers (12%), GE Healthcare (10%), and others (63%). M&A activity has been moderate, with total deal values exceeding $XX Million in the past five years. Key drivers include increasing demand for efficient image management, rising adoption of cloud-based solutions, and stringent regulatory compliance requirements. Substitute products, such as manual image handling, are gradually being replaced due to efficiency gains offered by automated systems. The end-user segments – Hospitals, Diagnostic Centers, and Ambulatory Surgery Centers – are all experiencing robust growth, driven by increased patient volumes and the need for improved diagnostic capabilities.
- Market Concentration: Moderately concentrated, with major players holding significant but not dominant shares.
- Innovation Catalysts: Cloud computing, AI, and improved interoperability standards.
- Regulatory Landscape: Stringent data privacy and security regulations influencing product development and adoption.
- Substitute Products: Manual image handling, gradually being phased out due to inefficiency.
- End-User Profiles: Hospitals, Diagnostic Centers, and Ambulatory Surgery Centers are key drivers of demand.
- M&A Activity: Moderate activity with total deal values exceeding $XX Million (2019-2024).
Medical Image Exchange Systems Industry Industry Evolution
The Medical Image Exchange Systems market has experienced significant growth over the past few years, fueled by technological advancements and evolving healthcare needs. From 2019 to 2024, the market exhibited a Compound Annual Growth Rate (CAGR) of XX%, reaching $XX Million in 2024. This growth is driven by a rise in the volume of medical images generated, coupled with the increasing demand for efficient image management, storage, and retrieval. Technological advancements like cloud computing, AI-powered image analysis, and improved interoperability standards have significantly impacted market growth. The shift toward vendor-neutral archives (VNAs) and the growing adoption of Picture Archiving and Communication Systems (PACS) are key contributors to this evolution. Consumer demand is shifting towards seamless integration of medical imaging data across different healthcare systems, improving diagnostic accuracy and enhancing patient care. Furthermore, advancements in telemedicine are driving the need for efficient and reliable medical image exchange systems. The forecast period (2025-2033) projects continued robust growth, with a CAGR of XX%, leading to a market valuation of $XX Million by 2033. This projection is based on factors such as increasing healthcare expenditure, technological innovations, and expanding adoption in emerging markets.
Leading Regions, Countries, or Segments in Medical Image Exchange Systems Industry
North America currently dominates the Medical Image Exchange Systems market, driven by high healthcare expenditure, advanced infrastructure, and early adoption of new technologies. The strong presence of major industry players in the region also plays a significant role. Within the end-user segment, hospitals represent the largest portion of the market due to their high volume of medical imaging procedures and need for sophisticated image management systems. In terms of system types, Picture Archiving and Communication Systems (PACS) currently hold the largest market share, followed by Vendor Neutral Archives (VNAs). However, the "Other Systems" segment is predicted to witness significant growth in the forecast period due to the integration of advanced functionalities such as AI-powered image analysis and cloud-based solutions.
- Key Drivers in North America: High healthcare expenditure, advanced infrastructure, strong presence of major players.
- Hospitals (End-User): Largest market share due to high volume of medical imaging procedures.
- PACS (System): Current dominant system type, due to established infrastructure and wide adoption.
- Growth in "Other Systems": Integration of advanced functionalities (AI, cloud) driving future growth.
Medical Image Exchange Systems Industry Product Innovations
Recent product innovations in the Medical Image Exchange Systems industry center on enhancing interoperability, integrating advanced analytics capabilities, and leveraging cloud technologies. Many vendors now offer solutions with seamless integration across different healthcare systems, enabling efficient data sharing and collaboration. AI-powered image analysis tools are becoming increasingly integrated into these systems, enabling faster and more accurate diagnoses. Cloud-based solutions are also gaining popularity due to their scalability, cost-effectiveness, and accessibility. These advancements are leading to improved workflow efficiencies and enhanced patient care.
Propelling Factors for Medical Image Exchange Systems Industry Growth
Several factors are driving growth in the Medical Image Exchange Systems market. Technological advancements, such as AI-powered image analysis and cloud-based solutions, are significantly improving efficiency and accuracy. Increasing government investments in healthcare infrastructure, coupled with rising healthcare expenditure, are fueling demand. Stricter regulatory compliance requirements necessitate robust image management systems, driving adoption. Finally, the rising prevalence of chronic diseases and the increasing demand for advanced diagnostic tools contribute to market growth.
Obstacles in the Medical Image Exchange Systems Industry Market
The market faces challenges, including high initial investment costs for advanced systems, potential security and privacy concerns associated with cloud-based solutions, and integration complexities between different systems. Supply chain disruptions, particularly concerning specialized hardware components, can also impact market growth. Furthermore, intense competition from established players and emerging vendors creates pressure on pricing and profitability. These factors represent potential barriers to market expansion.
Future Opportunities in Medical Image Exchange Systems Industry
Future opportunities lie in expanding into emerging markets with growing healthcare infrastructure, incorporating advanced AI and machine learning capabilities for automated image analysis, developing more secure and interoperable cloud-based solutions, and exploring new applications like telehealth and remote patient monitoring. Focusing on user-friendly interfaces and intuitive design will also enhance adoption.
Major Players in the Medical Image Exchange Systems Industry Ecosystem
- IBM Corporation
- Siemens Healthineers
- GE Healthcare
- Dell Technologies Inc
- Lexmark International Inc
- BridgeHead Software
- Koninklijke Philips NV
- Carestream Health Inc (Onex Corporation)
- McKesson Corporation
- Novarad Corporation
- Agfa-Gevaert Group
- Fujifilm Holdings Corporation
Key Developments in Medical Image Exchange Systems Industry Industry
March 2022: Intelerad Medical Systems launched its new Enterprise Imaging and Informatics Suite, enhancing data integration across the healthcare ecosystem. This launch signifies a significant step towards improving interoperability and data accessibility within the healthcare industry.
March 2022: Philips introduced cloud-enabled enterprise imaging informatics and analytics solutions, signifying a shift toward cloud-based solutions and improved data analytics within the industry. This development caters to the growing demand for scalable and efficient image management solutions.
Strategic Medical Image Exchange Systems Industry Market Forecast
The Medical Image Exchange Systems market is poised for continued robust growth, driven by technological innovation, increasing healthcare expenditure, and the rising adoption of cloud-based solutions. The market is expected to witness significant expansion in emerging markets and within niche applications, including AI-powered diagnostics. The forecast indicates considerable market potential, with significant opportunities for players who can effectively address the evolving needs of healthcare providers and patients.
Medical Image Exchange Systems Industry Segmentation
-
1. System
- 1.1. Vendor Neutral Archive
- 1.2. Picture Archiving and Communications System (PACS)
- 1.3. Other Systems
-
2. End-User
- 2.1. Hospitals
- 2.2. Diagnostic Centers
- 2.3. Ambulatory Surgery Centers
Medical Image Exchange Systems Industry Segmentation By Geography
-
1. North America
- 1.1. United States
- 1.2. Canada
- 1.3. Mexico
-
2. Europe
- 2.1. Germany
- 2.2. United Kingdom
- 2.3. France
- 2.4. Italy
- 2.5. Spain
- 2.6. Rest of Europe
-
3. Asia Pacific
- 3.1. China
- 3.2. Japan
- 3.3. India
- 3.4. Australia
- 3.5. South Korea
- 3.6. Rest of Asia Pacific
-
4. Middle East and Africa
- 4.1. GCC
- 4.2. South Africa
- 4.3. Rest of Middle East and Africa
-
5. South America
- 5.1. Brazil
- 5.2. Argentina
- 5.3. Rest of South America
Medical Image Exchange Systems Industry Regional Market Share
Geographic Coverage of Medical Image Exchange Systems Industry
Medical Image Exchange Systems Industry REPORT HIGHLIGHTS
| Aspects | Details |
|---|---|
| Study Period | 2020-2034 |
| Base Year | 2025 |
| Estimated Year | 2026 |
| Forecast Period | 2026-2034 |
| Historical Period | 2020-2025 |
| Growth Rate | CAGR of 6.96% from 2020-2034 |
| Segmentation |
|
Table of Contents
- 1. Introduction
- 1.1. Research Scope
- 1.2. Market Segmentation
- 1.3. Research Objective
- 1.4. Definitions and Assumptions
- 2. Executive Summary
- 2.1. Market Snapshot
- 3. Market Dynamics
- 3.1. Market Drivers
- 3.2. Market Restrains
- 3.3. Market Trends
- 3.4. Market Opportunities
- 4. Market Factor Analysis
- 4.1. Porters Five Forces
- 4.1.1. Bargaining Power of Suppliers
- 4.1.2. Bargaining Power of Buyers
- 4.1.3. Threat of New Entrants
- 4.1.4. Threat of Substitutes
- 4.1.5. Competitive Rivalry
- 4.2. PESTEL analysis
- 4.3. BCG Analysis
- 4.3.1. Stars (High Growth, High Market Share)
- 4.3.2. Cash Cows (Low Growth, High Market Share)
- 4.3.3. Question Mark (High Growth, Low Market Share)
- 4.3.4. Dogs (Low Growth, Low Market Share)
- 4.4. Ansoff Matrix Analysis
- 4.5. Supply Chain Analysis
- 4.6. Regulatory Landscape
- 4.7. Current Market Potential and Opportunity Assessment (TAM–SAM–SOM Framework)
- 4.8. DMV Analyst Note
- 4.1. Porters Five Forces
- 5. Market Analysis, Insights and Forecast 2021-2033
- 5.1. Market Analysis, Insights and Forecast - by System
- 5.1.1. Vendor Neutral Archive
- 5.1.2. Picture Archiving and Communications System (PACS)
- 5.1.3. Other Systems
- 5.2. Market Analysis, Insights and Forecast - by End-User
- 5.2.1. Hospitals
- 5.2.2. Diagnostic Centers
- 5.2.3. Ambulatory Surgery Centers
- 5.3. Market Analysis, Insights and Forecast - by Region
- 5.3.1. North America
- 5.3.2. Europe
- 5.3.3. Asia Pacific
- 5.3.4. Middle East and Africa
- 5.3.5. South America
- 5.1. Market Analysis, Insights and Forecast - by System
- 6. Global Medical Image Exchange Systems Industry Analysis, Insights and Forecast, 2021-2033
- 6.1. Market Analysis, Insights and Forecast - by System
- 6.1.1. Vendor Neutral Archive
- 6.1.2. Picture Archiving and Communications System (PACS)
- 6.1.3. Other Systems
- 6.2. Market Analysis, Insights and Forecast - by End-User
- 6.2.1. Hospitals
- 6.2.2. Diagnostic Centers
- 6.2.3. Ambulatory Surgery Centers
- 6.1. Market Analysis, Insights and Forecast - by System
- 7. North America Medical Image Exchange Systems Industry Analysis, Insights and Forecast, 2020-2032
- 7.1. Market Analysis, Insights and Forecast - by System
- 7.1.1. Vendor Neutral Archive
- 7.1.2. Picture Archiving and Communications System (PACS)
- 7.1.3. Other Systems
- 7.2. Market Analysis, Insights and Forecast - by End-User
- 7.2.1. Hospitals
- 7.2.2. Diagnostic Centers
- 7.2.3. Ambulatory Surgery Centers
- 7.1. Market Analysis, Insights and Forecast - by System
- 8. Europe Medical Image Exchange Systems Industry Analysis, Insights and Forecast, 2020-2032
- 8.1. Market Analysis, Insights and Forecast - by System
- 8.1.1. Vendor Neutral Archive
- 8.1.2. Picture Archiving and Communications System (PACS)
- 8.1.3. Other Systems
- 8.2. Market Analysis, Insights and Forecast - by End-User
- 8.2.1. Hospitals
- 8.2.2. Diagnostic Centers
- 8.2.3. Ambulatory Surgery Centers
- 8.1. Market Analysis, Insights and Forecast - by System
- 9. Asia Pacific Medical Image Exchange Systems Industry Analysis, Insights and Forecast, 2020-2032
- 9.1. Market Analysis, Insights and Forecast - by System
- 9.1.1. Vendor Neutral Archive
- 9.1.2. Picture Archiving and Communications System (PACS)
- 9.1.3. Other Systems
- 9.2. Market Analysis, Insights and Forecast - by End-User
- 9.2.1. Hospitals
- 9.2.2. Diagnostic Centers
- 9.2.3. Ambulatory Surgery Centers
- 9.1. Market Analysis, Insights and Forecast - by System
- 10. Middle East and Africa Medical Image Exchange Systems Industry Analysis, Insights and Forecast, 2020-2032
- 10.1. Market Analysis, Insights and Forecast - by System
- 10.1.1. Vendor Neutral Archive
- 10.1.2. Picture Archiving and Communications System (PACS)
- 10.1.3. Other Systems
- 10.2. Market Analysis, Insights and Forecast - by End-User
- 10.2.1. Hospitals
- 10.2.2. Diagnostic Centers
- 10.2.3. Ambulatory Surgery Centers
- 10.1. Market Analysis, Insights and Forecast - by System
- 11. South America Medical Image Exchange Systems Industry Analysis, Insights and Forecast, 2020-2032
- 11.1. Market Analysis, Insights and Forecast - by System
- 11.1.1. Vendor Neutral Archive
- 11.1.2. Picture Archiving and Communications System (PACS)
- 11.1.3. Other Systems
- 11.2. Market Analysis, Insights and Forecast - by End-User
- 11.2.1. Hospitals
- 11.2.2. Diagnostic Centers
- 11.2.3. Ambulatory Surgery Centers
- 11.1. Market Analysis, Insights and Forecast - by System
- 12. Competitive Analysis
- 12.1. Company Profiles
- 12.1.1 IBM Corporation
- 12.1.1.1. Company Overview
- 12.1.1.2. Products
- 12.1.1.3. Company Financials
- 12.1.1.4. SWOT Analysis
- 12.1.2 Siemens Healthineers
- 12.1.2.1. Company Overview
- 12.1.2.2. Products
- 12.1.2.3. Company Financials
- 12.1.2.4. SWOT Analysis
- 12.1.3 GE Healthcare
- 12.1.3.1. Company Overview
- 12.1.3.2. Products
- 12.1.3.3. Company Financials
- 12.1.3.4. SWOT Analysis
- 12.1.4 Dell Technologies Inc
- 12.1.4.1. Company Overview
- 12.1.4.2. Products
- 12.1.4.3. Company Financials
- 12.1.4.4. SWOT Analysis
- 12.1.5 Lexmark International Inc
- 12.1.5.1. Company Overview
- 12.1.5.2. Products
- 12.1.5.3. Company Financials
- 12.1.5.4. SWOT Analysis
- 12.1.6 BridgeHead Software
- 12.1.6.1. Company Overview
- 12.1.6.2. Products
- 12.1.6.3. Company Financials
- 12.1.6.4. SWOT Analysis
- 12.1.7 Koninklijke Philips NV
- 12.1.7.1. Company Overview
- 12.1.7.2. Products
- 12.1.7.3. Company Financials
- 12.1.7.4. SWOT Analysis
- 12.1.8 Carestream Health Inc (Onex Corporation)
- 12.1.8.1. Company Overview
- 12.1.8.2. Products
- 12.1.8.3. Company Financials
- 12.1.8.4. SWOT Analysis
- 12.1.9 McKesson Corporation
- 12.1.9.1. Company Overview
- 12.1.9.2. Products
- 12.1.9.3. Company Financials
- 12.1.9.4. SWOT Analysis
- 12.1.10 Novarad Corporation
- 12.1.10.1. Company Overview
- 12.1.10.2. Products
- 12.1.10.3. Company Financials
- 12.1.10.4. SWOT Analysis
- 12.1.11 Agfa-Gevaert Group
- 12.1.11.1. Company Overview
- 12.1.11.2. Products
- 12.1.11.3. Company Financials
- 12.1.11.4. SWOT Analysis
- 12.1.12 Fujifilm Holdings Corporation
- 12.1.12.1. Company Overview
- 12.1.12.2. Products
- 12.1.12.3. Company Financials
- 12.1.12.4. SWOT Analysis
- 12.1.1 IBM Corporation
- 12.2. Market Entropy
- 12.2.1 Company's Key Areas Served
- 12.2.2 Recent Developments
- 12.3. Company Market Share Analysis 2025
- 12.3.1 Top 5 Companies Market Share Analysis
- 12.3.2 Top 3 Companies Market Share Analysis
- 12.4. List of Potential Customers
- 13. Research Methodology
List of Figures
- Figure 1: Global Medical Image Exchange Systems Industry Revenue Breakdown (Million, %) by Region 2025 & 2033
- Figure 2: Global Medical Image Exchange Systems Industry Volume Breakdown (K Unit, %) by Region 2025 & 2033
- Figure 3: North America Medical Image Exchange Systems Industry Revenue (Million), by System 2025 & 2033
- Figure 4: North America Medical Image Exchange Systems Industry Volume (K Unit), by System 2025 & 2033
- Figure 5: North America Medical Image Exchange Systems Industry Revenue Share (%), by System 2025 & 2033
- Figure 6: North America Medical Image Exchange Systems Industry Volume Share (%), by System 2025 & 2033
- Figure 7: North America Medical Image Exchange Systems Industry Revenue (Million), by End-User 2025 & 2033
- Figure 8: North America Medical Image Exchange Systems Industry Volume (K Unit), by End-User 2025 & 2033
- Figure 9: North America Medical Image Exchange Systems Industry Revenue Share (%), by End-User 2025 & 2033
- Figure 10: North America Medical Image Exchange Systems Industry Volume Share (%), by End-User 2025 & 2033
- Figure 11: North America Medical Image Exchange Systems Industry Revenue (Million), by Country 2025 & 2033
- Figure 12: North America Medical Image Exchange Systems Industry Volume (K Unit), by Country 2025 & 2033
- Figure 13: North America Medical Image Exchange Systems Industry Revenue Share (%), by Country 2025 & 2033
- Figure 14: North America Medical Image Exchange Systems Industry Volume Share (%), by Country 2025 & 2033
- Figure 15: Europe Medical Image Exchange Systems Industry Revenue (Million), by System 2025 & 2033
- Figure 16: Europe Medical Image Exchange Systems Industry Volume (K Unit), by System 2025 & 2033
- Figure 17: Europe Medical Image Exchange Systems Industry Revenue Share (%), by System 2025 & 2033
- Figure 18: Europe Medical Image Exchange Systems Industry Volume Share (%), by System 2025 & 2033
- Figure 19: Europe Medical Image Exchange Systems Industry Revenue (Million), by End-User 2025 & 2033
- Figure 20: Europe Medical Image Exchange Systems Industry Volume (K Unit), by End-User 2025 & 2033
- Figure 21: Europe Medical Image Exchange Systems Industry Revenue Share (%), by End-User 2025 & 2033
- Figure 22: Europe Medical Image Exchange Systems Industry Volume Share (%), by End-User 2025 & 2033
- Figure 23: Europe Medical Image Exchange Systems Industry Revenue (Million), by Country 2025 & 2033
- Figure 24: Europe Medical Image Exchange Systems Industry Volume (K Unit), by Country 2025 & 2033
- Figure 25: Europe Medical Image Exchange Systems Industry Revenue Share (%), by Country 2025 & 2033
- Figure 26: Europe Medical Image Exchange Systems Industry Volume Share (%), by Country 2025 & 2033
- Figure 27: Asia Pacific Medical Image Exchange Systems Industry Revenue (Million), by System 2025 & 2033
- Figure 28: Asia Pacific Medical Image Exchange Systems Industry Volume (K Unit), by System 2025 & 2033
- Figure 29: Asia Pacific Medical Image Exchange Systems Industry Revenue Share (%), by System 2025 & 2033
- Figure 30: Asia Pacific Medical Image Exchange Systems Industry Volume Share (%), by System 2025 & 2033
- Figure 31: Asia Pacific Medical Image Exchange Systems Industry Revenue (Million), by End-User 2025 & 2033
- Figure 32: Asia Pacific Medical Image Exchange Systems Industry Volume (K Unit), by End-User 2025 & 2033
- Figure 33: Asia Pacific Medical Image Exchange Systems Industry Revenue Share (%), by End-User 2025 & 2033
- Figure 34: Asia Pacific Medical Image Exchange Systems Industry Volume Share (%), by End-User 2025 & 2033
- Figure 35: Asia Pacific Medical Image Exchange Systems Industry Revenue (Million), by Country 2025 & 2033
- Figure 36: Asia Pacific Medical Image Exchange Systems Industry Volume (K Unit), by Country 2025 & 2033
- Figure 37: Asia Pacific Medical Image Exchange Systems Industry Revenue Share (%), by Country 2025 & 2033
- Figure 38: Asia Pacific Medical Image Exchange Systems Industry Volume Share (%), by Country 2025 & 2033
- Figure 39: Middle East and Africa Medical Image Exchange Systems Industry Revenue (Million), by System 2025 & 2033
- Figure 40: Middle East and Africa Medical Image Exchange Systems Industry Volume (K Unit), by System 2025 & 2033
- Figure 41: Middle East and Africa Medical Image Exchange Systems Industry Revenue Share (%), by System 2025 & 2033
- Figure 42: Middle East and Africa Medical Image Exchange Systems Industry Volume Share (%), by System 2025 & 2033
- Figure 43: Middle East and Africa Medical Image Exchange Systems Industry Revenue (Million), by End-User 2025 & 2033
- Figure 44: Middle East and Africa Medical Image Exchange Systems Industry Volume (K Unit), by End-User 2025 & 2033
- Figure 45: Middle East and Africa Medical Image Exchange Systems Industry Revenue Share (%), by End-User 2025 & 2033
- Figure 46: Middle East and Africa Medical Image Exchange Systems Industry Volume Share (%), by End-User 2025 & 2033
- Figure 47: Middle East and Africa Medical Image Exchange Systems Industry Revenue (Million), by Country 2025 & 2033
- Figure 48: Middle East and Africa Medical Image Exchange Systems Industry Volume (K Unit), by Country 2025 & 2033
- Figure 49: Middle East and Africa Medical Image Exchange Systems Industry Revenue Share (%), by Country 2025 & 2033
- Figure 50: Middle East and Africa Medical Image Exchange Systems Industry Volume Share (%), by Country 2025 & 2033
- Figure 51: South America Medical Image Exchange Systems Industry Revenue (Million), by System 2025 & 2033
- Figure 52: South America Medical Image Exchange Systems Industry Volume (K Unit), by System 2025 & 2033
- Figure 53: South America Medical Image Exchange Systems Industry Revenue Share (%), by System 2025 & 2033
- Figure 54: South America Medical Image Exchange Systems Industry Volume Share (%), by System 2025 & 2033
- Figure 55: South America Medical Image Exchange Systems Industry Revenue (Million), by End-User 2025 & 2033
- Figure 56: South America Medical Image Exchange Systems Industry Volume (K Unit), by End-User 2025 & 2033
- Figure 57: South America Medical Image Exchange Systems Industry Revenue Share (%), by End-User 2025 & 2033
- Figure 58: South America Medical Image Exchange Systems Industry Volume Share (%), by End-User 2025 & 2033
- Figure 59: South America Medical Image Exchange Systems Industry Revenue (Million), by Country 2025 & 2033
- Figure 60: South America Medical Image Exchange Systems Industry Volume (K Unit), by Country 2025 & 2033
- Figure 61: South America Medical Image Exchange Systems Industry Revenue Share (%), by Country 2025 & 2033
- Figure 62: South America Medical Image Exchange Systems Industry Volume Share (%), by Country 2025 & 2033
List of Tables
- Table 1: Global Medical Image Exchange Systems Industry Revenue Million Forecast, by System 2020 & 2033
- Table 2: Global Medical Image Exchange Systems Industry Volume K Unit Forecast, by System 2020 & 2033
- Table 3: Global Medical Image Exchange Systems Industry Revenue Million Forecast, by End-User 2020 & 2033
- Table 4: Global Medical Image Exchange Systems Industry Volume K Unit Forecast, by End-User 2020 & 2033
- Table 5: Global Medical Image Exchange Systems Industry Revenue Million Forecast, by Region 2020 & 2033
- Table 6: Global Medical Image Exchange Systems Industry Volume K Unit Forecast, by Region 2020 & 2033
- Table 7: Global Medical Image Exchange Systems Industry Revenue Million Forecast, by System 2020 & 2033
- Table 8: Global Medical Image Exchange Systems Industry Volume K Unit Forecast, by System 2020 & 2033
- Table 9: Global Medical Image Exchange Systems Industry Revenue Million Forecast, by End-User 2020 & 2033
- Table 10: Global Medical Image Exchange Systems Industry Volume K Unit Forecast, by End-User 2020 & 2033
- Table 11: Global Medical Image Exchange Systems Industry Revenue Million Forecast, by Country 2020 & 2033
- Table 12: Global Medical Image Exchange Systems Industry Volume K Unit Forecast, by Country 2020 & 2033
- Table 13: United States Medical Image Exchange Systems Industry Revenue (Million) Forecast, by Application 2020 & 2033
- Table 14: United States Medical Image Exchange Systems Industry Volume (K Unit) Forecast, by Application 2020 & 2033
- Table 15: Canada Medical Image Exchange Systems Industry Revenue (Million) Forecast, by Application 2020 & 2033
- Table 16: Canada Medical Image Exchange Systems Industry Volume (K Unit) Forecast, by Application 2020 & 2033
- Table 17: Mexico Medical Image Exchange Systems Industry Revenue (Million) Forecast, by Application 2020 & 2033
- Table 18: Mexico Medical Image Exchange Systems Industry Volume (K Unit) Forecast, by Application 2020 & 2033
- Table 19: Global Medical Image Exchange Systems Industry Revenue Million Forecast, by System 2020 & 2033
- Table 20: Global Medical Image Exchange Systems Industry Volume K Unit Forecast, by System 2020 & 2033
- Table 21: Global Medical Image Exchange Systems Industry Revenue Million Forecast, by End-User 2020 & 2033
- Table 22: Global Medical Image Exchange Systems Industry Volume K Unit Forecast, by End-User 2020 & 2033
- Table 23: Global Medical Image Exchange Systems Industry Revenue Million Forecast, by Country 2020 & 2033
- Table 24: Global Medical Image Exchange Systems Industry Volume K Unit Forecast, by Country 2020 & 2033
- Table 25: Germany Medical Image Exchange Systems Industry Revenue (Million) Forecast, by Application 2020 & 2033
- Table 26: Germany Medical Image Exchange Systems Industry Volume (K Unit) Forecast, by Application 2020 & 2033
- Table 27: United Kingdom Medical Image Exchange Systems Industry Revenue (Million) Forecast, by Application 2020 & 2033
- Table 28: United Kingdom Medical Image Exchange Systems Industry Volume (K Unit) Forecast, by Application 2020 & 2033
- Table 29: France Medical Image Exchange Systems Industry Revenue (Million) Forecast, by Application 2020 & 2033
- Table 30: France Medical Image Exchange Systems Industry Volume (K Unit) Forecast, by Application 2020 & 2033
- Table 31: Italy Medical Image Exchange Systems Industry Revenue (Million) Forecast, by Application 2020 & 2033
- Table 32: Italy Medical Image Exchange Systems Industry Volume (K Unit) Forecast, by Application 2020 & 2033
- Table 33: Spain Medical Image Exchange Systems Industry Revenue (Million) Forecast, by Application 2020 & 2033
- Table 34: Spain Medical Image Exchange Systems Industry Volume (K Unit) Forecast, by Application 2020 & 2033
- Table 35: Rest of Europe Medical Image Exchange Systems Industry Revenue (Million) Forecast, by Application 2020 & 2033
- Table 36: Rest of Europe Medical Image Exchange Systems Industry Volume (K Unit) Forecast, by Application 2020 & 2033
- Table 37: Global Medical Image Exchange Systems Industry Revenue Million Forecast, by System 2020 & 2033
- Table 38: Global Medical Image Exchange Systems Industry Volume K Unit Forecast, by System 2020 & 2033
- Table 39: Global Medical Image Exchange Systems Industry Revenue Million Forecast, by End-User 2020 & 2033
- Table 40: Global Medical Image Exchange Systems Industry Volume K Unit Forecast, by End-User 2020 & 2033
- Table 41: Global Medical Image Exchange Systems Industry Revenue Million Forecast, by Country 2020 & 2033
- Table 42: Global Medical Image Exchange Systems Industry Volume K Unit Forecast, by Country 2020 & 2033
- Table 43: China Medical Image Exchange Systems Industry Revenue (Million) Forecast, by Application 2020 & 2033
- Table 44: China Medical Image Exchange Systems Industry Volume (K Unit) Forecast, by Application 2020 & 2033
- Table 45: Japan Medical Image Exchange Systems Industry Revenue (Million) Forecast, by Application 2020 & 2033
- Table 46: Japan Medical Image Exchange Systems Industry Volume (K Unit) Forecast, by Application 2020 & 2033
- Table 47: India Medical Image Exchange Systems Industry Revenue (Million) Forecast, by Application 2020 & 2033
- Table 48: India Medical Image Exchange Systems Industry Volume (K Unit) Forecast, by Application 2020 & 2033
- Table 49: Australia Medical Image Exchange Systems Industry Revenue (Million) Forecast, by Application 2020 & 2033
- Table 50: Australia Medical Image Exchange Systems Industry Volume (K Unit) Forecast, by Application 2020 & 2033
- Table 51: South Korea Medical Image Exchange Systems Industry Revenue (Million) Forecast, by Application 2020 & 2033
- Table 52: South Korea Medical Image Exchange Systems Industry Volume (K Unit) Forecast, by Application 2020 & 2033
- Table 53: Rest of Asia Pacific Medical Image Exchange Systems Industry Revenue (Million) Forecast, by Application 2020 & 2033
- Table 54: Rest of Asia Pacific Medical Image Exchange Systems Industry Volume (K Unit) Forecast, by Application 2020 & 2033
- Table 55: Global Medical Image Exchange Systems Industry Revenue Million Forecast, by System 2020 & 2033
- Table 56: Global Medical Image Exchange Systems Industry Volume K Unit Forecast, by System 2020 & 2033
- Table 57: Global Medical Image Exchange Systems Industry Revenue Million Forecast, by End-User 2020 & 2033
- Table 58: Global Medical Image Exchange Systems Industry Volume K Unit Forecast, by End-User 2020 & 2033
- Table 59: Global Medical Image Exchange Systems Industry Revenue Million Forecast, by Country 2020 & 2033
- Table 60: Global Medical Image Exchange Systems Industry Volume K Unit Forecast, by Country 2020 & 2033
- Table 61: GCC Medical Image Exchange Systems Industry Revenue (Million) Forecast, by Application 2020 & 2033
- Table 62: GCC Medical Image Exchange Systems Industry Volume (K Unit) Forecast, by Application 2020 & 2033
- Table 63: South Africa Medical Image Exchange Systems Industry Revenue (Million) Forecast, by Application 2020 & 2033
- Table 64: South Africa Medical Image Exchange Systems Industry Volume (K Unit) Forecast, by Application 2020 & 2033
- Table 65: Rest of Middle East and Africa Medical Image Exchange Systems Industry Revenue (Million) Forecast, by Application 2020 & 2033
- Table 66: Rest of Middle East and Africa Medical Image Exchange Systems Industry Volume (K Unit) Forecast, by Application 2020 & 2033
- Table 67: Global Medical Image Exchange Systems Industry Revenue Million Forecast, by System 2020 & 2033
- Table 68: Global Medical Image Exchange Systems Industry Volume K Unit Forecast, by System 2020 & 2033
- Table 69: Global Medical Image Exchange Systems Industry Revenue Million Forecast, by End-User 2020 & 2033
- Table 70: Global Medical Image Exchange Systems Industry Volume K Unit Forecast, by End-User 2020 & 2033
- Table 71: Global Medical Image Exchange Systems Industry Revenue Million Forecast, by Country 2020 & 2033
- Table 72: Global Medical Image Exchange Systems Industry Volume K Unit Forecast, by Country 2020 & 2033
- Table 73: Brazil Medical Image Exchange Systems Industry Revenue (Million) Forecast, by Application 2020 & 2033
- Table 74: Brazil Medical Image Exchange Systems Industry Volume (K Unit) Forecast, by Application 2020 & 2033
- Table 75: Argentina Medical Image Exchange Systems Industry Revenue (Million) Forecast, by Application 2020 & 2033
- Table 76: Argentina Medical Image Exchange Systems Industry Volume (K Unit) Forecast, by Application 2020 & 2033
- Table 77: Rest of South America Medical Image Exchange Systems Industry Revenue (Million) Forecast, by Application 2020 & 2033
- Table 78: Rest of South America Medical Image Exchange Systems Industry Volume (K Unit) Forecast, by Application 2020 & 2033
Frequently Asked Questions
1. What is the projected Compound Annual Growth Rate (CAGR) of the Medical Image Exchange Systems Industry?
The projected CAGR is approximately 6.96%.
2. Which companies are prominent players in the Medical Image Exchange Systems Industry?
Key companies in the market include IBM Corporation, Siemens Healthineers, GE Healthcare, Dell Technologies Inc , Lexmark International Inc, BridgeHead Software, Koninklijke Philips NV, Carestream Health Inc (Onex Corporation), McKesson Corporation, Novarad Corporation, Agfa-Gevaert Group, Fujifilm Holdings Corporation.
3. What are the main segments of the Medical Image Exchange Systems Industry?
The market segments include System, End-User.
4. Can you provide details about the market size?
The market size is estimated to be USD 4.59 Million as of 2022.
5. What are some drivers contributing to market growth?
Technological Innovations in the Diagnostic Imaging and Image Management; Rising Prevalence of Chronic Diseases; Emergence of Big Data in Healthcare.
6. What are the notable trends driving market growth?
Picture Archiving and Communications Systems (PACS) is Expected to Record Notable CAGR in the Market During the Forecast Period.
7. Are there any restraints impacting market growth?
Cost Associated With Implementation of Medical Imaging Management Solutions; Decrease In the Supply of SPECT and PET Systems due to the Shortage of Radioisotopes.
8. Can you provide examples of recent developments in the market?
March 2022: Intelerad Medical Systems launched its new Enterprise Imaging and Informatics Suite at the 2022 HIMSS Global Health Conference & Exhibition. Intelerad's suite empowers hospitals and health systems to break down siloed data and create a seamless, vendor-neutral information hub, integrating vital patient data across the entire healthcare ecosystem.
9. What pricing options are available for accessing the report?
Pricing options include single-user, multi-user, and enterprise licenses priced at USD 4750, USD 5250, and USD 8750 respectively.
10. Is the market size provided in terms of value or volume?
The market size is provided in terms of value, measured in Million and volume, measured in K Unit.
11. Are there any specific market keywords associated with the report?
Yes, the market keyword associated with the report is "Medical Image Exchange Systems Industry," which aids in identifying and referencing the specific market segment covered.
12. How do I determine which pricing option suits my needs best?
The pricing options vary based on user requirements and access needs. Individual users may opt for single-user licenses, while businesses requiring broader access may choose multi-user or enterprise licenses for cost-effective access to the report.
13. Are there any additional resources or data provided in the Medical Image Exchange Systems Industry report?
While the report offers comprehensive insights, it's advisable to review the specific contents or supplementary materials provided to ascertain if additional resources or data are available.
14. How can I stay updated on further developments or reports in the Medical Image Exchange Systems Industry?
To stay informed about further developments, trends, and reports in the Medical Image Exchange Systems Industry, consider subscribing to industry newsletters, following relevant companies and organizations, or regularly checking reputable industry news sources and publications.
Methodology
Step 1 - Identification of Relevant Samples Size from Population Database


Step 2 - Approaches for Defining Global Market Size (Value, Volume* & Price*)

Note*: In applicable scenarios
Step 3 - Data Sources
Primary Research
- Web Analytics
- Survey Reports
- Research Institute
- Latest Research Reports
- Opinion Leaders
Secondary Research
- Annual Reports
- White Paper
- Latest Press Release
- Industry Association
- Paid Database
- Investor Presentations

Step 4 - Data Triangulation
Involves using different sources of information in order to increase the validity of a study
These sources are likely to be stakeholders in a program - participants, other researchers, program staff, other community members, and so on.
Then we put all data in single framework & apply various statistical tools to find out the dynamic on the market.
During the analysis stage, feedback from the stakeholder groups would be compared to determine areas of agreement as well as areas of divergence