

Key Insights
The global marine services industry is experiencing robust growth, driven by increasing global trade, expanding maritime infrastructure development, and a rising demand for efficient logistics solutions. A compound annual growth rate (CAGR) exceeding 5% from 2019 to 2033 signifies a significant expansion of this market, projected to reach a substantial value in the coming years. The industry's segmentation, encompassing container handling, ship repair and maintenance, supply chain management, engineering services, navigation, and logistics solutions, presents diverse growth opportunities. The rising adoption of advanced technologies like autonomous vessels and digitalization within port operations further fuels the market expansion. Key players, including International Container Terminal Services, DP World Limited, and AP Moller Maersk, are strategically investing in infrastructure upgrades and technological advancements to maintain their market competitiveness. Geographic expansion is also a significant factor, with regions like Asia-Pacific exhibiting strong growth potential due to its rapid economic development and expanding port infrastructure. However, factors like fluctuating fuel prices, geopolitical uncertainties, and environmental regulations pose challenges to consistent growth. The industry needs to navigate these complexities effectively to ensure sustained and sustainable development.
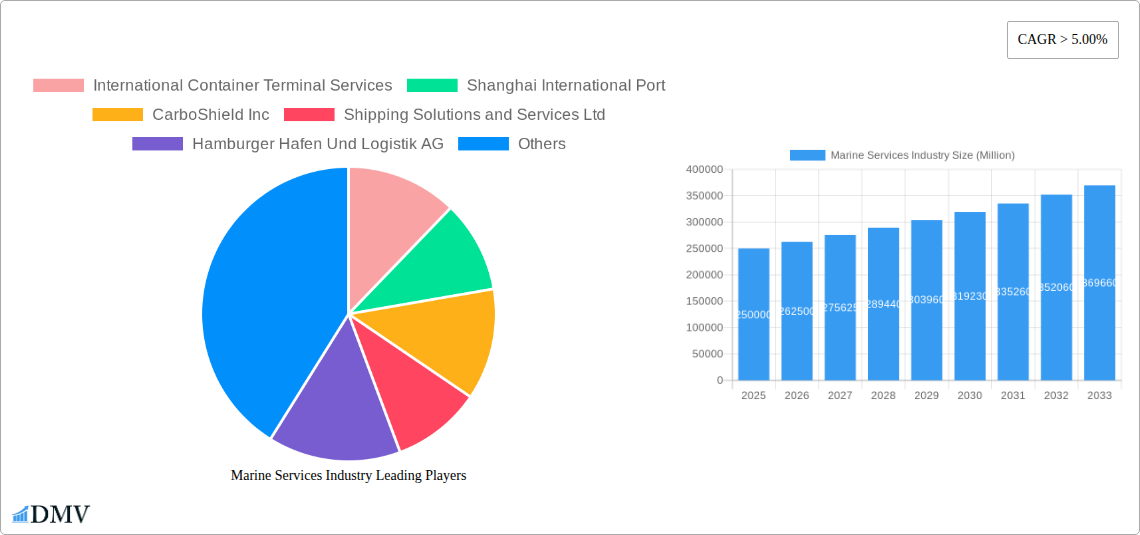
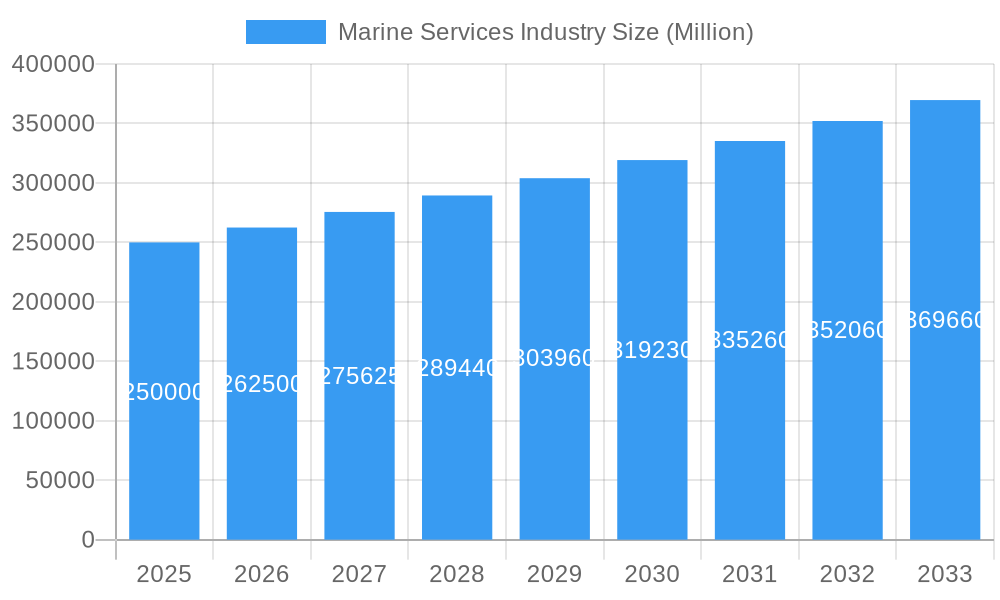
Marine Services Industry Market Size (In Billion)
The forecast period (2025-2033) anticipates significant growth, particularly in the Asia-Pacific region, given its robust economic expansion and increasing maritime trade. North America and Europe will also contribute substantially, although possibly at a slightly lower growth rate compared to Asia-Pacific. The ongoing technological advancements in areas like port automation and digital twin technology will continue to reshape the operational landscape of the marine services industry. Furthermore, the increasing emphasis on environmental sustainability and the adoption of greener technologies within the maritime sector will open new market avenues for environmentally conscious service providers. The competitive landscape, although characterized by established giants, is also seeing the emergence of innovative startups leveraging technology to disrupt traditional operations. This dynamic environment presents both challenges and considerable opportunities for growth and innovation.
Marine Services Industry Company Market Share
Marine Services Industry Market Report: 2019-2033
This comprehensive report provides an in-depth analysis of the global Marine Services Industry, projecting robust growth from USD xx Million in 2025 to USD xx Million by 2033. The study period covers 2019-2033, with 2025 serving as both the base and estimated year. This report is crucial for stakeholders seeking to navigate the complexities of this dynamic sector, offering actionable insights and strategic recommendations for maximizing returns.
Marine Services Industry Market Composition & Trends
The Marine Services Industry is characterized by a moderately concentrated market, with dominant players like DP World Limited, AP Moller Maersk, and International Container Terminal Services significantly influencing the landscape. However, a burgeoning trend highlights the rise of specialized, agile companies carving out niches in areas such as advanced protective coatings (e.g., CarboShield Inc) and cutting-edge maritime technology solutions (e.g., TomWorks LLC). The relentless pursuit of innovation is currently driven by several key forces: the widespread adoption of automation in container handling processes, the integration of digital technologies for enhanced logistics and seamless supply chain management, and a rapidly growing global imperative for sustainable and eco-friendly shipping practices. Navigating this dynamic environment necessitates adaptation to a continually evolving regulatory framework, where increasingly stringent environmental mandates and safety standards directly impact operational expenditures and strategic investment decisions. The industry is also experiencing robust merger and acquisition (M&A) activity, a clear indicator of ongoing consolidation and ambitious expansion strategies. Illustrative examples include DP World's substantial USD 133.33 Million investment in the Jeddah logistics park and Hutchison Ports' strategic acquisition of APM Terminals Rotterdam.
- Market Concentration: Moderately concentrated, with the top 5 players projected to command approximately 60-70% market share in 2025.
- Innovation Catalysts: Advanced automation, comprehensive digitalization, and proactive sustainability initiatives are the primary drivers of progress.
- M&A Activity: Significant M&A activity is prevalent, with annual deal values consistently exceeding USD 500 Million in recent years.
- Substitute Products/Services: While direct substitutes are limited, the industry faces increasing competition from alternative, land-based transportation modes.
- End-User Profiles: Key end-users encompass global shipping lines, port operators, comprehensive logistics companies, and various government agencies.
Marine Services Industry Industry Evolution
The Marine Services Industry has demonstrated robust and consistent growth throughout the historical period spanning from 2019 to 2024, largely propelled by the surge in global trade volumes and the concurrent expansion of vital port infrastructure worldwide. Technological breakthroughs, including the development of autonomous vessels, the application of AI for sophisticated route optimization, and the implementation of blockchain technology for transparent supply chain solutions, are fundamentally reshaping operational efficiencies and driving significant cost reductions. Concurrently, evolving consumer expectations for swifter, more dependable, and demonstrably sustainable shipping solutions continue to define the industry's forward trajectory. The projected forecast period, from 2025 to 2033, anticipates a Compound Annual Growth Rate (CAGR) of approximately 6-8%, underpinned by sustained digitalization efforts, intensified investments in the modernization of existing infrastructure, and the continuous expansion of e-commerce activities globally.
Leading Regions, Countries, or Segments in Marine Services Industry
The Asia-Pacific region dominates the Marine Services Industry, driven by rapid economic growth in countries like China and India, leading to increased port activity and logistics demand. Within service segments, Container Handling Services represents the largest revenue share, owing to its crucial role in global trade.
- Key Drivers for Asia-Pacific Dominance: High economic growth, massive infrastructure investments, and growing trade volumes.
- Container Handling Services: High volume throughput, robust infrastructure, and strategic port locations propel this segment.
- Ship Repair and Maintenance Services: High demand due to the aging fleet and stringent safety standards.
- Supply Chain Solutions: Increasing complexity and demand for efficient logistics drive growth in this area.
- Mechanical and Electrical Engineering Services: Demand is tied directly to shipbuilding, repair, and ongoing maintenance needs.
- Navigation Services: Essential for safe and efficient maritime operations, benefiting from increasing shipping traffic.
- Logistics Solutions: Demand driven by global supply chains and e-commerce growth.
Marine Services Industry Product Innovations
Recent groundbreaking innovations within the Marine Services Industry include the pioneering introduction of autonomous cargo vessels, the deployment of sophisticated port management systems powered by Artificial Intelligence and Machine Learning, and the concerted development of more environmentally responsible fuels and advanced maritime technologies. These innovations are instrumental in enhancing operational efficiency, bolstering safety standards, and promoting sustainability across the marine services sector, thereby offering compelling unique selling propositions that elevate service quality and concurrently reduce operational overheads. Tangible performance improvements, such as demonstrable reductions in fuel consumption, accelerated cargo handling speeds, and significantly enhanced safety records, serve as clear indicators of the profound impact these technological advancements are having on the industry.
Propelling Factors for Marine Services Industry Growth
Several factors are driving the growth of the Marine Services Industry. Technological advancements, such as automation and digitalization, are improving efficiency and reducing costs. Economic growth in emerging markets is leading to increased demand for shipping and logistics services. Finally, supportive government policies and investments in port infrastructure are bolstering capacity and efficiency.
Obstacles in the Marine Services Industry Market
The industry faces challenges including strict environmental regulations leading to increased compliance costs, disruptions to global supply chains impacting service delivery, and intense competition among established players and new entrants. These factors can constrain growth and profitability, necessitating strategic adaptation and operational resilience.
Future Opportunities in Marine Services Industry
The future landscape of the Marine Services Industry is ripe with opportunities, particularly in strategic market expansion into emerging economies, the effective leveraging of cutting-edge technologies like blockchain and the Internet of Things (IoT) to achieve unprecedented supply chain visibility and operational agility, and the dedicated catering to the escalating global demand for sustainable and environmentally conscious solutions within both the shipping and logistics domains. Exploring untapped market potential in the developing economies of Africa and South America presents a particularly promising avenue for substantial growth and market penetration.
Major Players in the Marine Services Industry Ecosystem
- International Container Terminal Services
- Shanghai International Port
- CarboShield Inc
- Shipping Solutions and Services Ltd
- Hamburger Hafen Und Logistik AG
- TomWorks LLC
- Montreal Port Authority
- DP World Limited
- Tianjin Port Development Holdings Ltd
- AP Moller Maersk
Key Developments in Marine Services Industry Industry
- June 2022: DP World and the Saudi Ports Authority collaboratively announced a significant USD 133.33 Million investment initiative aimed at establishing a state-of-the-art logistics park in Jeddah, Saudi Arabia.
- May 2021: Hutchison Ports successfully completed the acquisition of APM Terminals Rotterdam, reinforcing its strategic position in the European market.
- May 2021: Régie du Terminal à Conteneurs (RTC) placed an order for two advanced Gottwald Mobile Harbor Cranes from Konecranes, signaling an investment in enhanced port handling capabilities.
Strategic Marine Services Industry Market Forecast
The Marine Services Industry is poised for sustained growth, driven by technological advancements, increasing globalization, and robust infrastructure development. The anticipated growth trajectory presents significant opportunities for market entrants and established players alike, underscoring the need for strategic planning and adaptation to the dynamic market landscape.
Marine Services Industry Segmentation
-
1. Service Analysis
- 1.1. Container Handling Services
- 1.2. Ship repair and maintenance services
- 1.3. Supply Chain
- 1.4. Mechanical and Electrical Engineering Services
- 1.5. Navigation Services
- 1.6. Logistics Solutions
Marine Services Industry Segmentation By Geography
-
1. North America
- 1.1. US
- 1.2. Canada
- 1.3. Mexico
-
2. Europe
- 2.1. Germany
- 2.2. UK
- 2.3. France
- 2.4. Russia
- 2.5. Spain
- 2.6. Rest of Europe
-
3. Asia Pacific
- 3.1. India
- 3.2. China
- 3.3. Japan
- 3.4. Australia
- 3.5. Singapore
- 3.6. Malaysia
- 3.7. South Korea
- 3.8. Rest of Asia Pacific
-
4. South America
- 4.1. Brazil
- 4.2. Argentina
- 4.3. Rest Of South America
- 5. Middle East
-
6. UAE
- 6.1. Saudi Arabia
- 6.2. South Africa
- 6.3. Others
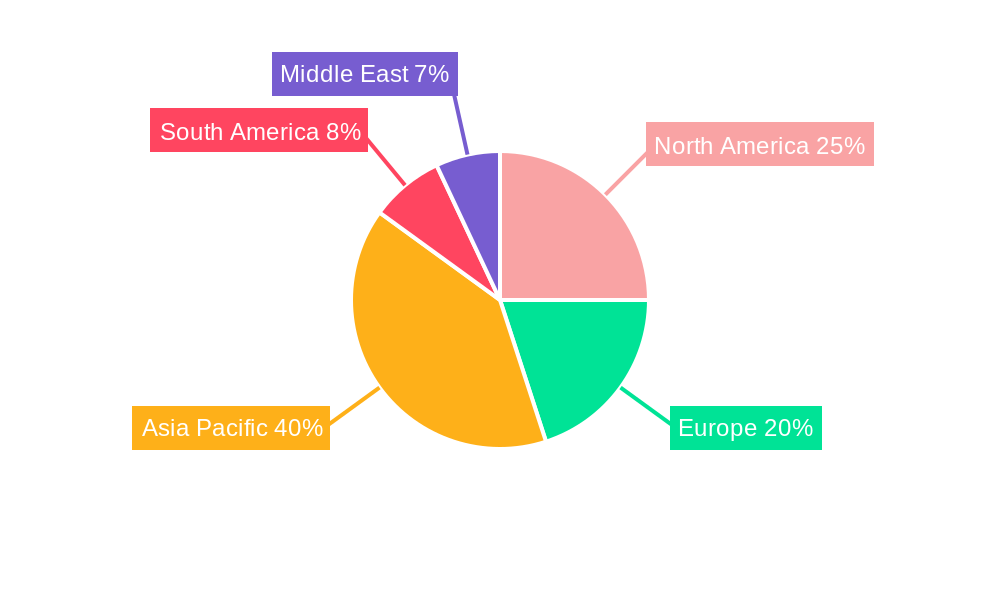
Marine Services Industry Regional Market Share
Geographic Coverage of Marine Services Industry
Marine Services Industry REPORT HIGHLIGHTS
| Aspects | Details |
|---|---|
| Study Period | 2020-2034 |
| Base Year | 2025 |
| Estimated Year | 2026 |
| Forecast Period | 2026-2034 |
| Historical Period | 2020-2025 |
| Growth Rate | CAGR of > 5.00% from 2020-2034 |
| Segmentation |
|
Table of Contents
- 1. Introduction
- 1.1. Research Scope
- 1.2. Market Segmentation
- 1.3. Research Objective
- 1.4. Definitions and Assumptions
- 2. Executive Summary
- 2.1. Market Snapshot
- 3. Market Dynamics
- 3.1. Market Drivers
- 3.2. Market Restrains
- 3.3. Market Trends
- 3.4. Market Opportunities
- 4. Market Factor Analysis
- 4.1. Porters Five Forces
- 4.1.1. Bargaining Power of Suppliers
- 4.1.2. Bargaining Power of Buyers
- 4.1.3. Threat of New Entrants
- 4.1.4. Threat of Substitutes
- 4.1.5. Competitive Rivalry
- 4.2. PESTEL analysis
- 4.3. BCG Analysis
- 4.3.1. Stars (High Growth, High Market Share)
- 4.3.2. Cash Cows (Low Growth, High Market Share)
- 4.3.3. Question Mark (High Growth, Low Market Share)
- 4.3.4. Dogs (Low Growth, Low Market Share)
- 4.4. Ansoff Matrix Analysis
- 4.5. Supply Chain Analysis
- 4.6. Regulatory Landscape
- 4.7. Current Market Potential and Opportunity Assessment (TAM–SAM–SOM Framework)
- 4.8. DMV Analyst Note
- 4.1. Porters Five Forces
- 5. Market Analysis, Insights and Forecast 2021-2033
- 5.1. Market Analysis, Insights and Forecast - by Service Analysis
- 5.1.1. Container Handling Services
- 5.1.2. Ship repair and maintenance services
- 5.1.3. Supply Chain
- 5.1.4. Mechanical and Electrical Engineering Services
- 5.1.5. Navigation Services
- 5.1.6. Logistics Solutions
- 5.2. Market Analysis, Insights and Forecast - by Region
- 5.2.1. North America
- 5.2.2. Europe
- 5.2.3. Asia Pacific
- 5.2.4. South America
- 5.2.5. Middle East
- 5.2.6. UAE
- 5.1. Market Analysis, Insights and Forecast - by Service Analysis
- 6. Global Marine Services Industry Analysis, Insights and Forecast, 2021-2033
- 6.1. Market Analysis, Insights and Forecast - by Service Analysis
- 6.1.1. Container Handling Services
- 6.1.2. Ship repair and maintenance services
- 6.1.3. Supply Chain
- 6.1.4. Mechanical and Electrical Engineering Services
- 6.1.5. Navigation Services
- 6.1.6. Logistics Solutions
- 6.1. Market Analysis, Insights and Forecast - by Service Analysis
- 7. North America Marine Services Industry Analysis, Insights and Forecast, 2020-2032
- 7.1. Market Analysis, Insights and Forecast - by Service Analysis
- 7.1.1. Container Handling Services
- 7.1.2. Ship repair and maintenance services
- 7.1.3. Supply Chain
- 7.1.4. Mechanical and Electrical Engineering Services
- 7.1.5. Navigation Services
- 7.1.6. Logistics Solutions
- 7.1. Market Analysis, Insights and Forecast - by Service Analysis
- 8. Europe Marine Services Industry Analysis, Insights and Forecast, 2020-2032
- 8.1. Market Analysis, Insights and Forecast - by Service Analysis
- 8.1.1. Container Handling Services
- 8.1.2. Ship repair and maintenance services
- 8.1.3. Supply Chain
- 8.1.4. Mechanical and Electrical Engineering Services
- 8.1.5. Navigation Services
- 8.1.6. Logistics Solutions
- 8.1. Market Analysis, Insights and Forecast - by Service Analysis
- 9. Asia Pacific Marine Services Industry Analysis, Insights and Forecast, 2020-2032
- 9.1. Market Analysis, Insights and Forecast - by Service Analysis
- 9.1.1. Container Handling Services
- 9.1.2. Ship repair and maintenance services
- 9.1.3. Supply Chain
- 9.1.4. Mechanical and Electrical Engineering Services
- 9.1.5. Navigation Services
- 9.1.6. Logistics Solutions
- 9.1. Market Analysis, Insights and Forecast - by Service Analysis
- 10. South America Marine Services Industry Analysis, Insights and Forecast, 2020-2032
- 10.1. Market Analysis, Insights and Forecast - by Service Analysis
- 10.1.1. Container Handling Services
- 10.1.2. Ship repair and maintenance services
- 10.1.3. Supply Chain
- 10.1.4. Mechanical and Electrical Engineering Services
- 10.1.5. Navigation Services
- 10.1.6. Logistics Solutions
- 10.1. Market Analysis, Insights and Forecast - by Service Analysis
- 11. Middle East Marine Services Industry Analysis, Insights and Forecast, 2020-2032
- 11.1. Market Analysis, Insights and Forecast - by Service Analysis
- 11.1.1. Container Handling Services
- 11.1.2. Ship repair and maintenance services
- 11.1.3. Supply Chain
- 11.1.4. Mechanical and Electrical Engineering Services
- 11.1.5. Navigation Services
- 11.1.6. Logistics Solutions
- 11.1. Market Analysis, Insights and Forecast - by Service Analysis
- 12. UAE Marine Services Industry Analysis, Insights and Forecast, 2020-2032
- 12.1. Market Analysis, Insights and Forecast - by Service Analysis
- 12.1.1. Container Handling Services
- 12.1.2. Ship repair and maintenance services
- 12.1.3. Supply Chain
- 12.1.4. Mechanical and Electrical Engineering Services
- 12.1.5. Navigation Services
- 12.1.6. Logistics Solutions
- 12.1. Market Analysis, Insights and Forecast - by Service Analysis
- 13. Competitive Analysis
- 13.1. Company Profiles
- 13.1.1 International Container Terminal Services
- 13.1.1.1. Company Overview
- 13.1.1.2. Products
- 13.1.1.3. Company Financials
- 13.1.1.4. SWOT Analysis
- 13.1.2 Shanghai International Port
- 13.1.2.1. Company Overview
- 13.1.2.2. Products
- 13.1.2.3. Company Financials
- 13.1.2.4. SWOT Analysis
- 13.1.3 CarboShield Inc
- 13.1.3.1. Company Overview
- 13.1.3.2. Products
- 13.1.3.3. Company Financials
- 13.1.3.4. SWOT Analysis
- 13.1.4 Shipping Solutions and Services Ltd
- 13.1.4.1. Company Overview
- 13.1.4.2. Products
- 13.1.4.3. Company Financials
- 13.1.4.4. SWOT Analysis
- 13.1.5 Hamburger Hafen Und Logistik AG
- 13.1.5.1. Company Overview
- 13.1.5.2. Products
- 13.1.5.3. Company Financials
- 13.1.5.4. SWOT Analysis
- 13.1.6 TomWorks LLC
- 13.1.6.1. Company Overview
- 13.1.6.2. Products
- 13.1.6.3. Company Financials
- 13.1.6.4. SWOT Analysis
- 13.1.7 Montreal Port Authority**List Not Exhaustive
- 13.1.7.1. Company Overview
- 13.1.7.2. Products
- 13.1.7.3. Company Financials
- 13.1.7.4. SWOT Analysis
- 13.1.8 DP World Limited
- 13.1.8.1. Company Overview
- 13.1.8.2. Products
- 13.1.8.3. Company Financials
- 13.1.8.4. SWOT Analysis
- 13.1.9 Tianjin Port Development Holdings Ltd
- 13.1.9.1. Company Overview
- 13.1.9.2. Products
- 13.1.9.3. Company Financials
- 13.1.9.4. SWOT Analysis
- 13.1.10 AP Moller Maersk
- 13.1.10.1. Company Overview
- 13.1.10.2. Products
- 13.1.10.3. Company Financials
- 13.1.10.4. SWOT Analysis
- 13.1.1 International Container Terminal Services
- 13.2. Market Entropy
- 13.2.1 Company's Key Areas Served
- 13.2.2 Recent Developments
- 13.3. Company Market Share Analysis 2025
- 13.3.1 Top 5 Companies Market Share Analysis
- 13.3.2 Top 3 Companies Market Share Analysis
- 13.4. List of Potential Customers
- 14. Research Methodology
List of Figures
- Figure 1: Global Marine Services Industry Revenue Breakdown (Million, %) by Region 2025 & 2033
- Figure 2: North America Marine Services Industry Revenue (Million), by Service Analysis 2025 & 2033
- Figure 3: North America Marine Services Industry Revenue Share (%), by Service Analysis 2025 & 2033
- Figure 4: North America Marine Services Industry Revenue (Million), by Country 2025 & 2033
- Figure 5: North America Marine Services Industry Revenue Share (%), by Country 2025 & 2033
- Figure 6: Europe Marine Services Industry Revenue (Million), by Service Analysis 2025 & 2033
- Figure 7: Europe Marine Services Industry Revenue Share (%), by Service Analysis 2025 & 2033
- Figure 8: Europe Marine Services Industry Revenue (Million), by Country 2025 & 2033
- Figure 9: Europe Marine Services Industry Revenue Share (%), by Country 2025 & 2033
- Figure 10: Asia Pacific Marine Services Industry Revenue (Million), by Service Analysis 2025 & 2033
- Figure 11: Asia Pacific Marine Services Industry Revenue Share (%), by Service Analysis 2025 & 2033
- Figure 12: Asia Pacific Marine Services Industry Revenue (Million), by Country 2025 & 2033
- Figure 13: Asia Pacific Marine Services Industry Revenue Share (%), by Country 2025 & 2033
- Figure 14: South America Marine Services Industry Revenue (Million), by Service Analysis 2025 & 2033
- Figure 15: South America Marine Services Industry Revenue Share (%), by Service Analysis 2025 & 2033
- Figure 16: South America Marine Services Industry Revenue (Million), by Country 2025 & 2033
- Figure 17: South America Marine Services Industry Revenue Share (%), by Country 2025 & 2033
- Figure 18: Middle East Marine Services Industry Revenue (Million), by Service Analysis 2025 & 2033
- Figure 19: Middle East Marine Services Industry Revenue Share (%), by Service Analysis 2025 & 2033
- Figure 20: Middle East Marine Services Industry Revenue (Million), by Country 2025 & 2033
- Figure 21: Middle East Marine Services Industry Revenue Share (%), by Country 2025 & 2033
- Figure 22: UAE Marine Services Industry Revenue (Million), by Service Analysis 2025 & 2033
- Figure 23: UAE Marine Services Industry Revenue Share (%), by Service Analysis 2025 & 2033
- Figure 24: UAE Marine Services Industry Revenue (Million), by Country 2025 & 2033
- Figure 25: UAE Marine Services Industry Revenue Share (%), by Country 2025 & 2033
List of Tables
- Table 1: Global Marine Services Industry Revenue Million Forecast, by Service Analysis 2020 & 2033
- Table 2: Global Marine Services Industry Revenue Million Forecast, by Region 2020 & 2033
- Table 3: Global Marine Services Industry Revenue Million Forecast, by Service Analysis 2020 & 2033
- Table 4: Global Marine Services Industry Revenue Million Forecast, by Country 2020 & 2033
- Table 5: US Marine Services Industry Revenue (Million) Forecast, by Application 2020 & 2033
- Table 6: Canada Marine Services Industry Revenue (Million) Forecast, by Application 2020 & 2033
- Table 7: Mexico Marine Services Industry Revenue (Million) Forecast, by Application 2020 & 2033
- Table 8: Global Marine Services Industry Revenue Million Forecast, by Service Analysis 2020 & 2033
- Table 9: Global Marine Services Industry Revenue Million Forecast, by Country 2020 & 2033
- Table 10: Germany Marine Services Industry Revenue (Million) Forecast, by Application 2020 & 2033
- Table 11: UK Marine Services Industry Revenue (Million) Forecast, by Application 2020 & 2033
- Table 12: France Marine Services Industry Revenue (Million) Forecast, by Application 2020 & 2033
- Table 13: Russia Marine Services Industry Revenue (Million) Forecast, by Application 2020 & 2033
- Table 14: Spain Marine Services Industry Revenue (Million) Forecast, by Application 2020 & 2033
- Table 15: Rest of Europe Marine Services Industry Revenue (Million) Forecast, by Application 2020 & 2033
- Table 16: Global Marine Services Industry Revenue Million Forecast, by Service Analysis 2020 & 2033
- Table 17: Global Marine Services Industry Revenue Million Forecast, by Country 2020 & 2033
- Table 18: India Marine Services Industry Revenue (Million) Forecast, by Application 2020 & 2033
- Table 19: China Marine Services Industry Revenue (Million) Forecast, by Application 2020 & 2033
- Table 20: Japan Marine Services Industry Revenue (Million) Forecast, by Application 2020 & 2033
- Table 21: Australia Marine Services Industry Revenue (Million) Forecast, by Application 2020 & 2033
- Table 22: Singapore Marine Services Industry Revenue (Million) Forecast, by Application 2020 & 2033
- Table 23: Malaysia Marine Services Industry Revenue (Million) Forecast, by Application 2020 & 2033
- Table 24: South Korea Marine Services Industry Revenue (Million) Forecast, by Application 2020 & 2033
- Table 25: Rest of Asia Pacific Marine Services Industry Revenue (Million) Forecast, by Application 2020 & 2033
- Table 26: Global Marine Services Industry Revenue Million Forecast, by Service Analysis 2020 & 2033
- Table 27: Global Marine Services Industry Revenue Million Forecast, by Country 2020 & 2033
- Table 28: Brazil Marine Services Industry Revenue (Million) Forecast, by Application 2020 & 2033
- Table 29: Argentina Marine Services Industry Revenue (Million) Forecast, by Application 2020 & 2033
- Table 30: Rest Of South America Marine Services Industry Revenue (Million) Forecast, by Application 2020 & 2033
- Table 31: Global Marine Services Industry Revenue Million Forecast, by Service Analysis 2020 & 2033
- Table 32: Global Marine Services Industry Revenue Million Forecast, by Country 2020 & 2033
- Table 33: Global Marine Services Industry Revenue Million Forecast, by Service Analysis 2020 & 2033
- Table 34: Global Marine Services Industry Revenue Million Forecast, by Country 2020 & 2033
- Table 35: Saudi Arabia Marine Services Industry Revenue (Million) Forecast, by Application 2020 & 2033
- Table 36: South Africa Marine Services Industry Revenue (Million) Forecast, by Application 2020 & 2033
- Table 37: Others Marine Services Industry Revenue (Million) Forecast, by Application 2020 & 2033
Frequently Asked Questions
1. What is the projected Compound Annual Growth Rate (CAGR) of the Marine Services Industry?
The projected CAGR is approximately > 5.00%.
2. Which companies are prominent players in the Marine Services Industry?
Key companies in the market include International Container Terminal Services, Shanghai International Port, CarboShield Inc, Shipping Solutions and Services Ltd, Hamburger Hafen Und Logistik AG, TomWorks LLC, Montreal Port Authority**List Not Exhaustive, DP World Limited, Tianjin Port Development Holdings Ltd, AP Moller Maersk.
3. What are the main segments of the Marine Services Industry?
The market segments include Service Analysis.
4. Can you provide details about the market size?
The market size is estimated to be USD XX Million as of 2022.
5. What are some drivers contributing to market growth?
The rise in online shopping and consumer demand for fast delivery; Rise in cross-border trade activities.
6. What are the notable trends driving market growth?
Increasing Maritime Trade.
7. Are there any restraints impacting market growth?
Poor infrastructure and higher logistics costs.
8. Can you provide examples of recent developments in the market?
On 19 June 2022, DP World and the Saudi Ports Authority announce a major new partnership for the Jeddah logistics park. This is a 30-year agreement with an investment value of more than SAR 500 million (USD 133.33 million) to build a state-of-the-art, port-centric Logistics Park at the Jeddah Islamic Port. The agreement aims to establish a logistics park that spans over 415,000 square meters, with an in-land container depot capacity of approximately 250,000 TEU and a warehousing storage space of 100,000 square meters. Future expansions could increase the storage space to 200,000 square meters.
9. What pricing options are available for accessing the report?
Pricing options include single-user, multi-user, and enterprise licenses priced at USD 4750, USD 5250, and USD 8750 respectively.
10. Is the market size provided in terms of value or volume?
The market size is provided in terms of value, measured in Million.
11. Are there any specific market keywords associated with the report?
Yes, the market keyword associated with the report is "Marine Services Industry," which aids in identifying and referencing the specific market segment covered.
12. How do I determine which pricing option suits my needs best?
The pricing options vary based on user requirements and access needs. Individual users may opt for single-user licenses, while businesses requiring broader access may choose multi-user or enterprise licenses for cost-effective access to the report.
13. Are there any additional resources or data provided in the Marine Services Industry report?
While the report offers comprehensive insights, it's advisable to review the specific contents or supplementary materials provided to ascertain if additional resources or data are available.
14. How can I stay updated on further developments or reports in the Marine Services Industry?
To stay informed about further developments, trends, and reports in the Marine Services Industry, consider subscribing to industry newsletters, following relevant companies and organizations, or regularly checking reputable industry news sources and publications.
Methodology
Step 1 - Identification of Relevant Samples Size from Population Database


Step 2 - Approaches for Defining Global Market Size (Value, Volume* & Price*)

Note*: In applicable scenarios
Step 3 - Data Sources
Primary Research
- Web Analytics
- Survey Reports
- Research Institute
- Latest Research Reports
- Opinion Leaders
Secondary Research
- Annual Reports
- White Paper
- Latest Press Release
- Industry Association
- Paid Database
- Investor Presentations

Step 4 - Data Triangulation
Involves using different sources of information in order to increase the validity of a study
These sources are likely to be stakeholders in a program - participants, other researchers, program staff, other community members, and so on.
Then we put all data in single framework & apply various statistical tools to find out the dynamic on the market.
During the analysis stage, feedback from the stakeholder groups would be compared to determine areas of agreement as well as areas of divergence