

Key Insights
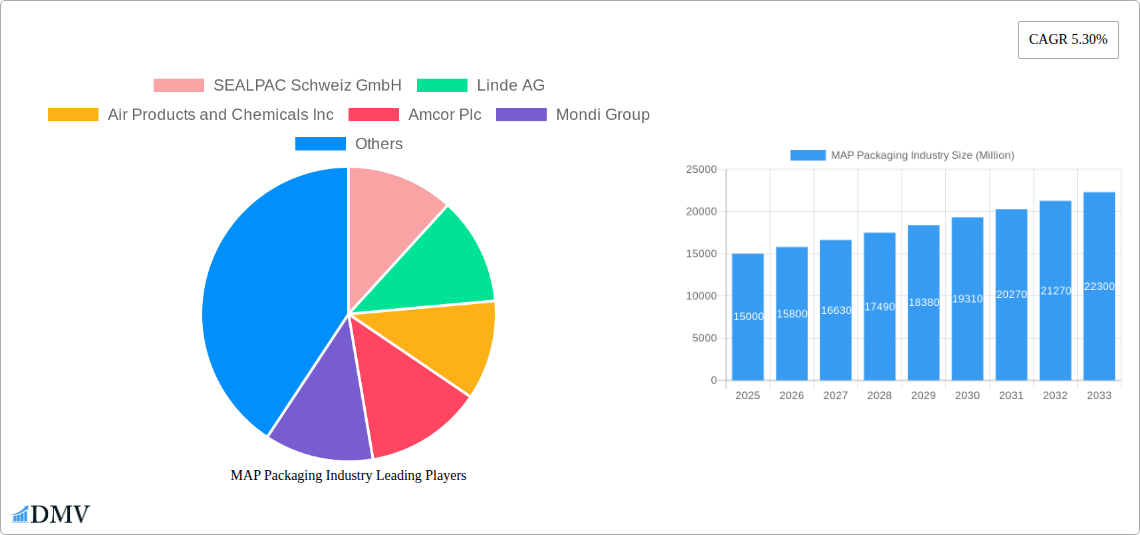
The Modified Atmosphere Packaging (MAP) industry is experiencing robust growth, driven by increasing demand for extending the shelf life of food products and maintaining their quality. A CAGR of 5.30% from 2019 to 2024 suggests a significant market expansion, and this upward trajectory is expected to continue through 2033. Key drivers include the rising consumer preference for convenience and ready-to-eat meals, the growing awareness of food waste reduction, and the increasing adoption of MAP technology across various food segments, including poultry, seafood, meat, fruits, vegetables, and bakery products. The European market, specifically the UK, Germany, France, and Italy, represents a substantial portion of the global market share, fueled by established food processing industries and stringent food safety regulations. However, factors such as fluctuating raw material prices and technological complexities associated with MAP implementation could pose challenges to market growth. The market segmentation by packaging gas type (oxygen, nitrogen, carbon dioxide, others), packaging material (PP, PVC, LDPE, others), and application further highlights the diverse and expanding nature of this sector. Key players such as SEALPAC, Linde AG, Air Products, Amcor, and Mondi Group are shaping the competitive landscape through innovation in packaging materials and technologies.
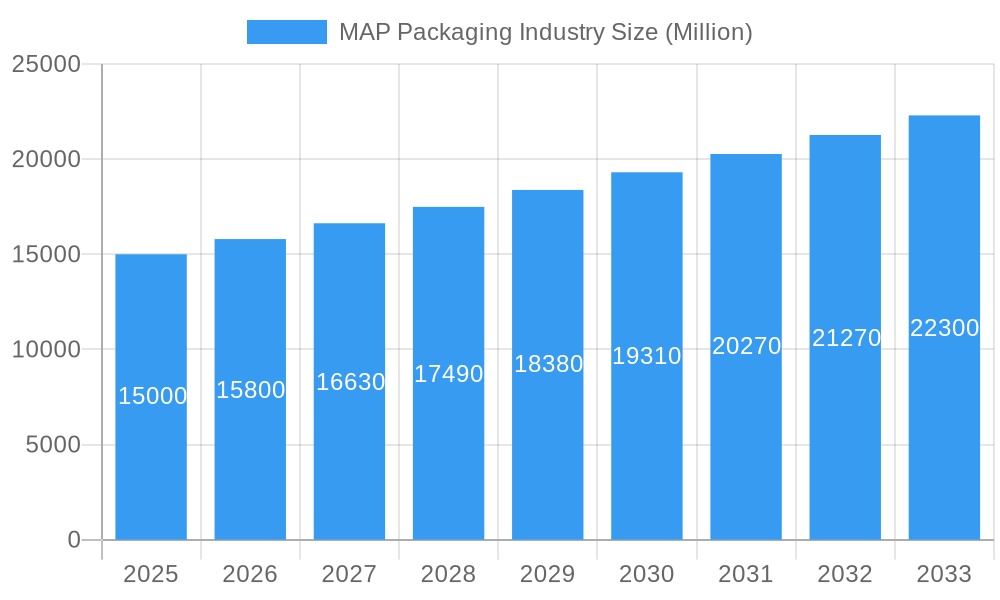
MAP Packaging Industry Market Size (In Billion)
The forecast for the MAP packaging market indicates continued expansion, with the increasing adoption of sustainable packaging solutions further driving growth. The Asia-Pacific region is anticipated to show significant growth potential in the coming years due to increasing urbanization, rising disposable incomes, and a growing middle class with a preference for packaged food products. While North America and Europe remain substantial markets, innovations in packaging technology, such as active and intelligent packaging systems, are expected to create new opportunities for growth. Competition among established players and new entrants will likely intensify, fostering innovation and driving prices down, making MAP technology more accessible across different food sectors and geographical regions. Therefore, the future outlook for the MAP packaging industry is positive, with potential for continued expansion and diversification.
MAP Packaging Industry Company Market Share
MAP Packaging Industry: A Comprehensive Market Report (2019-2033)
This insightful report provides a detailed analysis of the Modified Atmosphere Packaging (MAP) industry, projecting a market valuation exceeding xx Million by 2033. It offers a comprehensive overview of market dynamics, competitive landscapes, and future growth potential, equipping stakeholders with crucial insights for strategic decision-making. The study period spans from 2019 to 2033, with 2025 serving as the base and estimated year. This report is invaluable for businesses seeking to navigate the complexities of this dynamic market.
MAP Packaging Industry Market Composition & Trends
This section delves into the intricacies of the MAP packaging market, analyzing its structure, driving forces, and regulatory environment. We examine market concentration, revealing the market share distribution amongst key players like Amcor Plc, Mondi Group, and Sealed Air Corporation, with a predicted combined share of xx%. Innovation catalysts, such as advancements in barrier film technologies and gas mixing systems, are explored, alongside an analysis of the regulatory landscape and its impact on industry practices. The influence of substitute products and the evolving end-user profiles across various applications (poultry, seafood, fruits, etc.) are also meticulously examined. Finally, the report assesses recent M&A activities, estimating total deal values at approximately xx Million during the historical period (2019-2024), providing insights into industry consolidation trends.
- Market Share Distribution: Amcor Plc (xx%), Mondi Group (xx%), Sealed Air Corporation (xx%), Others (xx%).
- M&A Deal Value (2019-2024): xx Million
- Key Innovation Catalysts: Improved barrier films, advanced gas mixing technologies, sustainable packaging solutions.
- Regulatory Landscape: Focus on food safety regulations and sustainability initiatives.
MAP Packaging Industry Industry Evolution
This section traces the evolution of the MAP packaging industry, showcasing its growth trajectory and transformative technological advancements. We analyze the historical period (2019-2024) and project growth rates for the forecast period (2025-2033), revealing a Compound Annual Growth Rate (CAGR) of xx%. The adoption of new technologies, such as smart packaging and active packaging solutions, is examined, alongside their impact on market penetration rates. The report also analyzes shifting consumer demands, such as a preference for extended shelf life and sustainable packaging options, and their implications for industry growth. Data points on consumer preference shifts toward sustainable packaging will further contextualize the growth patterns.
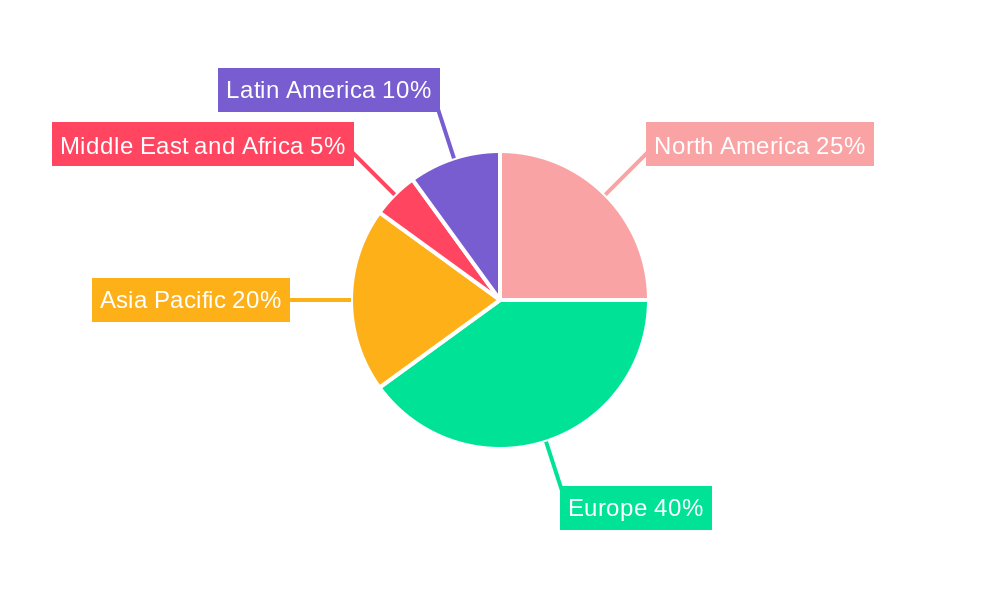
Leading Regions, Countries, or Segments in MAP Packaging Industry
This section identifies the leading regions, countries, and segments within the MAP packaging market. Our analysis points to Western Europe as the dominant region, with Germany, the United Kingdom, and France showcasing significant market strength.
- Leading Region: Western Europe
- Key Countries: Germany, United Kingdom, France
- Dominant Packaging Gas Type: Nitrogen (xx% Market Share)
- Prevalent Packaging Material: Polypropylene (PP) (xx% Market Share)
- Largest Application Segment: Poultry, Seafood, & Meat Products (xx% Market Share)
Key Drivers:
- High levels of investment in automation and advanced packaging technologies in leading countries like Germany and UK.
- Stringent food safety regulations in the region driving the adoption of MAP packaging for improved product preservation.
- Growing consumer awareness regarding food waste reduction fuels preference for longer shelf-life products.
MAP Packaging Industry Product Innovations
Recent years have witnessed significant innovation in MAP packaging. New materials like improved barrier films and recyclable alternatives are gaining traction. Advanced gas mixing technologies offer precise atmosphere control, extending shelf life and improving product quality. The integration of smart sensors and indicators is enhancing traceability and providing real-time condition monitoring. These innovations cater to the growing consumer demand for sustainable and convenient packaging solutions.
Propelling Factors for MAP Packaging Industry Growth
Several factors fuel the growth of the MAP packaging industry. Technological advancements such as improved barrier materials and active packaging systems significantly extend product shelf life, reducing waste. Furthermore, stringent food safety regulations in key markets necessitate effective preservation methods, driving MAP adoption. The burgeoning e-commerce sector necessitates robust packaging solutions to ensure product integrity during transit.
Obstacles in the MAP Packaging Industry Market
Despite significant growth potential, the MAP packaging industry faces challenges. Fluctuations in raw material prices (particularly polymers) can impact profitability. Supply chain disruptions, especially during global events, can lead to production delays. Intense competition from established players and new entrants necessitates continuous innovation and cost optimization strategies. Furthermore, evolving environmental regulations add another layer of complexity. These factors combined could restrain the industry's projected growth by approximately xx% by 2033.
Future Opportunities in MAP Packaging Industry
The MAP packaging market presents significant future opportunities. The growing demand for sustainable packaging solutions drives the development of biodegradable and compostable alternatives. Expanding into emerging markets with increasing food processing and retail sectors offers immense potential. The integration of smart packaging technologies, enabling real-time product monitoring and traceability, offers further growth avenues.
Major Players in the MAP Packaging Industry Ecosystem
- SEALPAC Schweiz GmbH
- Linde AG
- Air Products and Chemicals Inc
- Amcor Plc
- Mondi Group
- Syntegon Technology GmbH
- Barry-Wehmiller Companies
- ULMA Packaging
- CV-Tek
- Sealed Air Corporation
Key Developments in MAP Packaging Industry Industry
- Q1 2023: Amcor Plc launched a new range of recyclable MAP packaging films.
- Q3 2022: Mondi Group announced a significant investment in a new MAP packaging production facility.
- 2021: A major merger between two key players reshaped the market landscape. (Further details within the report)
Strategic MAP Packaging Industry Market Forecast
The MAP packaging market is poised for robust growth, driven by technological advancements, evolving consumer preferences, and stringent food safety regulations. Opportunities lie in sustainable packaging solutions, smart packaging technologies, and expansion into emerging markets. The market is projected to exceed xx Million by 2033, presenting lucrative opportunities for existing and new players alike.
MAP Packaging Industry Segmentation
-
1. Packaging Gas Type
- 1.1. Oxygen
- 1.2. Nitrogen
- 1.3. Carbon Dioxide
- 1.4. Other Gases
-
2. Type of Packaging Material
- 2.1. Polypropylene (PP)
- 2.2. Polyvinylchloride (PVC)
- 2.3. Low-Density Polyethylene (LDPE)
- 2.4. Other Materials
-
3. Application
- 3.1. Poultry, Seafood, & Meat Products
- 3.2. Fruits & Vegetables
- 3.3. Bakery & Confectionery
- 3.4. Other Applications
MAP Packaging Industry Segmentation By Geography
-
1. North America
- 1.1. United States
- 1.2. Canada
- 1.3. Mexico
-
2. South America
- 2.1. Brazil
- 2.2. Argentina
- 2.3. Rest of South America
-
3. Europe
- 3.1. United Kingdom
- 3.2. Germany
- 3.3. France
- 3.4. Italy
- 3.5. Spain
- 3.6. Russia
- 3.7. Benelux
- 3.8. Nordics
- 3.9. Rest of Europe
-
4. Middle East & Africa
- 4.1. Turkey
- 4.2. Israel
- 4.3. GCC
- 4.4. North Africa
- 4.5. South Africa
- 4.6. Rest of Middle East & Africa
-
5. Asia Pacific
- 5.1. China
- 5.2. India
- 5.3. Japan
- 5.4. South Korea
- 5.5. ASEAN
- 5.6. Oceania
- 5.7. Rest of Asia Pacific
MAP Packaging Industry Regional Market Share
Geographic Coverage of MAP Packaging Industry
MAP Packaging Industry REPORT HIGHLIGHTS
| Aspects | Details |
|---|---|
| Study Period | 2020-2034 |
| Base Year | 2025 |
| Estimated Year | 2026 |
| Forecast Period | 2026-2034 |
| Historical Period | 2020-2025 |
| Growth Rate | CAGR of 5.30% from 2020-2034 |
| Segmentation |
|
Table of Contents
- 1. Introduction
- 1.1. Research Scope
- 1.2. Market Segmentation
- 1.3. Research Objective
- 1.4. Definitions and Assumptions
- 2. Executive Summary
- 2.1. Market Snapshot
- 3. Market Dynamics
- 3.1. Market Drivers
- 3.2. Market Restrains
- 3.3. Market Trends
- 3.4. Market Opportunities
- 4. Market Factor Analysis
- 4.1. Porters Five Forces
- 4.1.1. Bargaining Power of Suppliers
- 4.1.2. Bargaining Power of Buyers
- 4.1.3. Threat of New Entrants
- 4.1.4. Threat of Substitutes
- 4.1.5. Competitive Rivalry
- 4.2. PESTEL analysis
- 4.3. BCG Analysis
- 4.3.1. Stars (High Growth, High Market Share)
- 4.3.2. Cash Cows (Low Growth, High Market Share)
- 4.3.3. Question Mark (High Growth, Low Market Share)
- 4.3.4. Dogs (Low Growth, Low Market Share)
- 4.4. Ansoff Matrix Analysis
- 4.5. Supply Chain Analysis
- 4.6. Regulatory Landscape
- 4.7. Current Market Potential and Opportunity Assessment (TAM–SAM–SOM Framework)
- 4.8. DMV Analyst Note
- 4.1. Porters Five Forces
- 5. Market Analysis, Insights and Forecast 2021-2033
- 5.1. Market Analysis, Insights and Forecast - by Packaging Gas Type
- 5.1.1. Oxygen
- 5.1.2. Nitrogen
- 5.1.3. Carbon Dioxide
- 5.1.4. Other Gases
- 5.2. Market Analysis, Insights and Forecast - by Type of Packaging Material
- 5.2.1. Polypropylene (PP)
- 5.2.2. Polyvinylchloride (PVC)
- 5.2.3. Low-Density Polyethylene (LDPE)
- 5.2.4. Other Materials
- 5.3. Market Analysis, Insights and Forecast - by Application
- 5.3.1. Poultry, Seafood, & Meat Products
- 5.3.2. Fruits & Vegetables
- 5.3.3. Bakery & Confectionery
- 5.3.4. Other Applications
- 5.4. Market Analysis, Insights and Forecast - by Region
- 5.4.1. North America
- 5.4.2. South America
- 5.4.3. Europe
- 5.4.4. Middle East & Africa
- 5.4.5. Asia Pacific
- 5.1. Market Analysis, Insights and Forecast - by Packaging Gas Type
- 6. Global MAP Packaging Industry Analysis, Insights and Forecast, 2021-2033
- 6.1. Market Analysis, Insights and Forecast - by Packaging Gas Type
- 6.1.1. Oxygen
- 6.1.2. Nitrogen
- 6.1.3. Carbon Dioxide
- 6.1.4. Other Gases
- 6.2. Market Analysis, Insights and Forecast - by Type of Packaging Material
- 6.2.1. Polypropylene (PP)
- 6.2.2. Polyvinylchloride (PVC)
- 6.2.3. Low-Density Polyethylene (LDPE)
- 6.2.4. Other Materials
- 6.3. Market Analysis, Insights and Forecast - by Application
- 6.3.1. Poultry, Seafood, & Meat Products
- 6.3.2. Fruits & Vegetables
- 6.3.3. Bakery & Confectionery
- 6.3.4. Other Applications
- 6.1. Market Analysis, Insights and Forecast - by Packaging Gas Type
- 7. North America MAP Packaging Industry Analysis, Insights and Forecast, 2020-2032
- 7.1. Market Analysis, Insights and Forecast - by Packaging Gas Type
- 7.1.1. Oxygen
- 7.1.2. Nitrogen
- 7.1.3. Carbon Dioxide
- 7.1.4. Other Gases
- 7.2. Market Analysis, Insights and Forecast - by Type of Packaging Material
- 7.2.1. Polypropylene (PP)
- 7.2.2. Polyvinylchloride (PVC)
- 7.2.3. Low-Density Polyethylene (LDPE)
- 7.2.4. Other Materials
- 7.3. Market Analysis, Insights and Forecast - by Application
- 7.3.1. Poultry, Seafood, & Meat Products
- 7.3.2. Fruits & Vegetables
- 7.3.3. Bakery & Confectionery
- 7.3.4. Other Applications
- 7.1. Market Analysis, Insights and Forecast - by Packaging Gas Type
- 8. South America MAP Packaging Industry Analysis, Insights and Forecast, 2020-2032
- 8.1. Market Analysis, Insights and Forecast - by Packaging Gas Type
- 8.1.1. Oxygen
- 8.1.2. Nitrogen
- 8.1.3. Carbon Dioxide
- 8.1.4. Other Gases
- 8.2. Market Analysis, Insights and Forecast - by Type of Packaging Material
- 8.2.1. Polypropylene (PP)
- 8.2.2. Polyvinylchloride (PVC)
- 8.2.3. Low-Density Polyethylene (LDPE)
- 8.2.4. Other Materials
- 8.3. Market Analysis, Insights and Forecast - by Application
- 8.3.1. Poultry, Seafood, & Meat Products
- 8.3.2. Fruits & Vegetables
- 8.3.3. Bakery & Confectionery
- 8.3.4. Other Applications
- 8.1. Market Analysis, Insights and Forecast - by Packaging Gas Type
- 9. Europe MAP Packaging Industry Analysis, Insights and Forecast, 2020-2032
- 9.1. Market Analysis, Insights and Forecast - by Packaging Gas Type
- 9.1.1. Oxygen
- 9.1.2. Nitrogen
- 9.1.3. Carbon Dioxide
- 9.1.4. Other Gases
- 9.2. Market Analysis, Insights and Forecast - by Type of Packaging Material
- 9.2.1. Polypropylene (PP)
- 9.2.2. Polyvinylchloride (PVC)
- 9.2.3. Low-Density Polyethylene (LDPE)
- 9.2.4. Other Materials
- 9.3. Market Analysis, Insights and Forecast - by Application
- 9.3.1. Poultry, Seafood, & Meat Products
- 9.3.2. Fruits & Vegetables
- 9.3.3. Bakery & Confectionery
- 9.3.4. Other Applications
- 9.1. Market Analysis, Insights and Forecast - by Packaging Gas Type
- 10. Middle East & Africa MAP Packaging Industry Analysis, Insights and Forecast, 2020-2032
- 10.1. Market Analysis, Insights and Forecast - by Packaging Gas Type
- 10.1.1. Oxygen
- 10.1.2. Nitrogen
- 10.1.3. Carbon Dioxide
- 10.1.4. Other Gases
- 10.2. Market Analysis, Insights and Forecast - by Type of Packaging Material
- 10.2.1. Polypropylene (PP)
- 10.2.2. Polyvinylchloride (PVC)
- 10.2.3. Low-Density Polyethylene (LDPE)
- 10.2.4. Other Materials
- 10.3. Market Analysis, Insights and Forecast - by Application
- 10.3.1. Poultry, Seafood, & Meat Products
- 10.3.2. Fruits & Vegetables
- 10.3.3. Bakery & Confectionery
- 10.3.4. Other Applications
- 10.1. Market Analysis, Insights and Forecast - by Packaging Gas Type
- 11. Asia Pacific MAP Packaging Industry Analysis, Insights and Forecast, 2020-2032
- 11.1. Market Analysis, Insights and Forecast - by Packaging Gas Type
- 11.1.1. Oxygen
- 11.1.2. Nitrogen
- 11.1.3. Carbon Dioxide
- 11.1.4. Other Gases
- 11.2. Market Analysis, Insights and Forecast - by Type of Packaging Material
- 11.2.1. Polypropylene (PP)
- 11.2.2. Polyvinylchloride (PVC)
- 11.2.3. Low-Density Polyethylene (LDPE)
- 11.2.4. Other Materials
- 11.3. Market Analysis, Insights and Forecast - by Application
- 11.3.1. Poultry, Seafood, & Meat Products
- 11.3.2. Fruits & Vegetables
- 11.3.3. Bakery & Confectionery
- 11.3.4. Other Applications
- 11.1. Market Analysis, Insights and Forecast - by Packaging Gas Type
- 12. Competitive Analysis
- 12.1. Company Profiles
- 12.1.1 SEALPAC Schweiz GmbH
- 12.1.1.1. Company Overview
- 12.1.1.2. Products
- 12.1.1.3. Company Financials
- 12.1.1.4. SWOT Analysis
- 12.1.2 Linde AG
- 12.1.2.1. Company Overview
- 12.1.2.2. Products
- 12.1.2.3. Company Financials
- 12.1.2.4. SWOT Analysis
- 12.1.3 Air Products and Chemicals Inc
- 12.1.3.1. Company Overview
- 12.1.3.2. Products
- 12.1.3.3. Company Financials
- 12.1.3.4. SWOT Analysis
- 12.1.4 Amcor Plc
- 12.1.4.1. Company Overview
- 12.1.4.2. Products
- 12.1.4.3. Company Financials
- 12.1.4.4. SWOT Analysis
- 12.1.5 Mondi Group
- 12.1.5.1. Company Overview
- 12.1.5.2. Products
- 12.1.5.3. Company Financials
- 12.1.5.4. SWOT Analysis
- 12.1.6 Syntegon Technology GmbH*List Not Exhaustive
- 12.1.6.1. Company Overview
- 12.1.6.2. Products
- 12.1.6.3. Company Financials
- 12.1.6.4. SWOT Analysis
- 12.1.7 Barry-Wehmiller Companies
- 12.1.7.1. Company Overview
- 12.1.7.2. Products
- 12.1.7.3. Company Financials
- 12.1.7.4. SWOT Analysis
- 12.1.8 ULMA Packaging
- 12.1.8.1. Company Overview
- 12.1.8.2. Products
- 12.1.8.3. Company Financials
- 12.1.8.4. SWOT Analysis
- 12.1.9 CV-Tek
- 12.1.9.1. Company Overview
- 12.1.9.2. Products
- 12.1.9.3. Company Financials
- 12.1.9.4. SWOT Analysis
- 12.1.10 Sealed Air Corporation
- 12.1.10.1. Company Overview
- 12.1.10.2. Products
- 12.1.10.3. Company Financials
- 12.1.10.4. SWOT Analysis
- 12.1.1 SEALPAC Schweiz GmbH
- 12.2. Market Entropy
- 12.2.1 Company's Key Areas Served
- 12.2.2 Recent Developments
- 12.3. Company Market Share Analysis 2025
- 12.3.1 Top 5 Companies Market Share Analysis
- 12.3.2 Top 3 Companies Market Share Analysis
- 12.4. List of Potential Customers
- 13. Research Methodology
List of Figures
- Figure 1: Global MAP Packaging Industry Revenue Breakdown (Million, %) by Region 2025 & 2033
- Figure 2: North America MAP Packaging Industry Revenue (Million), by Packaging Gas Type 2025 & 2033
- Figure 3: North America MAP Packaging Industry Revenue Share (%), by Packaging Gas Type 2025 & 2033
- Figure 4: North America MAP Packaging Industry Revenue (Million), by Type of Packaging Material 2025 & 2033
- Figure 5: North America MAP Packaging Industry Revenue Share (%), by Type of Packaging Material 2025 & 2033
- Figure 6: North America MAP Packaging Industry Revenue (Million), by Application 2025 & 2033
- Figure 7: North America MAP Packaging Industry Revenue Share (%), by Application 2025 & 2033
- Figure 8: North America MAP Packaging Industry Revenue (Million), by Country 2025 & 2033
- Figure 9: North America MAP Packaging Industry Revenue Share (%), by Country 2025 & 2033
- Figure 10: South America MAP Packaging Industry Revenue (Million), by Packaging Gas Type 2025 & 2033
- Figure 11: South America MAP Packaging Industry Revenue Share (%), by Packaging Gas Type 2025 & 2033
- Figure 12: South America MAP Packaging Industry Revenue (Million), by Type of Packaging Material 2025 & 2033
- Figure 13: South America MAP Packaging Industry Revenue Share (%), by Type of Packaging Material 2025 & 2033
- Figure 14: South America MAP Packaging Industry Revenue (Million), by Application 2025 & 2033
- Figure 15: South America MAP Packaging Industry Revenue Share (%), by Application 2025 & 2033
- Figure 16: South America MAP Packaging Industry Revenue (Million), by Country 2025 & 2033
- Figure 17: South America MAP Packaging Industry Revenue Share (%), by Country 2025 & 2033
- Figure 18: Europe MAP Packaging Industry Revenue (Million), by Packaging Gas Type 2025 & 2033
- Figure 19: Europe MAP Packaging Industry Revenue Share (%), by Packaging Gas Type 2025 & 2033
- Figure 20: Europe MAP Packaging Industry Revenue (Million), by Type of Packaging Material 2025 & 2033
- Figure 21: Europe MAP Packaging Industry Revenue Share (%), by Type of Packaging Material 2025 & 2033
- Figure 22: Europe MAP Packaging Industry Revenue (Million), by Application 2025 & 2033
- Figure 23: Europe MAP Packaging Industry Revenue Share (%), by Application 2025 & 2033
- Figure 24: Europe MAP Packaging Industry Revenue (Million), by Country 2025 & 2033
- Figure 25: Europe MAP Packaging Industry Revenue Share (%), by Country 2025 & 2033
- Figure 26: Middle East & Africa MAP Packaging Industry Revenue (Million), by Packaging Gas Type 2025 & 2033
- Figure 27: Middle East & Africa MAP Packaging Industry Revenue Share (%), by Packaging Gas Type 2025 & 2033
- Figure 28: Middle East & Africa MAP Packaging Industry Revenue (Million), by Type of Packaging Material 2025 & 2033
- Figure 29: Middle East & Africa MAP Packaging Industry Revenue Share (%), by Type of Packaging Material 2025 & 2033
- Figure 30: Middle East & Africa MAP Packaging Industry Revenue (Million), by Application 2025 & 2033
- Figure 31: Middle East & Africa MAP Packaging Industry Revenue Share (%), by Application 2025 & 2033
- Figure 32: Middle East & Africa MAP Packaging Industry Revenue (Million), by Country 2025 & 2033
- Figure 33: Middle East & Africa MAP Packaging Industry Revenue Share (%), by Country 2025 & 2033
- Figure 34: Asia Pacific MAP Packaging Industry Revenue (Million), by Packaging Gas Type 2025 & 2033
- Figure 35: Asia Pacific MAP Packaging Industry Revenue Share (%), by Packaging Gas Type 2025 & 2033
- Figure 36: Asia Pacific MAP Packaging Industry Revenue (Million), by Type of Packaging Material 2025 & 2033
- Figure 37: Asia Pacific MAP Packaging Industry Revenue Share (%), by Type of Packaging Material 2025 & 2033
- Figure 38: Asia Pacific MAP Packaging Industry Revenue (Million), by Application 2025 & 2033
- Figure 39: Asia Pacific MAP Packaging Industry Revenue Share (%), by Application 2025 & 2033
- Figure 40: Asia Pacific MAP Packaging Industry Revenue (Million), by Country 2025 & 2033
- Figure 41: Asia Pacific MAP Packaging Industry Revenue Share (%), by Country 2025 & 2033
List of Tables
- Table 1: Global MAP Packaging Industry Revenue Million Forecast, by Packaging Gas Type 2020 & 2033
- Table 2: Global MAP Packaging Industry Revenue Million Forecast, by Type of Packaging Material 2020 & 2033
- Table 3: Global MAP Packaging Industry Revenue Million Forecast, by Application 2020 & 2033
- Table 4: Global MAP Packaging Industry Revenue Million Forecast, by Region 2020 & 2033
- Table 5: Global MAP Packaging Industry Revenue Million Forecast, by Packaging Gas Type 2020 & 2033
- Table 6: Global MAP Packaging Industry Revenue Million Forecast, by Type of Packaging Material 2020 & 2033
- Table 7: Global MAP Packaging Industry Revenue Million Forecast, by Application 2020 & 2033
- Table 8: Global MAP Packaging Industry Revenue Million Forecast, by Country 2020 & 2033
- Table 9: United States MAP Packaging Industry Revenue (Million) Forecast, by Application 2020 & 2033
- Table 10: Canada MAP Packaging Industry Revenue (Million) Forecast, by Application 2020 & 2033
- Table 11: Mexico MAP Packaging Industry Revenue (Million) Forecast, by Application 2020 & 2033
- Table 12: Global MAP Packaging Industry Revenue Million Forecast, by Packaging Gas Type 2020 & 2033
- Table 13: Global MAP Packaging Industry Revenue Million Forecast, by Type of Packaging Material 2020 & 2033
- Table 14: Global MAP Packaging Industry Revenue Million Forecast, by Application 2020 & 2033
- Table 15: Global MAP Packaging Industry Revenue Million Forecast, by Country 2020 & 2033
- Table 16: Brazil MAP Packaging Industry Revenue (Million) Forecast, by Application 2020 & 2033
- Table 17: Argentina MAP Packaging Industry Revenue (Million) Forecast, by Application 2020 & 2033
- Table 18: Rest of South America MAP Packaging Industry Revenue (Million) Forecast, by Application 2020 & 2033
- Table 19: Global MAP Packaging Industry Revenue Million Forecast, by Packaging Gas Type 2020 & 2033
- Table 20: Global MAP Packaging Industry Revenue Million Forecast, by Type of Packaging Material 2020 & 2033
- Table 21: Global MAP Packaging Industry Revenue Million Forecast, by Application 2020 & 2033
- Table 22: Global MAP Packaging Industry Revenue Million Forecast, by Country 2020 & 2033
- Table 23: United Kingdom MAP Packaging Industry Revenue (Million) Forecast, by Application 2020 & 2033
- Table 24: Germany MAP Packaging Industry Revenue (Million) Forecast, by Application 2020 & 2033
- Table 25: France MAP Packaging Industry Revenue (Million) Forecast, by Application 2020 & 2033
- Table 26: Italy MAP Packaging Industry Revenue (Million) Forecast, by Application 2020 & 2033
- Table 27: Spain MAP Packaging Industry Revenue (Million) Forecast, by Application 2020 & 2033
- Table 28: Russia MAP Packaging Industry Revenue (Million) Forecast, by Application 2020 & 2033
- Table 29: Benelux MAP Packaging Industry Revenue (Million) Forecast, by Application 2020 & 2033
- Table 30: Nordics MAP Packaging Industry Revenue (Million) Forecast, by Application 2020 & 2033
- Table 31: Rest of Europe MAP Packaging Industry Revenue (Million) Forecast, by Application 2020 & 2033
- Table 32: Global MAP Packaging Industry Revenue Million Forecast, by Packaging Gas Type 2020 & 2033
- Table 33: Global MAP Packaging Industry Revenue Million Forecast, by Type of Packaging Material 2020 & 2033
- Table 34: Global MAP Packaging Industry Revenue Million Forecast, by Application 2020 & 2033
- Table 35: Global MAP Packaging Industry Revenue Million Forecast, by Country 2020 & 2033
- Table 36: Turkey MAP Packaging Industry Revenue (Million) Forecast, by Application 2020 & 2033
- Table 37: Israel MAP Packaging Industry Revenue (Million) Forecast, by Application 2020 & 2033
- Table 38: GCC MAP Packaging Industry Revenue (Million) Forecast, by Application 2020 & 2033
- Table 39: North Africa MAP Packaging Industry Revenue (Million) Forecast, by Application 2020 & 2033
- Table 40: South Africa MAP Packaging Industry Revenue (Million) Forecast, by Application 2020 & 2033
- Table 41: Rest of Middle East & Africa MAP Packaging Industry Revenue (Million) Forecast, by Application 2020 & 2033
- Table 42: Global MAP Packaging Industry Revenue Million Forecast, by Packaging Gas Type 2020 & 2033
- Table 43: Global MAP Packaging Industry Revenue Million Forecast, by Type of Packaging Material 2020 & 2033
- Table 44: Global MAP Packaging Industry Revenue Million Forecast, by Application 2020 & 2033
- Table 45: Global MAP Packaging Industry Revenue Million Forecast, by Country 2020 & 2033
- Table 46: China MAP Packaging Industry Revenue (Million) Forecast, by Application 2020 & 2033
- Table 47: India MAP Packaging Industry Revenue (Million) Forecast, by Application 2020 & 2033
- Table 48: Japan MAP Packaging Industry Revenue (Million) Forecast, by Application 2020 & 2033
- Table 49: South Korea MAP Packaging Industry Revenue (Million) Forecast, by Application 2020 & 2033
- Table 50: ASEAN MAP Packaging Industry Revenue (Million) Forecast, by Application 2020 & 2033
- Table 51: Oceania MAP Packaging Industry Revenue (Million) Forecast, by Application 2020 & 2033
- Table 52: Rest of Asia Pacific MAP Packaging Industry Revenue (Million) Forecast, by Application 2020 & 2033
Frequently Asked Questions
1. What is the projected Compound Annual Growth Rate (CAGR) of the MAP Packaging Industry?
The projected CAGR is approximately 5.30%.
2. Which companies are prominent players in the MAP Packaging Industry?
Key companies in the market include SEALPAC Schweiz GmbH, Linde AG, Air Products and Chemicals Inc, Amcor Plc, Mondi Group, Syntegon Technology GmbH*List Not Exhaustive, Barry-Wehmiller Companies, ULMA Packaging, CV-Tek, Sealed Air Corporation.
3. What are the main segments of the MAP Packaging Industry?
The market segments include Packaging Gas Type, Type of Packaging Material, Application.
4. Can you provide details about the market size?
The market size is estimated to be USD XX Million as of 2022.
5. What are some drivers contributing to market growth?
; Increasing demand for longer shelf life; Rising demand for ready to eat food products in European countries.
6. What are the notable trends driving market growth?
Poultry. Seafood & Meat Products are Expected to Hold a Significant Share in the European Market.
7. Are there any restraints impacting market growth?
; Significantly higher cost of MAP related equipments.
8. Can you provide examples of recent developments in the market?
N/A
9. What pricing options are available for accessing the report?
Pricing options include single-user, multi-user, and enterprise licenses priced at USD 4750, USD 4950, and USD 6800 respectively.
10. Is the market size provided in terms of value or volume?
The market size is provided in terms of value, measured in Million.
11. Are there any specific market keywords associated with the report?
Yes, the market keyword associated with the report is "MAP Packaging Industry," which aids in identifying and referencing the specific market segment covered.
12. How do I determine which pricing option suits my needs best?
The pricing options vary based on user requirements and access needs. Individual users may opt for single-user licenses, while businesses requiring broader access may choose multi-user or enterprise licenses for cost-effective access to the report.
13. Are there any additional resources or data provided in the MAP Packaging Industry report?
While the report offers comprehensive insights, it's advisable to review the specific contents or supplementary materials provided to ascertain if additional resources or data are available.
14. How can I stay updated on further developments or reports in the MAP Packaging Industry?
To stay informed about further developments, trends, and reports in the MAP Packaging Industry, consider subscribing to industry newsletters, following relevant companies and organizations, or regularly checking reputable industry news sources and publications.
Methodology
Step 1 - Identification of Relevant Samples Size from Population Database


Step 2 - Approaches for Defining Global Market Size (Value, Volume* & Price*)

Note*: In applicable scenarios
Step 3 - Data Sources
Primary Research
- Web Analytics
- Survey Reports
- Research Institute
- Latest Research Reports
- Opinion Leaders
Secondary Research
- Annual Reports
- White Paper
- Latest Press Release
- Industry Association
- Paid Database
- Investor Presentations

Step 4 - Data Triangulation
Involves using different sources of information in order to increase the validity of a study
These sources are likely to be stakeholders in a program - participants, other researchers, program staff, other community members, and so on.
Then we put all data in single framework & apply various statistical tools to find out the dynamic on the market.
During the analysis stage, feedback from the stakeholder groups would be compared to determine areas of agreement as well as areas of divergence