

Key Insights
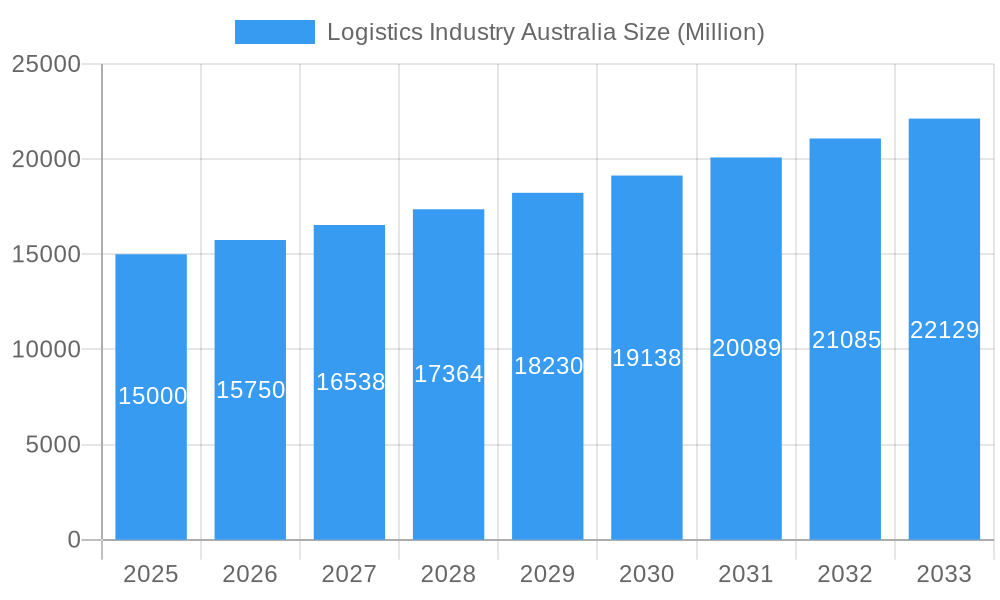
The Australian logistics industry is projected for robust expansion, driven by a burgeoning e-commerce sector, significant demand from agriculture, mining, and construction, and the increasing need for temperature-controlled solutions. Key growth drivers include efficient last-mile delivery, essential raw material and finished goods transportation, and specialized cold-chain services for pharmaceuticals and perishables. While infrastructure limitations and fuel price volatility pose challenges, technological advancements in automation and data analytics are crucial for optimizing operations and maintaining a competitive edge. The market is expected to grow at a Compound Annual Growth Rate (CAGR) exceeding 5% from 2025 to 2033. The market size is projected to reach $137.7 billion by 2033, with 2025 as the base year.
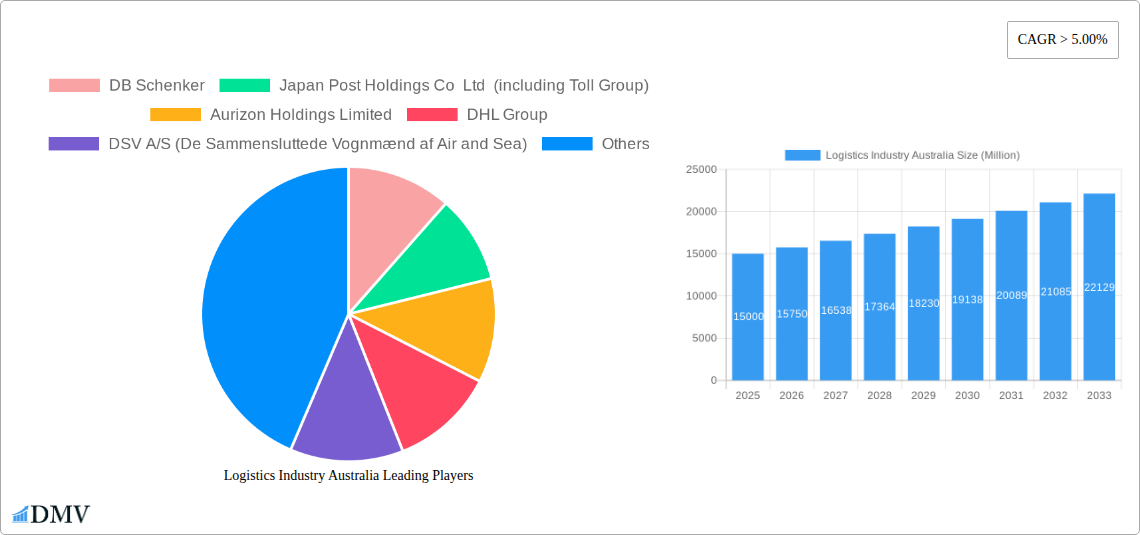
Logistics Industry Australia Market Size (In Billion)
Market segmentation highlights significant opportunities within the Courier, Express, and Parcel (CEP) segment, propelled by e-commerce. Temperature-controlled logistics is another high-growth area due to stringent regulatory demands and expanding cold-chain requirements. Key end-user industries like mining and construction offer substantial potential due to large-scale operations and ongoing infrastructure projects. While a skilled labor shortage exists, technological solutions are mitigating its impact. Understanding these dynamics and competitive forces is vital for navigating the Australian logistics market's trajectory.
Logistics Industry Australia Company Market Share
Australian Logistics Market Analysis and Forecast: 2025-2033
This report offers a detailed analysis of the Australian logistics market, covering market size, growth trends, key players, and future opportunities. Covering the period 2019-2033, with a focus on 2025, this report provides actionable insights for supply chain stakeholders. The total market is estimated at $137.7 billion in 2025, demonstrating significant growth potential.
Logistics Industry Australia Market Composition & Trends
The Australian logistics market is characterized by a moderate level of concentration, with a few major players commanding significant market share, while numerous smaller companies cater to niche segments. Market share distribution in 2025 is estimated as follows: Toll Group (15%), DHL (12%), FedEx (10%), Linfox (8%), and others (45%). Innovation is driven by the adoption of advanced technologies like AI, IoT, and automation to enhance efficiency and traceability. The regulatory landscape is evolving, with a focus on sustainability and data privacy. Substitute products, such as direct-to-consumer shipping models and decentralized logistics networks, are emerging, presenting both challenges and opportunities. End-user industries such as Manufacturing, Wholesale and Retail Trade, and Mining and Quarrying contribute the largest portion of the market volume, driving demand for various logistics functions. M&A activity has been significant, with deal values exceeding xx Million in the last five years, particularly in the consolidation of smaller players and expansion into new service offerings.
- Market Concentration: Moderate, with top 5 players holding approximately 45% market share in 2025.
- Innovation Catalysts: AI, IoT, automation, and sustainable logistics solutions.
- Regulatory Landscape: Focus on sustainability, data privacy, and safety standards.
- Substitute Products: Direct-to-consumer shipping, decentralized logistics networks.
- End-User Profiles: Manufacturing, Wholesale & Retail Trade, Mining & Quarrying are key segments.
- M&A Activity: Significant consolidation, with deal values exceeding xx Million since 2019.
Logistics Industry Australia Industry Evolution
The Australian logistics market is experiencing robust growth, driven by e-commerce expansion, rising consumer expectations, and increasing globalization. The historical period (2019-2024) witnessed a Compound Annual Growth Rate (CAGR) of xx%, while the forecast period (2025-2033) projects a CAGR of xx%. Technological advancements, such as the integration of blockchain technology for enhanced transparency and traceability and the adoption of autonomous vehicles, are reshaping the industry landscape. Furthermore, shifting consumer demands for faster delivery times, increased transparency, and personalized services are compelling logistics providers to innovate and adapt their operations. The adoption of digital technologies such as warehouse management systems (WMS) and transportation management systems (TMS) is accelerating, improving efficiency and visibility across the supply chain. The market has shown considerable growth in the temperature-controlled logistics segment due to the increasing demand for perishable goods and pharmaceuticals.
Leading Regions, Countries, or Segments in Logistics Industry Australia
The dominance of specific regions, countries, or segments within the Australian logistics market is primarily influenced by factors such as infrastructure development, economic activity, and regulatory support.
- End-User Industry: Manufacturing, Wholesale and Retail Trade, and Mining & Quarrying are the leading segments due to their high volume of goods movement and associated logistical needs.
- Logistics Function: Courier, Express, and Parcel (CEP) services are dominant, driven by e-commerce growth. Temperature-controlled logistics is experiencing significant growth due to the rise of perishable goods and pharmaceuticals.
- Key Drivers: Government infrastructure investments, growing e-commerce, and robust economic activity in key regions contribute to segment dominance.
Dominance Factors: High population density in urban areas, well-developed infrastructure in major cities, and strong economic activity in specific states like New South Wales and Victoria contribute to the dominance of these regions. The robust growth of e-commerce has fueled the demand for CEP services, while the increasing demand for temperature-sensitive goods across various industries has driven the growth in the temperature-controlled logistics segment.
Logistics Industry Australia Product Innovations
Recent product innovations focus on enhancing efficiency, sustainability, and customer experience. Companies are increasingly adopting advanced technologies such as AI-powered route optimization software, real-time tracking systems, and automated warehouse solutions. These innovations offer faster delivery times, reduced costs, improved visibility, and enhanced transparency across the supply chain. The unique selling propositions of these products include their ability to streamline operations, optimize resource allocation, and enhance overall supply chain efficiency.
Propelling Factors for Logistics Industry Australia Growth
Several factors contribute to the growth of the Australian logistics industry. Firstly, the booming e-commerce sector continuously fuels demand for efficient and reliable delivery services. Secondly, government investments in infrastructure projects, such as port expansions and road upgrades, are enhancing logistics capabilities. Thirdly, the increasing adoption of advanced technologies, including automation and data analytics, is driving efficiency and productivity gains. Finally, the ongoing growth of key end-user industries like manufacturing and mining continues to support logistics market expansion.
Obstacles in the Logistics Industry Australia Market
The Australian logistics industry faces challenges such as infrastructure limitations in certain regions, leading to delays and increased transportation costs. The rising fuel prices and labor shortages contribute to increased operational expenses. Moreover, intense competition among logistics providers necessitates continuous innovation and cost optimization strategies. These factors can impact profitability and market share, highlighting the need for adaptability and resilience within the industry.
Future Opportunities in Logistics Industry Australia
The Australian logistics market presents several future opportunities. The expanding e-commerce sector offers significant potential for growth in last-mile delivery and related services. The growing adoption of sustainable logistics practices, such as electric vehicle fleets and optimized delivery routes, presents opportunities for companies focusing on environmentally friendly solutions. Finally, technological advancements, including automation and AI, offer avenues for enhanced efficiency and improved service offerings.
Major Players in the Logistics Industry Australia Ecosystem
- DB Schenker
- Japan Post Holdings Co Ltd (including Toll Group)
- Aurizon Holdings Limited
- DHL Group
- DSV A/S (De Sammensluttede Vognmænd af Air and Sea)
- FedEx
- Qube Holdings Ltd
- LINX Cargo Care Group
- Kuehne + Nagel
- Linfox Pty Ltd
- K&S Corporation Limited
- Toll Grou
- Centurion Transport
Key Developments in Logistics Industry Australia Industry
- January 2024: DHL Express deploys its final Boeing 777 freighter in Singapore, significantly boosting Asia-Pacific to Americas connectivity and increasing payload capacity by 1224 tons.
- January 2024: Kuehne + Nagel launches its Book & Claim insetting solution for electric vehicles, offering customers carbon reduction claims for road freight even without physically using electric trucks.
- February 2024: DHL Supply Chain introduces new electric vehicles to its Australian fleet, including electric yard tractors and light duty trucks, furthering its decarbonization efforts and supporting Australian electric vehicle manufacturing.
Strategic Logistics Industry Australia Market Forecast
The Australian logistics market is poised for continued growth, driven by e-commerce expansion, technological advancements, and increasing focus on sustainability. The forecast period (2025-2033) projects a robust CAGR, reflecting significant market potential and attractive investment opportunities for companies willing to adapt to the evolving industry landscape. The increasing adoption of advanced technologies, strategic infrastructure investments, and a growing focus on sustainability will create new avenues for growth and efficiency, ultimately enhancing the resilience and competitiveness of the Australian logistics industry.
Logistics Industry Australia Segmentation
-
1. End User Industry
- 1.1. Agriculture, Fishing, and Forestry
- 1.2. Construction
- 1.3. Manufacturing
- 1.4. Oil and Gas, Mining and Quarrying
- 1.5. Wholesale and Retail Trade
- 1.6. Others
-
2. Logistics Function
-
2.1. Courier, Express, and Parcel (CEP)
-
2.1.1. By Destination Type
- 2.1.1.1. Domestic
- 2.1.1.2. International
-
2.1.1. By Destination Type
-
2.2. Freight Forwarding
-
2.2.1. By Mode Of Transport
- 2.2.1.1. Air
- 2.2.1.2. Sea and Inland Waterways
- 2.2.1.3. Others
-
2.2.1. By Mode Of Transport
-
2.3. Freight Transport
- 2.3.1. Pipelines
- 2.3.2. Rail
- 2.3.3. Road
-
2.4. Warehousing and Storage
-
2.4.1. By Temperature Control
- 2.4.1.1. Non-Temperature Controlled
-
2.4.1. By Temperature Control
- 2.5. Other Services
-
2.1. Courier, Express, and Parcel (CEP)
Logistics Industry Australia Segmentation By Geography
-
1. North America
- 1.1. United States
- 1.2. Canada
- 1.3. Mexico
-
2. South America
- 2.1. Brazil
- 2.2. Argentina
- 2.3. Rest of South America
-
3. Europe
- 3.1. United Kingdom
- 3.2. Germany
- 3.3. France
- 3.4. Italy
- 3.5. Spain
- 3.6. Russia
- 3.7. Benelux
- 3.8. Nordics
- 3.9. Rest of Europe
-
4. Middle East & Africa
- 4.1. Turkey
- 4.2. Israel
- 4.3. GCC
- 4.4. North Africa
- 4.5. South Africa
- 4.6. Rest of Middle East & Africa
-
5. Asia Pacific
- 5.1. China
- 5.2. India
- 5.3. Japan
- 5.4. South Korea
- 5.5. ASEAN
- 5.6. Oceania
- 5.7. Rest of Asia Pacific
Logistics Industry Australia Regional Market Share
Geographic Coverage of Logistics Industry Australia
Logistics Industry Australia REPORT HIGHLIGHTS
| Aspects | Details |
|---|---|
| Study Period | 2020-2034 |
| Base Year | 2025 |
| Estimated Year | 2026 |
| Forecast Period | 2026-2034 |
| Historical Period | 2020-2025 |
| Growth Rate | CAGR of 1% from 2020-2034 |
| Segmentation |
|
Table of Contents
- 1. Introduction
- 1.1. Research Scope
- 1.2. Market Segmentation
- 1.3. Research Objective
- 1.4. Definitions and Assumptions
- 2. Executive Summary
- 2.1. Market Snapshot
- 3. Market Dynamics
- 3.1. Market Drivers
- 3.2. Market Restrains
- 3.3. Market Trends
- 3.4. Market Opportunities
- 4. Market Factor Analysis
- 4.1. Porters Five Forces
- 4.1.1. Bargaining Power of Suppliers
- 4.1.2. Bargaining Power of Buyers
- 4.1.3. Threat of New Entrants
- 4.1.4. Threat of Substitutes
- 4.1.5. Competitive Rivalry
- 4.2. PESTEL analysis
- 4.3. BCG Analysis
- 4.3.1. Stars (High Growth, High Market Share)
- 4.3.2. Cash Cows (Low Growth, High Market Share)
- 4.3.3. Question Mark (High Growth, Low Market Share)
- 4.3.4. Dogs (Low Growth, Low Market Share)
- 4.4. Ansoff Matrix Analysis
- 4.5. Supply Chain Analysis
- 4.6. Regulatory Landscape
- 4.7. Current Market Potential and Opportunity Assessment (TAM–SAM–SOM Framework)
- 4.8. DMV Analyst Note
- 4.1. Porters Five Forces
- 5. Market Analysis, Insights and Forecast 2021-2033
- 5.1. Market Analysis, Insights and Forecast - by End User Industry
- 5.1.1. Agriculture, Fishing, and Forestry
- 5.1.2. Construction
- 5.1.3. Manufacturing
- 5.1.4. Oil and Gas, Mining and Quarrying
- 5.1.5. Wholesale and Retail Trade
- 5.1.6. Others
- 5.2. Market Analysis, Insights and Forecast - by Logistics Function
- 5.2.1. Courier, Express, and Parcel (CEP)
- 5.2.1.1. By Destination Type
- 5.2.1.1.1. Domestic
- 5.2.1.1.2. International
- 5.2.1.1. By Destination Type
- 5.2.2. Freight Forwarding
- 5.2.2.1. By Mode Of Transport
- 5.2.2.1.1. Air
- 5.2.2.1.2. Sea and Inland Waterways
- 5.2.2.1.3. Others
- 5.2.2.1. By Mode Of Transport
- 5.2.3. Freight Transport
- 5.2.3.1. Pipelines
- 5.2.3.2. Rail
- 5.2.3.3. Road
- 5.2.4. Warehousing and Storage
- 5.2.4.1. By Temperature Control
- 5.2.4.1.1. Non-Temperature Controlled
- 5.2.4.1. By Temperature Control
- 5.2.5. Other Services
- 5.2.1. Courier, Express, and Parcel (CEP)
- 5.3. Market Analysis, Insights and Forecast - by Region
- 5.3.1. North America
- 5.3.2. South America
- 5.3.3. Europe
- 5.3.4. Middle East & Africa
- 5.3.5. Asia Pacific
- 5.1. Market Analysis, Insights and Forecast - by End User Industry
- 6. Global Logistics Industry Australia Analysis, Insights and Forecast, 2021-2033
- 6.1. Market Analysis, Insights and Forecast - by End User Industry
- 6.1.1. Agriculture, Fishing, and Forestry
- 6.1.2. Construction
- 6.1.3. Manufacturing
- 6.1.4. Oil and Gas, Mining and Quarrying
- 6.1.5. Wholesale and Retail Trade
- 6.1.6. Others
- 6.2. Market Analysis, Insights and Forecast - by Logistics Function
- 6.2.1. Courier, Express, and Parcel (CEP)
- 6.2.1.1. By Destination Type
- 6.2.1.1.1. Domestic
- 6.2.1.1.2. International
- 6.2.1.1. By Destination Type
- 6.2.2. Freight Forwarding
- 6.2.2.1. By Mode Of Transport
- 6.2.2.1.1. Air
- 6.2.2.1.2. Sea and Inland Waterways
- 6.2.2.1.3. Others
- 6.2.2.1. By Mode Of Transport
- 6.2.3. Freight Transport
- 6.2.3.1. Pipelines
- 6.2.3.2. Rail
- 6.2.3.3. Road
- 6.2.4. Warehousing and Storage
- 6.2.4.1. By Temperature Control
- 6.2.4.1.1. Non-Temperature Controlled
- 6.2.4.1. By Temperature Control
- 6.2.5. Other Services
- 6.2.1. Courier, Express, and Parcel (CEP)
- 6.1. Market Analysis, Insights and Forecast - by End User Industry
- 7. North America Logistics Industry Australia Analysis, Insights and Forecast, 2020-2032
- 7.1. Market Analysis, Insights and Forecast - by End User Industry
- 7.1.1. Agriculture, Fishing, and Forestry
- 7.1.2. Construction
- 7.1.3. Manufacturing
- 7.1.4. Oil and Gas, Mining and Quarrying
- 7.1.5. Wholesale and Retail Trade
- 7.1.6. Others
- 7.2. Market Analysis, Insights and Forecast - by Logistics Function
- 7.2.1. Courier, Express, and Parcel (CEP)
- 7.2.1.1. By Destination Type
- 7.2.1.1.1. Domestic
- 7.2.1.1.2. International
- 7.2.1.1. By Destination Type
- 7.2.2. Freight Forwarding
- 7.2.2.1. By Mode Of Transport
- 7.2.2.1.1. Air
- 7.2.2.1.2. Sea and Inland Waterways
- 7.2.2.1.3. Others
- 7.2.2.1. By Mode Of Transport
- 7.2.3. Freight Transport
- 7.2.3.1. Pipelines
- 7.2.3.2. Rail
- 7.2.3.3. Road
- 7.2.4. Warehousing and Storage
- 7.2.4.1. By Temperature Control
- 7.2.4.1.1. Non-Temperature Controlled
- 7.2.4.1. By Temperature Control
- 7.2.5. Other Services
- 7.2.1. Courier, Express, and Parcel (CEP)
- 7.1. Market Analysis, Insights and Forecast - by End User Industry
- 8. South America Logistics Industry Australia Analysis, Insights and Forecast, 2020-2032
- 8.1. Market Analysis, Insights and Forecast - by End User Industry
- 8.1.1. Agriculture, Fishing, and Forestry
- 8.1.2. Construction
- 8.1.3. Manufacturing
- 8.1.4. Oil and Gas, Mining and Quarrying
- 8.1.5. Wholesale and Retail Trade
- 8.1.6. Others
- 8.2. Market Analysis, Insights and Forecast - by Logistics Function
- 8.2.1. Courier, Express, and Parcel (CEP)
- 8.2.1.1. By Destination Type
- 8.2.1.1.1. Domestic
- 8.2.1.1.2. International
- 8.2.1.1. By Destination Type
- 8.2.2. Freight Forwarding
- 8.2.2.1. By Mode Of Transport
- 8.2.2.1.1. Air
- 8.2.2.1.2. Sea and Inland Waterways
- 8.2.2.1.3. Others
- 8.2.2.1. By Mode Of Transport
- 8.2.3. Freight Transport
- 8.2.3.1. Pipelines
- 8.2.3.2. Rail
- 8.2.3.3. Road
- 8.2.4. Warehousing and Storage
- 8.2.4.1. By Temperature Control
- 8.2.4.1.1. Non-Temperature Controlled
- 8.2.4.1. By Temperature Control
- 8.2.5. Other Services
- 8.2.1. Courier, Express, and Parcel (CEP)
- 8.1. Market Analysis, Insights and Forecast - by End User Industry
- 9. Europe Logistics Industry Australia Analysis, Insights and Forecast, 2020-2032
- 9.1. Market Analysis, Insights and Forecast - by End User Industry
- 9.1.1. Agriculture, Fishing, and Forestry
- 9.1.2. Construction
- 9.1.3. Manufacturing
- 9.1.4. Oil and Gas, Mining and Quarrying
- 9.1.5. Wholesale and Retail Trade
- 9.1.6. Others
- 9.2. Market Analysis, Insights and Forecast - by Logistics Function
- 9.2.1. Courier, Express, and Parcel (CEP)
- 9.2.1.1. By Destination Type
- 9.2.1.1.1. Domestic
- 9.2.1.1.2. International
- 9.2.1.1. By Destination Type
- 9.2.2. Freight Forwarding
- 9.2.2.1. By Mode Of Transport
- 9.2.2.1.1. Air
- 9.2.2.1.2. Sea and Inland Waterways
- 9.2.2.1.3. Others
- 9.2.2.1. By Mode Of Transport
- 9.2.3. Freight Transport
- 9.2.3.1. Pipelines
- 9.2.3.2. Rail
- 9.2.3.3. Road
- 9.2.4. Warehousing and Storage
- 9.2.4.1. By Temperature Control
- 9.2.4.1.1. Non-Temperature Controlled
- 9.2.4.1. By Temperature Control
- 9.2.5. Other Services
- 9.2.1. Courier, Express, and Parcel (CEP)
- 9.1. Market Analysis, Insights and Forecast - by End User Industry
- 10. Middle East & Africa Logistics Industry Australia Analysis, Insights and Forecast, 2020-2032
- 10.1. Market Analysis, Insights and Forecast - by End User Industry
- 10.1.1. Agriculture, Fishing, and Forestry
- 10.1.2. Construction
- 10.1.3. Manufacturing
- 10.1.4. Oil and Gas, Mining and Quarrying
- 10.1.5. Wholesale and Retail Trade
- 10.1.6. Others
- 10.2. Market Analysis, Insights and Forecast - by Logistics Function
- 10.2.1. Courier, Express, and Parcel (CEP)
- 10.2.1.1. By Destination Type
- 10.2.1.1.1. Domestic
- 10.2.1.1.2. International
- 10.2.1.1. By Destination Type
- 10.2.2. Freight Forwarding
- 10.2.2.1. By Mode Of Transport
- 10.2.2.1.1. Air
- 10.2.2.1.2. Sea and Inland Waterways
- 10.2.2.1.3. Others
- 10.2.2.1. By Mode Of Transport
- 10.2.3. Freight Transport
- 10.2.3.1. Pipelines
- 10.2.3.2. Rail
- 10.2.3.3. Road
- 10.2.4. Warehousing and Storage
- 10.2.4.1. By Temperature Control
- 10.2.4.1.1. Non-Temperature Controlled
- 10.2.4.1. By Temperature Control
- 10.2.5. Other Services
- 10.2.1. Courier, Express, and Parcel (CEP)
- 10.1. Market Analysis, Insights and Forecast - by End User Industry
- 11. Asia Pacific Logistics Industry Australia Analysis, Insights and Forecast, 2020-2032
- 11.1. Market Analysis, Insights and Forecast - by End User Industry
- 11.1.1. Agriculture, Fishing, and Forestry
- 11.1.2. Construction
- 11.1.3. Manufacturing
- 11.1.4. Oil and Gas, Mining and Quarrying
- 11.1.5. Wholesale and Retail Trade
- 11.1.6. Others
- 11.2. Market Analysis, Insights and Forecast - by Logistics Function
- 11.2.1. Courier, Express, and Parcel (CEP)
- 11.2.1.1. By Destination Type
- 11.2.1.1.1. Domestic
- 11.2.1.1.2. International
- 11.2.1.1. By Destination Type
- 11.2.2. Freight Forwarding
- 11.2.2.1. By Mode Of Transport
- 11.2.2.1.1. Air
- 11.2.2.1.2. Sea and Inland Waterways
- 11.2.2.1.3. Others
- 11.2.2.1. By Mode Of Transport
- 11.2.3. Freight Transport
- 11.2.3.1. Pipelines
- 11.2.3.2. Rail
- 11.2.3.3. Road
- 11.2.4. Warehousing and Storage
- 11.2.4.1. By Temperature Control
- 11.2.4.1.1. Non-Temperature Controlled
- 11.2.4.1. By Temperature Control
- 11.2.5. Other Services
- 11.2.1. Courier, Express, and Parcel (CEP)
- 11.1. Market Analysis, Insights and Forecast - by End User Industry
- 12. Competitive Analysis
- 12.1. Company Profiles
- 12.1.1 DB Schenker
- 12.1.1.1. Company Overview
- 12.1.1.2. Products
- 12.1.1.3. Company Financials
- 12.1.1.4. SWOT Analysis
- 12.1.2 Japan Post Holdings Co Ltd (including Toll Group)
- 12.1.2.1. Company Overview
- 12.1.2.2. Products
- 12.1.2.3. Company Financials
- 12.1.2.4. SWOT Analysis
- 12.1.3 Aurizon Holdings Limited
- 12.1.3.1. Company Overview
- 12.1.3.2. Products
- 12.1.3.3. Company Financials
- 12.1.3.4. SWOT Analysis
- 12.1.4 DHL Group
- 12.1.4.1. Company Overview
- 12.1.4.2. Products
- 12.1.4.3. Company Financials
- 12.1.4.4. SWOT Analysis
- 12.1.5 DSV A/S (De Sammensluttede Vognmænd af Air and Sea)
- 12.1.5.1. Company Overview
- 12.1.5.2. Products
- 12.1.5.3. Company Financials
- 12.1.5.4. SWOT Analysis
- 12.1.6 FedEx
- 12.1.6.1. Company Overview
- 12.1.6.2. Products
- 12.1.6.3. Company Financials
- 12.1.6.4. SWOT Analysis
- 12.1.7 Qube Holdings Ltd
- 12.1.7.1. Company Overview
- 12.1.7.2. Products
- 12.1.7.3. Company Financials
- 12.1.7.4. SWOT Analysis
- 12.1.8 LINX Cargo Care Group
- 12.1.8.1. Company Overview
- 12.1.8.2. Products
- 12.1.8.3. Company Financials
- 12.1.8.4. SWOT Analysis
- 12.1.9 Kuehne + Nagel
- 12.1.9.1. Company Overview
- 12.1.9.2. Products
- 12.1.9.3. Company Financials
- 12.1.9.4. SWOT Analysis
- 12.1.10 Linfox Pty Ltd
- 12.1.10.1. Company Overview
- 12.1.10.2. Products
- 12.1.10.3. Company Financials
- 12.1.10.4. SWOT Analysis
- 12.1.11 K&S Corporation Limited
- 12.1.11.1. Company Overview
- 12.1.11.2. Products
- 12.1.11.3. Company Financials
- 12.1.11.4. SWOT Analysis
- 12.1.12 Toll Grou
- 12.1.12.1. Company Overview
- 12.1.12.2. Products
- 12.1.12.3. Company Financials
- 12.1.12.4. SWOT Analysis
- 12.1.13 Centurion Transport
- 12.1.13.1. Company Overview
- 12.1.13.2. Products
- 12.1.13.3. Company Financials
- 12.1.13.4. SWOT Analysis
- 12.1.1 DB Schenker
- 12.2. Market Entropy
- 12.2.1 Company's Key Areas Served
- 12.2.2 Recent Developments
- 12.3. Company Market Share Analysis 2025
- 12.3.1 Top 5 Companies Market Share Analysis
- 12.3.2 Top 3 Companies Market Share Analysis
- 12.4. List of Potential Customers
- 13. Research Methodology
List of Figures
- Figure 1: Global Logistics Industry Australia Revenue Breakdown (billion, %) by Region 2025 & 2033
- Figure 2: North America Logistics Industry Australia Revenue (billion), by End User Industry 2025 & 2033
- Figure 3: North America Logistics Industry Australia Revenue Share (%), by End User Industry 2025 & 2033
- Figure 4: North America Logistics Industry Australia Revenue (billion), by Logistics Function 2025 & 2033
- Figure 5: North America Logistics Industry Australia Revenue Share (%), by Logistics Function 2025 & 2033
- Figure 6: North America Logistics Industry Australia Revenue (billion), by Country 2025 & 2033
- Figure 7: North America Logistics Industry Australia Revenue Share (%), by Country 2025 & 2033
- Figure 8: South America Logistics Industry Australia Revenue (billion), by End User Industry 2025 & 2033
- Figure 9: South America Logistics Industry Australia Revenue Share (%), by End User Industry 2025 & 2033
- Figure 10: South America Logistics Industry Australia Revenue (billion), by Logistics Function 2025 & 2033
- Figure 11: South America Logistics Industry Australia Revenue Share (%), by Logistics Function 2025 & 2033
- Figure 12: South America Logistics Industry Australia Revenue (billion), by Country 2025 & 2033
- Figure 13: South America Logistics Industry Australia Revenue Share (%), by Country 2025 & 2033
- Figure 14: Europe Logistics Industry Australia Revenue (billion), by End User Industry 2025 & 2033
- Figure 15: Europe Logistics Industry Australia Revenue Share (%), by End User Industry 2025 & 2033
- Figure 16: Europe Logistics Industry Australia Revenue (billion), by Logistics Function 2025 & 2033
- Figure 17: Europe Logistics Industry Australia Revenue Share (%), by Logistics Function 2025 & 2033
- Figure 18: Europe Logistics Industry Australia Revenue (billion), by Country 2025 & 2033
- Figure 19: Europe Logistics Industry Australia Revenue Share (%), by Country 2025 & 2033
- Figure 20: Middle East & Africa Logistics Industry Australia Revenue (billion), by End User Industry 2025 & 2033
- Figure 21: Middle East & Africa Logistics Industry Australia Revenue Share (%), by End User Industry 2025 & 2033
- Figure 22: Middle East & Africa Logistics Industry Australia Revenue (billion), by Logistics Function 2025 & 2033
- Figure 23: Middle East & Africa Logistics Industry Australia Revenue Share (%), by Logistics Function 2025 & 2033
- Figure 24: Middle East & Africa Logistics Industry Australia Revenue (billion), by Country 2025 & 2033
- Figure 25: Middle East & Africa Logistics Industry Australia Revenue Share (%), by Country 2025 & 2033
- Figure 26: Asia Pacific Logistics Industry Australia Revenue (billion), by End User Industry 2025 & 2033
- Figure 27: Asia Pacific Logistics Industry Australia Revenue Share (%), by End User Industry 2025 & 2033
- Figure 28: Asia Pacific Logistics Industry Australia Revenue (billion), by Logistics Function 2025 & 2033
- Figure 29: Asia Pacific Logistics Industry Australia Revenue Share (%), by Logistics Function 2025 & 2033
- Figure 30: Asia Pacific Logistics Industry Australia Revenue (billion), by Country 2025 & 2033
- Figure 31: Asia Pacific Logistics Industry Australia Revenue Share (%), by Country 2025 & 2033
List of Tables
- Table 1: Global Logistics Industry Australia Revenue billion Forecast, by End User Industry 2020 & 2033
- Table 2: Global Logistics Industry Australia Revenue billion Forecast, by Logistics Function 2020 & 2033
- Table 3: Global Logistics Industry Australia Revenue billion Forecast, by Region 2020 & 2033
- Table 4: Global Logistics Industry Australia Revenue billion Forecast, by End User Industry 2020 & 2033
- Table 5: Global Logistics Industry Australia Revenue billion Forecast, by Logistics Function 2020 & 2033
- Table 6: Global Logistics Industry Australia Revenue billion Forecast, by Country 2020 & 2033
- Table 7: United States Logistics Industry Australia Revenue (billion) Forecast, by Application 2020 & 2033
- Table 8: Canada Logistics Industry Australia Revenue (billion) Forecast, by Application 2020 & 2033
- Table 9: Mexico Logistics Industry Australia Revenue (billion) Forecast, by Application 2020 & 2033
- Table 10: Global Logistics Industry Australia Revenue billion Forecast, by End User Industry 2020 & 2033
- Table 11: Global Logistics Industry Australia Revenue billion Forecast, by Logistics Function 2020 & 2033
- Table 12: Global Logistics Industry Australia Revenue billion Forecast, by Country 2020 & 2033
- Table 13: Brazil Logistics Industry Australia Revenue (billion) Forecast, by Application 2020 & 2033
- Table 14: Argentina Logistics Industry Australia Revenue (billion) Forecast, by Application 2020 & 2033
- Table 15: Rest of South America Logistics Industry Australia Revenue (billion) Forecast, by Application 2020 & 2033
- Table 16: Global Logistics Industry Australia Revenue billion Forecast, by End User Industry 2020 & 2033
- Table 17: Global Logistics Industry Australia Revenue billion Forecast, by Logistics Function 2020 & 2033
- Table 18: Global Logistics Industry Australia Revenue billion Forecast, by Country 2020 & 2033
- Table 19: United Kingdom Logistics Industry Australia Revenue (billion) Forecast, by Application 2020 & 2033
- Table 20: Germany Logistics Industry Australia Revenue (billion) Forecast, by Application 2020 & 2033
- Table 21: France Logistics Industry Australia Revenue (billion) Forecast, by Application 2020 & 2033
- Table 22: Italy Logistics Industry Australia Revenue (billion) Forecast, by Application 2020 & 2033
- Table 23: Spain Logistics Industry Australia Revenue (billion) Forecast, by Application 2020 & 2033
- Table 24: Russia Logistics Industry Australia Revenue (billion) Forecast, by Application 2020 & 2033
- Table 25: Benelux Logistics Industry Australia Revenue (billion) Forecast, by Application 2020 & 2033
- Table 26: Nordics Logistics Industry Australia Revenue (billion) Forecast, by Application 2020 & 2033
- Table 27: Rest of Europe Logistics Industry Australia Revenue (billion) Forecast, by Application 2020 & 2033
- Table 28: Global Logistics Industry Australia Revenue billion Forecast, by End User Industry 2020 & 2033
- Table 29: Global Logistics Industry Australia Revenue billion Forecast, by Logistics Function 2020 & 2033
- Table 30: Global Logistics Industry Australia Revenue billion Forecast, by Country 2020 & 2033
- Table 31: Turkey Logistics Industry Australia Revenue (billion) Forecast, by Application 2020 & 2033
- Table 32: Israel Logistics Industry Australia Revenue (billion) Forecast, by Application 2020 & 2033
- Table 33: GCC Logistics Industry Australia Revenue (billion) Forecast, by Application 2020 & 2033
- Table 34: North Africa Logistics Industry Australia Revenue (billion) Forecast, by Application 2020 & 2033
- Table 35: South Africa Logistics Industry Australia Revenue (billion) Forecast, by Application 2020 & 2033
- Table 36: Rest of Middle East & Africa Logistics Industry Australia Revenue (billion) Forecast, by Application 2020 & 2033
- Table 37: Global Logistics Industry Australia Revenue billion Forecast, by End User Industry 2020 & 2033
- Table 38: Global Logistics Industry Australia Revenue billion Forecast, by Logistics Function 2020 & 2033
- Table 39: Global Logistics Industry Australia Revenue billion Forecast, by Country 2020 & 2033
- Table 40: China Logistics Industry Australia Revenue (billion) Forecast, by Application 2020 & 2033
- Table 41: India Logistics Industry Australia Revenue (billion) Forecast, by Application 2020 & 2033
- Table 42: Japan Logistics Industry Australia Revenue (billion) Forecast, by Application 2020 & 2033
- Table 43: South Korea Logistics Industry Australia Revenue (billion) Forecast, by Application 2020 & 2033
- Table 44: ASEAN Logistics Industry Australia Revenue (billion) Forecast, by Application 2020 & 2033
- Table 45: Oceania Logistics Industry Australia Revenue (billion) Forecast, by Application 2020 & 2033
- Table 46: Rest of Asia Pacific Logistics Industry Australia Revenue (billion) Forecast, by Application 2020 & 2033
Frequently Asked Questions
1. What is the projected Compound Annual Growth Rate (CAGR) of the Logistics Industry Australia?
The projected CAGR is approximately 1%.
2. Which companies are prominent players in the Logistics Industry Australia?
Key companies in the market include DB Schenker, Japan Post Holdings Co Ltd (including Toll Group), Aurizon Holdings Limited, DHL Group, DSV A/S (De Sammensluttede Vognmænd af Air and Sea), FedEx, Qube Holdings Ltd, LINX Cargo Care Group, Kuehne + Nagel, Linfox Pty Ltd, K&S Corporation Limited, Toll Grou, Centurion Transport.
3. What are the main segments of the Logistics Industry Australia?
The market segments include End User Industry, Logistics Function.
4. Can you provide details about the market size?
The market size is estimated to be USD 137.7 billion as of 2022.
5. What are some drivers contributing to market growth?
4.; Increase demand of Petrochemical is driving the market4.; Increase in Investments is driving the market.
6. What are the notable trends driving market growth?
OTHER KEY INDUSTRY TRENDS COVERED IN THE REPORT.
7. Are there any restraints impacting market growth?
4.; High Cost of Operations.
8. Can you provide examples of recent developments in the market?
February 2024: DHL Supply Chain (DHL) is continuing the decarbonization of its Australian transport fleet by introducing additional new electric vehicles. The company has added two Terberg YT200EV electric yard tractors to its truck fleet and is supporting Australian electric vehicle manufacturing with the introduction of its first SEA Electric light duty truck to its last-mile fleet.January 2024: DHL Express has commenced services for the final Boeing 777 freighter deployed at the South Asia Hub in Singapore. With a payload capability of 102 tons, the aircraft joins the four other Boeing 777 freighters already deployed in Singapore to boost inter-continental connectivity between the Asia Pacific and the Americas. Sporting a dual DHL-Singapore Airlines (SIA) livery, these five freighters provide a total of 1,224 tons of payload capacity to meet growing customer demand for international express shipping services.January 2024: Kuehne + Nagel has announced its Book & Claim insetting solution for electric vehicles, to improve its decarbonization solutions. Developing Book & Claim insetting solutions for road freight was a strategic priority for Kuehne + Nagel. Customers who use Kuehne + Nagel's road transport services can now claim the carbon reductions of electric trucks when it is not possible to physically move their goods on these vehicles.
9. What pricing options are available for accessing the report?
Pricing options include single-user, multi-user, and enterprise licenses priced at USD 3800, USD 4500, and USD 5800 respectively.
10. Is the market size provided in terms of value or volume?
The market size is provided in terms of value, measured in billion.
11. Are there any specific market keywords associated with the report?
Yes, the market keyword associated with the report is "Logistics Industry Australia," which aids in identifying and referencing the specific market segment covered.
12. How do I determine which pricing option suits my needs best?
The pricing options vary based on user requirements and access needs. Individual users may opt for single-user licenses, while businesses requiring broader access may choose multi-user or enterprise licenses for cost-effective access to the report.
13. Are there any additional resources or data provided in the Logistics Industry Australia report?
While the report offers comprehensive insights, it's advisable to review the specific contents or supplementary materials provided to ascertain if additional resources or data are available.
14. How can I stay updated on further developments or reports in the Logistics Industry Australia?
To stay informed about further developments, trends, and reports in the Logistics Industry Australia, consider subscribing to industry newsletters, following relevant companies and organizations, or regularly checking reputable industry news sources and publications.
Methodology
Step 1 - Identification of Relevant Samples Size from Population Database


Step 2 - Approaches for Defining Global Market Size (Value, Volume* & Price*)

Note*: In applicable scenarios
Step 3 - Data Sources
Primary Research
- Web Analytics
- Survey Reports
- Research Institute
- Latest Research Reports
- Opinion Leaders
Secondary Research
- Annual Reports
- White Paper
- Latest Press Release
- Industry Association
- Paid Database
- Investor Presentations

Step 4 - Data Triangulation
Involves using different sources of information in order to increase the validity of a study
These sources are likely to be stakeholders in a program - participants, other researchers, program staff, other community members, and so on.
Then we put all data in single framework & apply various statistical tools to find out the dynamic on the market.
During the analysis stage, feedback from the stakeholder groups would be compared to determine areas of agreement as well as areas of divergence