

Key Insights
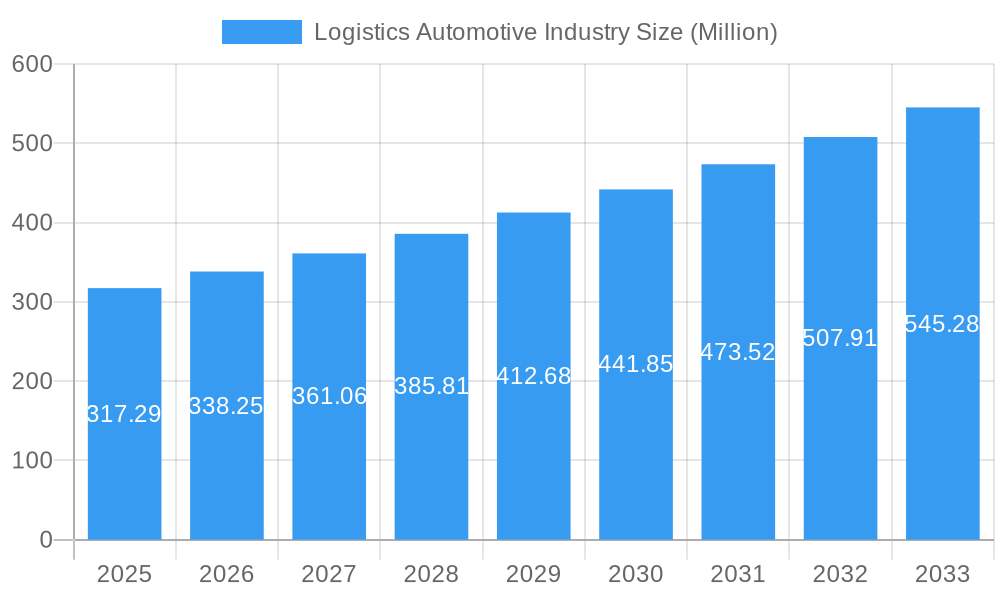
The automotive logistics market, valued at $317.29 million in 2025, is experiencing robust growth, projected to expand at a Compound Annual Growth Rate (CAGR) of 6.65% from 2025 to 2033. This growth is driven by several key factors. The increasing global demand for vehicles, fueled by economic growth in developing nations and rising disposable incomes, is a significant contributor. Furthermore, the automotive industry's ongoing shift towards just-in-time manufacturing and lean supply chain strategies necessitates efficient and reliable logistics solutions. The expansion of e-commerce and the growth of the after-sales market, requiring efficient parts distribution, further bolster market demand. Technological advancements, including the adoption of advanced transportation management systems (TMS), warehouse management systems (WMS), and real-time tracking capabilities, are optimizing logistics operations and contributing to increased efficiency and reduced costs. Finally, the growing emphasis on sustainability and reducing carbon emissions within the supply chain is driving the adoption of eco-friendly transportation methods and innovative logistics solutions.
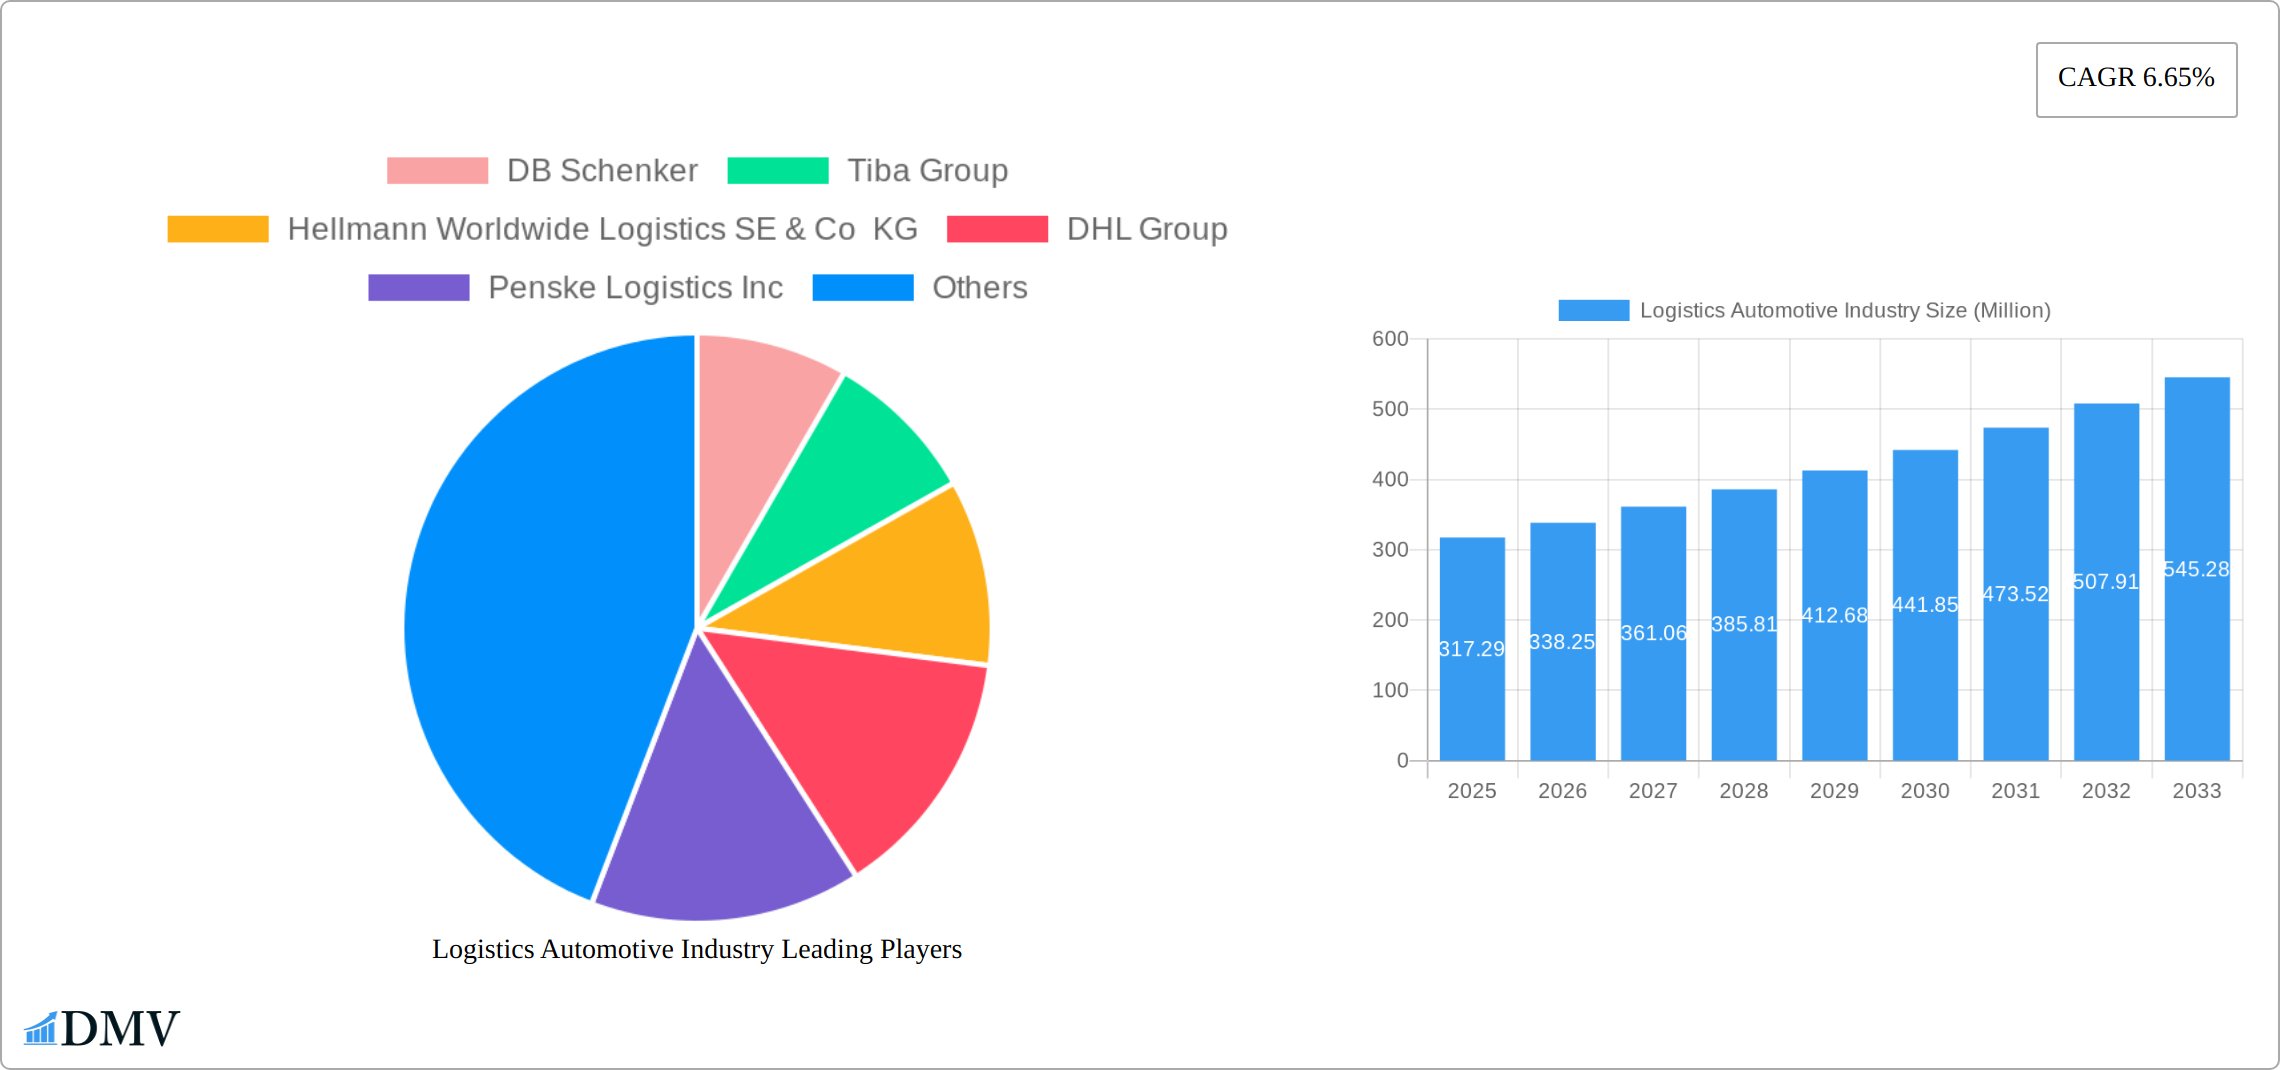
Logistics Automotive Industry Market Size (In Million)
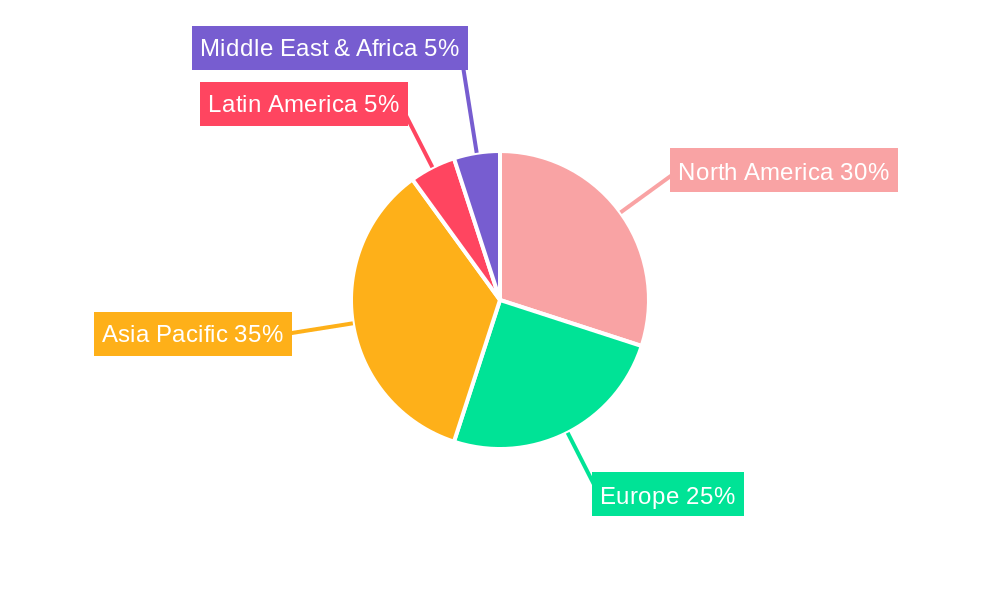
The market is segmented by service type (transportation, warehousing, distribution, inventory management, and other services) and vehicle type (finished vehicles, auto components, and other types). While transportation currently dominates the market share, the growing complexity of automotive supply chains is fostering demand for integrated logistics solutions encompassing warehousing, distribution, and inventory management. The Asia-Pacific region, particularly China, Japan, and India, holds a significant market share, reflecting the region's substantial automotive manufacturing and consumption. North America and Europe also represent substantial markets, driven by established automotive industries and robust consumer demand. Competitive landscape analysis reveals the presence of numerous major players, including DB Schenker, DHL Group, Kuehne + Nagel, and others, vying for market dominance through strategic partnerships, technological innovation, and expansion into new regions. The market's future trajectory suggests continued growth, driven by the aforementioned factors, presenting considerable opportunities for established players and new entrants alike.
Logistics Automotive Industry Company Market Share
Logistics Automotive Industry Market Composition & Trends
The logistics automotive industry is characterized by a high degree of market concentration, with leading players such as DB Schenker, Tiba Group, and Hellmann Worldwide Logistics SE & Co KG dominating significant portions of the market share. In 2025, the market is projected to be led by DHL Group with an estimated 15% market share, followed by Penske Logistics Inc and Kuehne + Nagel International AG at 10% each. The industry is driven by innovation catalysts such as the integration of IoT and AI technologies to optimize supply chain operations, leading to improved efficiency and reduced costs.
Regulatory landscapes continue to evolve, with stringent emissions standards and safety regulations impacting logistics operations, particularly in the transportation of finished vehicles and auto components. Substitute products like electric vehicles are influencing logistics strategies, necessitating adaptations in warehousing and distribution services. End-user profiles include automotive manufacturers, dealerships, and aftermarket service providers, each with unique logistical needs.
Mergers and acquisitions are pivotal in shaping the industry's structure, with notable deals such as Delhivery's acquisition of Algorhythm Tech Pvt Ltd for USD 17.99 Million in December 2022, aimed at enhancing integrated supply chain solutions. The total value of M&A activities in the logistics automotive sector reached USD 500 Million in 2022, reflecting the industry's dynamic nature and the pursuit of strategic growth.
Market Share Distribution:
DHL Group: 15%
Penske Logistics Inc: 10%
Kuehne + Nagel International AG: 10%
M&A Deal Values:
Total M&A Value in 2022: USD 500 Million
Delhivery's Acquisition: USD 17.99 Million
Logistics Automotive Industry Industry Evolution
The logistics automotive industry has witnessed significant evolution over the study period from 2019 to 2033, with market growth trajectories influenced by technological advancements and shifting consumer demands. From 2019 to 2024, the industry experienced a compound annual growth rate (CAGR) of 4.5%, driven by the increasing demand for efficient logistics solutions in the automotive sector. The adoption of advanced tracking systems and real-time data analytics has revolutionized inventory management, enabling companies to reduce lead times and enhance customer satisfaction.
By 2025, the base year for our analysis, the industry is expected to see a further growth spurt, with projections indicating a CAGR of 5.2% from 2025 to 2033. This growth is attributed to the rise in electric vehicle production and the subsequent need for specialized logistics services. Technological advancements, such as autonomous vehicles for last-mile delivery and drone technology, are poised to transform the industry, with adoption rates expected to reach 30% by 2030.
Consumer demands are shifting towards sustainability and efficiency, prompting logistics providers to invest in green logistics solutions. The integration of renewable energy sources in warehousing and distribution centers is becoming more prevalent, with companies like BLG Logistics Group AG & Co KG leading the way in sustainable practices. The industry's evolution is also marked by the increasing use of blockchain technology for transparent and secure supply chain management, with adoption rates projected to increase by 20% annually.
Leading Regions, Countries, or Segments in Logistics Automotive Industry
The logistics automotive industry showcases varying dominance across different regions, countries, and segments. In terms of services, transportation emerges as the leading segment, driven by the global increase in automotive production and the need for efficient movement of finished vehicles and auto components.
- Key Drivers for Transportation Segment:
- Investment Trends: Increased capital expenditure in transportation infrastructure, particularly in Asia-Pacific, with investments totaling USD 200 Million in 2022.
- Regulatory Support: Favorable government policies promoting efficient logistics solutions, such as the European Union's Green Deal, which encourages sustainable transportation practices.
The Asia-Pacific region, particularly China and Japan, dominates the logistics automotive market due to their robust automotive manufacturing sectors. China's logistics industry for automotive components is expected to grow at a CAGR of 6% from 2025 to 2033, fueled by the country's position as a global manufacturing hub and the rise of electric vehicle production.
In Europe, Germany stands out as a key player, with its advanced logistics infrastructure and strong presence of automotive giants like Volkswagen and BMW. The German logistics market for finished vehicles is projected to reach USD 10 Billion by 2030, supported by the country's strategic location and well-developed transportation networks.
The warehousing segment is also significant, with North America leading due to the high demand for storage solutions for automotive parts and finished vehicles. The United States, in particular, is a hub for warehousing innovation, with companies like CFR Rinkens and CEVA Logistics investing heavily in automated warehousing systems.
- Key Drivers for Warehousing Segment:
- Investment Trends: USD 150 Million invested in automated warehousing technologies in the United States in 2022.
- Regulatory Support: Initiatives like the U.S. Department of Transportation's Smart City Challenge, which promotes innovative logistics solutions.
Logistics Automotive Industry Product Innovations
Product innovations in the logistics automotive industry are driven by the need for efficiency and sustainability. Recent advancements include the development of autonomous delivery vehicles, which enhance last-mile delivery efficiency and reduce operational costs. Companies like Expeditors are leveraging AI to optimize route planning and reduce fuel consumption, contributing to a greener logistics footprint. Additionally, the implementation of blockchain technology ensures transparency and security in supply chain operations, with adoption rates projected to increase significantly in the coming years.
Propelling Factors for Logistics Automotive Industry Growth
The growth of the logistics automotive industry is propelled by several key factors. Technological advancements, such as IoT and AI, are enhancing operational efficiency and enabling real-time tracking of goods. Economically, the rise in global automotive production, particularly in emerging markets, is driving demand for logistics services. Regulatory influences, such as the push for sustainable logistics solutions, are also significant, with initiatives like the European Green Deal encouraging eco-friendly practices. These factors collectively contribute to the industry's robust growth trajectory.
Obstacles in the Logistics Automotive Industry Market
Despite its impressive growth trajectory, the automotive logistics industry faces significant headwinds. Stringent emission regulations present substantial challenges, increasing operational costs and necessitating substantial investments in green technologies. Supply chain disruptions, often stemming from geopolitical instability or unforeseen events like natural disasters, frequently lead to delays, increased costs, and diminished efficiency. The competitive landscape is fiercely contested, with established players such as APL Logistics Ltd and XPO Logistics Inc vying for market share. This intense competition often translates into price wars and compressed profit margins, requiring continuous innovation and operational excellence to maintain profitability.
Future Opportunities in Logistics Automotive Industry
The future holds significant opportunities for growth and innovation within the automotive logistics sector. Expansion into emerging markets, particularly in Africa and Southeast Asia, where automotive production is experiencing rapid expansion, presents considerable potential. The continued development and implementation of technologies like drone delivery and autonomous vehicles for last-mile delivery promise to unlock significant efficiency gains and reduce operational costs. Simultaneously, the growing consumer preference for sustainability and the boom in e-commerce are creating a surge in demand for innovative logistics solutions, opening up new avenues for growth for companies like GEFCO SA and Panalpina.
Major Players in the Logistics Automotive Industry Ecosystem
- DB Schenker
- Tiba Group
- Hellmann Worldwide Logistics SE & Co KG
- DHL Group
- Penske Logistics Inc
- Kuehne + Nagel International AG
- BLG Logistics Group AG & Co KG
- CFR Rinkens *(List Not Exhaustive)*
- CEVA Logistics
- Expeditors
- APL Logistics Ltd
- XPO Logistics Inc
- GEFCO SA
- Panalpina
- Bolloré Logistics
- Kerry Logistics Network Ltd
- Ryder System Inc
- DSV Panalpina AS
Key Developments in Logistics Automotive Industry Industry
- December 2022: Delhivery, a provider of logistics services, announced the acquisition of Algorhythm Tech Pvt Ltd of Pune for INR 14.9 crores (USD 17.99 Million) in an all-cash purchase to expand its integrated supply chain solutions portfolio. By the end of January 2023, Delhivery anticipates the acquisition to be completed. At this point, Algorhythm Tech will function as a fully-owned subsidiary of the logistics company based in Gurugram. This acquisition enhances Delhivery's technological capabilities and strengthens its position in the market.
- August 2022: Bolloré Logistics, a global provider of transportation and logistics services, increased its presence in Australia by purchasing the South Australian firm Lynair Logistics. According to Thibault Janssens, CEO of Bolloré Logistics, Pacific Region, the purchase of Lynair Logistics further enhances their footprint in Australia, and they are glad to welcome their new, experienced, and highly skilled team members into the Bolloré Logistics Australia team. This strategic move bolsters Bolloré Logistics' market dynamics in the region.
Strategic Logistics Automotive Industry Market Forecast
The strategic forecast for the logistics automotive industry from 2025 to 2033 highlights significant growth potential driven by technological advancements and expanding markets. The integration of autonomous vehicles and drones for last-mile delivery is expected to revolutionize logistics operations, offering enhanced efficiency and reduced costs. Emerging markets in Africa and Southeast Asia present new opportunities for logistics providers, with demand for automotive logistics services projected to grow at a CAGR of 7%. Additionally, the shift towards sustainable practices and the rise of e-commerce will further propel the industry, positioning it for robust growth and innovation in the coming years.
Logistics Automotive Industry Segmentation
-
1. Service
- 1.1. Transportation
- 1.2. Warehous
- 1.3. Other Services
-
2. Type
- 2.1. Finished Vehicle
- 2.2. Auto Components
- 2.3. Other Types
Logistics Automotive Industry Segmentation By Geography
-
1. Asia Pacific
- 1.1. China
- 1.2. Japan
- 1.3. India
- 1.4. South Korea
- 1.5. Rest of Asia Pacific
-
2. North America
- 2.1. United States
- 2.2. Canada
- 2.3. Mexico
-
3. Europe
- 3.1. United Kingdom
- 3.2. Germany
- 3.3. Italy
- 3.4. Russia
- 3.5. France
- 3.6. Rest of Europe
-
4. Latin America
- 4.1. Brazil
- 4.2. Argentina
- 4.3. Rest of Latin America
- 5. Middle East
-
6. South Africa
- 6.1. United Arab Emirates
- 6.2. Saudi Arabia
- 6.3. Rest of Middle East
Logistics Automotive Industry Regional Market Share
Geographic Coverage of Logistics Automotive Industry
Logistics Automotive Industry REPORT HIGHLIGHTS
| Aspects | Details |
|---|---|
| Study Period | 2020-2034 |
| Base Year | 2025 |
| Estimated Year | 2026 |
| Forecast Period | 2026-2034 |
| Historical Period | 2020-2025 |
| Growth Rate | CAGR of 6.65% from 2020-2034 |
| Segmentation |
|
Table of Contents
- 1. Introduction
- 1.1. Research Scope
- 1.2. Market Segmentation
- 1.3. Research Objective
- 1.4. Definitions and Assumptions
- 2. Executive Summary
- 2.1. Market Snapshot
- 3. Market Dynamics
- 3.1. Market Drivers
- 3.2. Market Restrains
- 3.3. Market Trends
- 3.4. Market Opportunities
- 4. Market Factor Analysis
- 4.1. Porters Five Forces
- 4.1.1. Bargaining Power of Suppliers
- 4.1.2. Bargaining Power of Buyers
- 4.1.3. Threat of New Entrants
- 4.1.4. Threat of Substitutes
- 4.1.5. Competitive Rivalry
- 4.2. PESTEL analysis
- 4.3. BCG Analysis
- 4.3.1. Stars (High Growth, High Market Share)
- 4.3.2. Cash Cows (Low Growth, High Market Share)
- 4.3.3. Question Mark (High Growth, Low Market Share)
- 4.3.4. Dogs (Low Growth, Low Market Share)
- 4.4. Ansoff Matrix Analysis
- 4.5. Supply Chain Analysis
- 4.6. Regulatory Landscape
- 4.7. Current Market Potential and Opportunity Assessment (TAM–SAM–SOM Framework)
- 4.8. DMV Analyst Note
- 4.1. Porters Five Forces
- 5. Market Analysis, Insights and Forecast 2021-2033
- 5.1. Market Analysis, Insights and Forecast - by Service
- 5.1.1. Transportation
- 5.1.2. Warehous
- 5.1.3. Other Services
- 5.2. Market Analysis, Insights and Forecast - by Type
- 5.2.1. Finished Vehicle
- 5.2.2. Auto Components
- 5.2.3. Other Types
- 5.3. Market Analysis, Insights and Forecast - by Region
- 5.3.1. Asia Pacific
- 5.3.2. North America
- 5.3.3. Europe
- 5.3.4. Latin America
- 5.3.5. Middle East
- 5.3.6. South Africa
- 5.1. Market Analysis, Insights and Forecast - by Service
- 6. Global Logistics Automotive Industry Analysis, Insights and Forecast, 2021-2033
- 6.1. Market Analysis, Insights and Forecast - by Service
- 6.1.1. Transportation
- 6.1.2. Warehous
- 6.1.3. Other Services
- 6.2. Market Analysis, Insights and Forecast - by Type
- 6.2.1. Finished Vehicle
- 6.2.2. Auto Components
- 6.2.3. Other Types
- 6.1. Market Analysis, Insights and Forecast - by Service
- 7. Asia Pacific Logistics Automotive Industry Analysis, Insights and Forecast, 2020-2032
- 7.1. Market Analysis, Insights and Forecast - by Service
- 7.1.1. Transportation
- 7.1.2. Warehous
- 7.1.3. Other Services
- 7.2. Market Analysis, Insights and Forecast - by Type
- 7.2.1. Finished Vehicle
- 7.2.2. Auto Components
- 7.2.3. Other Types
- 7.1. Market Analysis, Insights and Forecast - by Service
- 8. North America Logistics Automotive Industry Analysis, Insights and Forecast, 2020-2032
- 8.1. Market Analysis, Insights and Forecast - by Service
- 8.1.1. Transportation
- 8.1.2. Warehous
- 8.1.3. Other Services
- 8.2. Market Analysis, Insights and Forecast - by Type
- 8.2.1. Finished Vehicle
- 8.2.2. Auto Components
- 8.2.3. Other Types
- 8.1. Market Analysis, Insights and Forecast - by Service
- 9. Europe Logistics Automotive Industry Analysis, Insights and Forecast, 2020-2032
- 9.1. Market Analysis, Insights and Forecast - by Service
- 9.1.1. Transportation
- 9.1.2. Warehous
- 9.1.3. Other Services
- 9.2. Market Analysis, Insights and Forecast - by Type
- 9.2.1. Finished Vehicle
- 9.2.2. Auto Components
- 9.2.3. Other Types
- 9.1. Market Analysis, Insights and Forecast - by Service
- 10. Latin America Logistics Automotive Industry Analysis, Insights and Forecast, 2020-2032
- 10.1. Market Analysis, Insights and Forecast - by Service
- 10.1.1. Transportation
- 10.1.2. Warehous
- 10.1.3. Other Services
- 10.2. Market Analysis, Insights and Forecast - by Type
- 10.2.1. Finished Vehicle
- 10.2.2. Auto Components
- 10.2.3. Other Types
- 10.1. Market Analysis, Insights and Forecast - by Service
- 11. Middle East Logistics Automotive Industry Analysis, Insights and Forecast, 2020-2032
- 11.1. Market Analysis, Insights and Forecast - by Service
- 11.1.1. Transportation
- 11.1.2. Warehous
- 11.1.3. Other Services
- 11.2. Market Analysis, Insights and Forecast - by Type
- 11.2.1. Finished Vehicle
- 11.2.2. Auto Components
- 11.2.3. Other Types
- 11.1. Market Analysis, Insights and Forecast - by Service
- 12. South Africa Logistics Automotive Industry Analysis, Insights and Forecast, 2020-2032
- 12.1. Market Analysis, Insights and Forecast - by Service
- 12.1.1. Transportation
- 12.1.2. Warehous
- 12.1.3. Other Services
- 12.2. Market Analysis, Insights and Forecast - by Type
- 12.2.1. Finished Vehicle
- 12.2.2. Auto Components
- 12.2.3. Other Types
- 12.1. Market Analysis, Insights and Forecast - by Service
- 13. Competitive Analysis
- 13.1. Company Profiles
- 13.1.1 DB Schenker
- 13.1.1.1. Company Overview
- 13.1.1.2. Products
- 13.1.1.3. Company Financials
- 13.1.1.4. SWOT Analysis
- 13.1.2 Tiba Group
- 13.1.2.1. Company Overview
- 13.1.2.2. Products
- 13.1.2.3. Company Financials
- 13.1.2.4. SWOT Analysis
- 13.1.3 Hellmann Worldwide Logistics SE & Co KG
- 13.1.3.1. Company Overview
- 13.1.3.2. Products
- 13.1.3.3. Company Financials
- 13.1.3.4. SWOT Analysis
- 13.1.4 DHL Group
- 13.1.4.1. Company Overview
- 13.1.4.2. Products
- 13.1.4.3. Company Financials
- 13.1.4.4. SWOT Analysis
- 13.1.5 Penske Logistics Inc
- 13.1.5.1. Company Overview
- 13.1.5.2. Products
- 13.1.5.3. Company Financials
- 13.1.5.4. SWOT Analysis
- 13.1.6 Kuehne + Nagel International AG
- 13.1.6.1. Company Overview
- 13.1.6.2. Products
- 13.1.6.3. Company Financials
- 13.1.6.4. SWOT Analysis
- 13.1.7 BLG Logistics Group AG & Co KG
- 13.1.7.1. Company Overview
- 13.1.7.2. Products
- 13.1.7.3. Company Financials
- 13.1.7.4. SWOT Analysis
- 13.1.8 CFR Rinkens**List Not Exhaustive
- 13.1.8.1. Company Overview
- 13.1.8.2. Products
- 13.1.8.3. Company Financials
- 13.1.8.4. SWOT Analysis
- 13.1.9 CEVA Logistics
- 13.1.9.1. Company Overview
- 13.1.9.2. Products
- 13.1.9.3. Company Financials
- 13.1.9.4. SWOT Analysis
- 13.1.10 Expeditors
- 13.1.10.1. Company Overview
- 13.1.10.2. Products
- 13.1.10.3. Company Financials
- 13.1.10.4. SWOT Analysis
- 13.1.11 APL Logistics Ltd
- 13.1.11.1. Company Overview
- 13.1.11.2. Products
- 13.1.11.3. Company Financials
- 13.1.11.4. SWOT Analysis
- 13.1.12 XPO Logistics Inc
- 13.1.12.1. Company Overview
- 13.1.12.2. Products
- 13.1.12.3. Company Financials
- 13.1.12.4. SWOT Analysis
- 13.1.13 GEFCO SA
- 13.1.13.1. Company Overview
- 13.1.13.2. Products
- 13.1.13.3. Company Financials
- 13.1.13.4. SWOT Analysis
- 13.1.14 Panalpina
- 13.1.14.1. Company Overview
- 13.1.14.2. Products
- 13.1.14.3. Company Financials
- 13.1.14.4. SWOT Analysis
- 13.1.15 Bollore Logistics
- 13.1.15.1. Company Overview
- 13.1.15.2. Products
- 13.1.15.3. Company Financials
- 13.1.15.4. SWOT Analysis
- 13.1.16 Kerry Logistics Network Ltd
- 13.1.16.1. Company Overview
- 13.1.16.2. Products
- 13.1.16.3. Company Financials
- 13.1.16.4. SWOT Analysis
- 13.1.17 Ryder System Inc
- 13.1.17.1. Company Overview
- 13.1.17.2. Products
- 13.1.17.3. Company Financials
- 13.1.17.4. SWOT Analysis
- 13.1.18 DSV Panalpina AS
- 13.1.18.1. Company Overview
- 13.1.18.2. Products
- 13.1.18.3. Company Financials
- 13.1.18.4. SWOT Analysis
- 13.1.1 DB Schenker
- 13.2. Market Entropy
- 13.2.1 Company's Key Areas Served
- 13.2.2 Recent Developments
- 13.3. Company Market Share Analysis 2025
- 13.3.1 Top 5 Companies Market Share Analysis
- 13.3.2 Top 3 Companies Market Share Analysis
- 13.4. List of Potential Customers
- 14. Research Methodology
List of Figures
- Figure 1: Global Logistics Automotive Industry Revenue Breakdown (Million, %) by Region 2025 & 2033
- Figure 2: Asia Pacific Logistics Automotive Industry Revenue (Million), by Service 2025 & 2033
- Figure 3: Asia Pacific Logistics Automotive Industry Revenue Share (%), by Service 2025 & 2033
- Figure 4: Asia Pacific Logistics Automotive Industry Revenue (Million), by Type 2025 & 2033
- Figure 5: Asia Pacific Logistics Automotive Industry Revenue Share (%), by Type 2025 & 2033
- Figure 6: Asia Pacific Logistics Automotive Industry Revenue (Million), by Country 2025 & 2033
- Figure 7: Asia Pacific Logistics Automotive Industry Revenue Share (%), by Country 2025 & 2033
- Figure 8: North America Logistics Automotive Industry Revenue (Million), by Service 2025 & 2033
- Figure 9: North America Logistics Automotive Industry Revenue Share (%), by Service 2025 & 2033
- Figure 10: North America Logistics Automotive Industry Revenue (Million), by Type 2025 & 2033
- Figure 11: North America Logistics Automotive Industry Revenue Share (%), by Type 2025 & 2033
- Figure 12: North America Logistics Automotive Industry Revenue (Million), by Country 2025 & 2033
- Figure 13: North America Logistics Automotive Industry Revenue Share (%), by Country 2025 & 2033
- Figure 14: Europe Logistics Automotive Industry Revenue (Million), by Service 2025 & 2033
- Figure 15: Europe Logistics Automotive Industry Revenue Share (%), by Service 2025 & 2033
- Figure 16: Europe Logistics Automotive Industry Revenue (Million), by Type 2025 & 2033
- Figure 17: Europe Logistics Automotive Industry Revenue Share (%), by Type 2025 & 2033
- Figure 18: Europe Logistics Automotive Industry Revenue (Million), by Country 2025 & 2033
- Figure 19: Europe Logistics Automotive Industry Revenue Share (%), by Country 2025 & 2033
- Figure 20: Latin America Logistics Automotive Industry Revenue (Million), by Service 2025 & 2033
- Figure 21: Latin America Logistics Automotive Industry Revenue Share (%), by Service 2025 & 2033
- Figure 22: Latin America Logistics Automotive Industry Revenue (Million), by Type 2025 & 2033
- Figure 23: Latin America Logistics Automotive Industry Revenue Share (%), by Type 2025 & 2033
- Figure 24: Latin America Logistics Automotive Industry Revenue (Million), by Country 2025 & 2033
- Figure 25: Latin America Logistics Automotive Industry Revenue Share (%), by Country 2025 & 2033
- Figure 26: Middle East Logistics Automotive Industry Revenue (Million), by Service 2025 & 2033
- Figure 27: Middle East Logistics Automotive Industry Revenue Share (%), by Service 2025 & 2033
- Figure 28: Middle East Logistics Automotive Industry Revenue (Million), by Type 2025 & 2033
- Figure 29: Middle East Logistics Automotive Industry Revenue Share (%), by Type 2025 & 2033
- Figure 30: Middle East Logistics Automotive Industry Revenue (Million), by Country 2025 & 2033
- Figure 31: Middle East Logistics Automotive Industry Revenue Share (%), by Country 2025 & 2033
- Figure 32: South Africa Logistics Automotive Industry Revenue (Million), by Service 2025 & 2033
- Figure 33: South Africa Logistics Automotive Industry Revenue Share (%), by Service 2025 & 2033
- Figure 34: South Africa Logistics Automotive Industry Revenue (Million), by Type 2025 & 2033
- Figure 35: South Africa Logistics Automotive Industry Revenue Share (%), by Type 2025 & 2033
- Figure 36: South Africa Logistics Automotive Industry Revenue (Million), by Country 2025 & 2033
- Figure 37: South Africa Logistics Automotive Industry Revenue Share (%), by Country 2025 & 2033
List of Tables
- Table 1: Global Logistics Automotive Industry Revenue Million Forecast, by Service 2020 & 2033
- Table 2: Global Logistics Automotive Industry Revenue Million Forecast, by Type 2020 & 2033
- Table 3: Global Logistics Automotive Industry Revenue Million Forecast, by Region 2020 & 2033
- Table 4: Global Logistics Automotive Industry Revenue Million Forecast, by Service 2020 & 2033
- Table 5: Global Logistics Automotive Industry Revenue Million Forecast, by Type 2020 & 2033
- Table 6: Global Logistics Automotive Industry Revenue Million Forecast, by Country 2020 & 2033
- Table 7: China Logistics Automotive Industry Revenue (Million) Forecast, by Application 2020 & 2033
- Table 8: Japan Logistics Automotive Industry Revenue (Million) Forecast, by Application 2020 & 2033
- Table 9: India Logistics Automotive Industry Revenue (Million) Forecast, by Application 2020 & 2033
- Table 10: South Korea Logistics Automotive Industry Revenue (Million) Forecast, by Application 2020 & 2033
- Table 11: Rest of Asia Pacific Logistics Automotive Industry Revenue (Million) Forecast, by Application 2020 & 2033
- Table 12: Global Logistics Automotive Industry Revenue Million Forecast, by Service 2020 & 2033
- Table 13: Global Logistics Automotive Industry Revenue Million Forecast, by Type 2020 & 2033
- Table 14: Global Logistics Automotive Industry Revenue Million Forecast, by Country 2020 & 2033
- Table 15: United States Logistics Automotive Industry Revenue (Million) Forecast, by Application 2020 & 2033
- Table 16: Canada Logistics Automotive Industry Revenue (Million) Forecast, by Application 2020 & 2033
- Table 17: Mexico Logistics Automotive Industry Revenue (Million) Forecast, by Application 2020 & 2033
- Table 18: Global Logistics Automotive Industry Revenue Million Forecast, by Service 2020 & 2033
- Table 19: Global Logistics Automotive Industry Revenue Million Forecast, by Type 2020 & 2033
- Table 20: Global Logistics Automotive Industry Revenue Million Forecast, by Country 2020 & 2033
- Table 21: United Kingdom Logistics Automotive Industry Revenue (Million) Forecast, by Application 2020 & 2033
- Table 22: Germany Logistics Automotive Industry Revenue (Million) Forecast, by Application 2020 & 2033
- Table 23: Italy Logistics Automotive Industry Revenue (Million) Forecast, by Application 2020 & 2033
- Table 24: Russia Logistics Automotive Industry Revenue (Million) Forecast, by Application 2020 & 2033
- Table 25: France Logistics Automotive Industry Revenue (Million) Forecast, by Application 2020 & 2033
- Table 26: Rest of Europe Logistics Automotive Industry Revenue (Million) Forecast, by Application 2020 & 2033
- Table 27: Global Logistics Automotive Industry Revenue Million Forecast, by Service 2020 & 2033
- Table 28: Global Logistics Automotive Industry Revenue Million Forecast, by Type 2020 & 2033
- Table 29: Global Logistics Automotive Industry Revenue Million Forecast, by Country 2020 & 2033
- Table 30: Brazil Logistics Automotive Industry Revenue (Million) Forecast, by Application 2020 & 2033
- Table 31: Argentina Logistics Automotive Industry Revenue (Million) Forecast, by Application 2020 & 2033
- Table 32: Rest of Latin America Logistics Automotive Industry Revenue (Million) Forecast, by Application 2020 & 2033
- Table 33: Global Logistics Automotive Industry Revenue Million Forecast, by Service 2020 & 2033
- Table 34: Global Logistics Automotive Industry Revenue Million Forecast, by Type 2020 & 2033
- Table 35: Global Logistics Automotive Industry Revenue Million Forecast, by Country 2020 & 2033
- Table 36: Global Logistics Automotive Industry Revenue Million Forecast, by Service 2020 & 2033
- Table 37: Global Logistics Automotive Industry Revenue Million Forecast, by Type 2020 & 2033
- Table 38: Global Logistics Automotive Industry Revenue Million Forecast, by Country 2020 & 2033
- Table 39: United Arab Emirates Logistics Automotive Industry Revenue (Million) Forecast, by Application 2020 & 2033
- Table 40: Saudi Arabia Logistics Automotive Industry Revenue (Million) Forecast, by Application 2020 & 2033
- Table 41: Rest of Middle East Logistics Automotive Industry Revenue (Million) Forecast, by Application 2020 & 2033
Frequently Asked Questions
1. What is the projected Compound Annual Growth Rate (CAGR) of the Logistics Automotive Industry?
The projected CAGR is approximately 6.65%.
2. Which companies are prominent players in the Logistics Automotive Industry?
Key companies in the market include DB Schenker, Tiba Group, Hellmann Worldwide Logistics SE & Co KG, DHL Group, Penske Logistics Inc, Kuehne + Nagel International AG, BLG Logistics Group AG & Co KG, CFR Rinkens**List Not Exhaustive, CEVA Logistics, Expeditors, APL Logistics Ltd, XPO Logistics Inc, GEFCO SA, Panalpina, Bollore Logistics, Kerry Logistics Network Ltd, Ryder System Inc, DSV Panalpina AS.
3. What are the main segments of the Logistics Automotive Industry?
The market segments include Service, Type.
4. Can you provide details about the market size?
The market size is estimated to be USD 317.29 Million as of 2022.
5. What are some drivers contributing to market growth?
4.; Rise In Agriculture Sector and Food Industry4.; Rise In Pharmaceutical Industry.
6. What are the notable trends driving market growth?
Positive Outlook for the Automotive Sales and Production Demands Efficient Logistics Services.
7. Are there any restraints impacting market growth?
4.; Cost Constraints4.; Infrastructure Accessibility.
8. Can you provide examples of recent developments in the market?
December 2022: Delhivery, a provider of logistics services, announced the acquisition of Algorhythm Tech Pvt Ltd of Pune for INR 14.9 crores (USD 17.99 Million) in an all-cash purchase to expand its integrated supply chain solutions portfolio. By the end of January 2023, Delhivery anticipates the acquisition to be completed. At this point, Algorhythm Tech will function as a fully-owned subsidiary of the logistics company based in Gurugram.
9. What pricing options are available for accessing the report?
Pricing options include single-user, multi-user, and enterprise licenses priced at USD 4750, USD 5250, and USD 8750 respectively.
10. Is the market size provided in terms of value or volume?
The market size is provided in terms of value, measured in Million.
11. Are there any specific market keywords associated with the report?
Yes, the market keyword associated with the report is "Logistics Automotive Industry," which aids in identifying and referencing the specific market segment covered.
12. How do I determine which pricing option suits my needs best?
The pricing options vary based on user requirements and access needs. Individual users may opt for single-user licenses, while businesses requiring broader access may choose multi-user or enterprise licenses for cost-effective access to the report.
13. Are there any additional resources or data provided in the Logistics Automotive Industry report?
While the report offers comprehensive insights, it's advisable to review the specific contents or supplementary materials provided to ascertain if additional resources or data are available.
14. How can I stay updated on further developments or reports in the Logistics Automotive Industry?
To stay informed about further developments, trends, and reports in the Logistics Automotive Industry, consider subscribing to industry newsletters, following relevant companies and organizations, or regularly checking reputable industry news sources and publications.
Methodology
Step 1 - Identification of Relevant Samples Size from Population Database


Step 2 - Approaches for Defining Global Market Size (Value, Volume* & Price*)

Note*: In applicable scenarios
Step 3 - Data Sources
Primary Research
- Web Analytics
- Survey Reports
- Research Institute
- Latest Research Reports
- Opinion Leaders
Secondary Research
- Annual Reports
- White Paper
- Latest Press Release
- Industry Association
- Paid Database
- Investor Presentations

Step 4 - Data Triangulation
Involves using different sources of information in order to increase the validity of a study
These sources are likely to be stakeholders in a program - participants, other researchers, program staff, other community members, and so on.
Then we put all data in single framework & apply various statistical tools to find out the dynamic on the market.
During the analysis stage, feedback from the stakeholder groups would be compared to determine areas of agreement as well as areas of divergence