

Key Insights
The GCC smart furniture market is projected for significant expansion, fueled by rising disposable incomes, a growing demand for technologically advanced home furnishings, and the increasing integration of smart home ecosystems. The market's anticipated CAGR of 7.54% signifies a substantial growth trajectory, presenting considerable opportunities for stakeholders. Key growth drivers include the region's expanding middle class, the escalating adoption of smart home automation, and supportive government initiatives promoting technological innovation across sectors, including home furnishings. Market segmentation indicates robust demand for smart tables and desks in both residential and commercial applications, highlighting a preference for functional, integrated furniture solutions. The online distribution channel is expected to experience notable growth, paralleling the rise in e-commerce penetration within the GCC. The estimated market size for 2025 is $15.61 billion, with projections indicating further growth driven by the aforementioned CAGR.
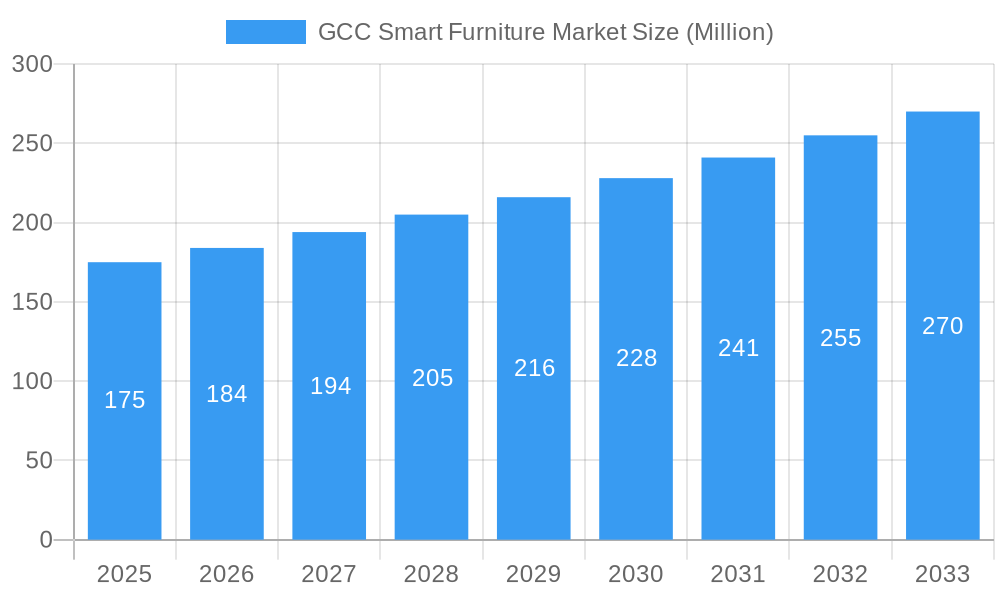
GCC Smart Furniture Market Market Size (In Billion)
While the market offers substantial potential, certain challenges may influence its growth. High upfront investment costs for smart furniture and concerns regarding data privacy and security are potential restraints. However, ongoing technological advancements are expected to yield more accessible and user-friendly smart furniture solutions. Increased consumer awareness of smart home technology benefits will likely counterbalance these challenges. Leading companies such as Al Huzaifa, Bukannan Furniture, and IKEA are strategically positioned to leverage this growth through their established distribution networks and brand equity. Future market success will depend on companies' capacity for product innovation, seamless integration with existing smart home technologies, and effective mitigation of consumer concerns related to pricing and data security. Ultimately, market expansion hinges on delivering technologically advanced yet practical solutions tailored to the diverse cultural landscape of the GCC region.
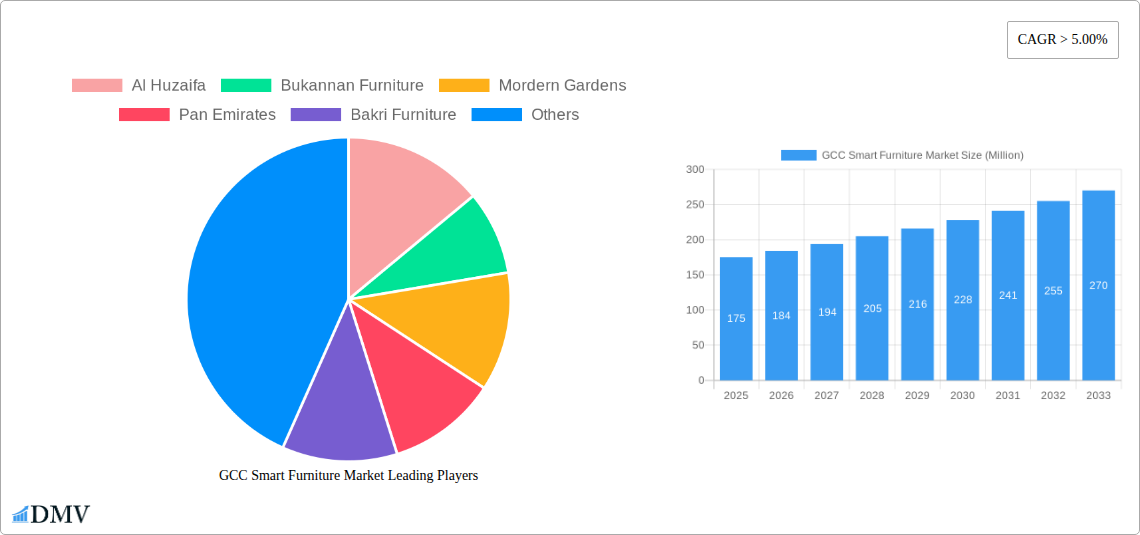
GCC Smart Furniture Market Company Market Share
GCC Smart Furniture Market: A Comprehensive Report (2019-2033)
This insightful report provides a detailed analysis of the burgeoning GCC Smart Furniture Market, offering a comprehensive overview of market trends, key players, and future growth prospects. The study period spans from 2019 to 2033, with 2025 serving as the base and estimated year. This report is invaluable for stakeholders seeking to understand the dynamics of this rapidly evolving sector, including manufacturers, distributors, investors, and policymakers. The market is projected to reach xx Million by 2033, showcasing significant growth potential.
GCC Smart Furniture Market Composition & Trends
This section delves into the current market landscape, examining market concentration, key innovation drivers, and regulatory factors shaping the GCC smart furniture industry. We analyze the competitive dynamics, including market share distribution among key players like Al Huzaifa, Bukannan Furniture, Modern Gardens, Pan Emirates, Bakri Furniture, Schuco, Ikea, Sagtco, and Royal Furniture. The report also assesses the impact of mergers and acquisitions (M&A) activities, providing insights into deal values and their influence on market consolidation. The analysis considers the influence of substitute products and evolving end-user preferences (residential vs. commercial).
- Market Concentration: The GCC smart furniture market exhibits a [describe concentration - e.g., moderately concentrated] structure, with the top 5 players holding approximately [xx]% market share in 2024.
- Innovation Catalysts: The increasing adoption of IoT and AI technologies is a major driver of innovation, leading to the development of sophisticated smart furniture with enhanced functionality.
- Regulatory Landscape: Government initiatives promoting smart city development and sustainable technologies are creating a favorable regulatory environment.
- Substitute Products: Traditional furniture still poses a significant competitive challenge, but the increasing demand for convenience and technological integration is driving adoption of smart furniture.
- End-User Profiles: Residential users are currently the largest segment, but the commercial sector is expected to experience significant growth in the forecast period due to increasing adoption in offices and hospitality sectors.
- M&A Activity: The report analyzes at least xx M&A deals in the period 2019-2024, with a total estimated value of xx Million.
GCC Smart Furniture Market Industry Evolution
This section provides a detailed analysis of the GCC smart furniture market's historical and projected growth trajectory. It examines technological advancements, such as improved connectivity, enhanced user interfaces, and integration with smart home ecosystems, and their influence on market expansion. The analysis also considers evolving consumer preferences and demands, including rising disposable incomes and a preference for technologically advanced products. The market experienced a Compound Annual Growth Rate (CAGR) of xx% during the historical period (2019-2024) and is projected to grow at a CAGR of xx% during the forecast period (2025-2033). Specific data points on adoption rates of smart furniture in different segments will be provided. Factors such as changing lifestyles, urbanization, and increased awareness of smart home technology will also be discussed.
Leading Regions, Countries, or Segments in GCC Smart Furniture Market
This section identifies the dominant regions, countries, and market segments within the GCC smart furniture market. The analysis considers various factors influencing market dominance, including investment trends, government support, consumer preferences, and infrastructural development.
- Dominant Segment: The residential segment is currently the largest, driven by increasing disposable incomes and a desire for enhanced comfort and convenience.
- Key Drivers:
- UAE: Strong government support for smart city initiatives.
- Saudi Arabia: High disposable incomes and a growing preference for technologically advanced products.
- Online Distribution: Rapid growth of e-commerce in the GCC is driving adoption of online sales channels.
The report provides an in-depth analysis of the factors contributing to the dominance of these segments and regions.
GCC Smart Furniture Market Product Innovations
The GCC smart furniture market is witnessing rapid product innovation, with new functionalities and features being introduced regularly. This includes smart tables with integrated charging capabilities and interactive displays, smart desks with adjustable heights and built-in storage, and smart chairs with ergonomic designs and advanced comfort settings. These innovations are driven by advancements in areas such as IoT, AI, and materials science, resulting in products with improved performance, durability, and user experience. Unique selling propositions include features like voice control, gesture recognition, and integration with other smart home devices.
Propelling Factors for GCC Smart Furniture Market Growth
Several factors are driving the growth of the GCC smart furniture market. Technological advancements, such as the development of more sophisticated and affordable smart furniture, are a major catalyst. Economic factors, such as rising disposable incomes and increasing urbanization, are also contributing to market expansion. Furthermore, supportive government regulations and initiatives promoting smart city development are creating a conducive environment for growth.
Obstacles in the GCC Smart Furniture Market Market
Despite the significant growth potential, the GCC smart furniture market faces certain challenges. High initial costs of smart furniture can be a barrier to adoption for some consumers. Supply chain disruptions can also impact market growth and availability of products. Furthermore, intense competition from traditional furniture manufacturers and emerging players can create pressure on pricing and margins.
Future Opportunities in GCC Smart Furniture Market
The future of the GCC smart furniture market presents numerous opportunities. The increasing adoption of smart home technologies is expected to drive demand for integrated smart furniture solutions. The expansion of e-commerce and online retail channels will also create opportunities for manufacturers to reach wider audiences. Further innovations in product design and functionality will continue to drive market expansion. Exploration of new materials and sustainable manufacturing processes will also present growth opportunities.
Major Players in the GCC Smart Furniture Market Ecosystem
- Al Huzaifa
- Bukannan Furniture
- Mordern Gardens
- Pan Emirates
- Bakri Furniture
- Schuco
- Ikea
- Sagtco
- Royal Furniture
Key Developments in GCC Smart Furniture Market Industry
- January 2023: Al Huzaifa launched a new line of smart desks with integrated wireless charging.
- June 2022: A major M&A deal involving two key players resulted in a significant market share shift.
- [Insert more bullet points with specific dates and events]
Strategic GCC Smart Furniture Market Market Forecast
The GCC smart furniture market is poised for substantial growth in the coming years, driven by factors such as technological advancements, rising consumer demand, and supportive government policies. The market is expected to witness increased innovation and competition, leading to greater product diversification and improved affordability. The expansion into new market segments, such as hospitality and healthcare, will further contribute to overall market growth. The forecast period promises exciting developments and opportunities for players in this dynamic market.
GCC Smart Furniture Market Segmentation
-
1. Product Type
- 1.1. Smart Tables
- 1.2. Smart Desks
- 1.3. Smart Chairs
- 1.4. Other Products (smart beds, smart sofas, etc.)
-
2. End User
- 2.1. Residential
- 2.2. Commercial
-
3. DistributionChannel
- 3.1. Multi-brand Stores
- 3.2. Specialty Stores
- 3.3. Online
- 3.4. Other Distribution Channels
-
4. Geography
- 4.1. UAE
- 4.2. Saudi Arabia
- 4.3. Qatar
- 4.4. Kuwait
- 4.5. Rest of GCC Countries
GCC Smart Furniture Market Segmentation By Geography
- 1. UAE
- 2. Saudi Arabia
- 3. Qatar
- 4. Kuwait
- 5. Rest of GCC Countries
GCC Smart Furniture Market Regional Market Share
Geographic Coverage of GCC Smart Furniture Market
GCC Smart Furniture Market REPORT HIGHLIGHTS
| Aspects | Details |
|---|---|
| Study Period | 2020-2034 |
| Base Year | 2025 |
| Estimated Year | 2026 |
| Forecast Period | 2026-2034 |
| Historical Period | 2020-2025 |
| Growth Rate | CAGR of 7.54% from 2020-2034 |
| Segmentation |
|
Table of Contents
- 1. Introduction
- 1.1. Research Scope
- 1.2. Market Segmentation
- 1.3. Research Objective
- 1.4. Definitions and Assumptions
- 2. Executive Summary
- 2.1. Market Snapshot
- 3. Market Dynamics
- 3.1. Market Drivers
- 3.2. Market Restrains
- 3.3. Market Trends
- 3.4. Market Opportunities
- 4. Market Factor Analysis
- 4.1. Porters Five Forces
- 4.1.1. Bargaining Power of Suppliers
- 4.1.2. Bargaining Power of Buyers
- 4.1.3. Threat of New Entrants
- 4.1.4. Threat of Substitutes
- 4.1.5. Competitive Rivalry
- 4.2. PESTEL analysis
- 4.3. BCG Analysis
- 4.3.1. Stars (High Growth, High Market Share)
- 4.3.2. Cash Cows (Low Growth, High Market Share)
- 4.3.3. Question Mark (High Growth, Low Market Share)
- 4.3.4. Dogs (Low Growth, Low Market Share)
- 4.4. Ansoff Matrix Analysis
- 4.5. Supply Chain Analysis
- 4.6. Regulatory Landscape
- 4.7. Current Market Potential and Opportunity Assessment (TAM–SAM–SOM Framework)
- 4.8. DMV Analyst Note
- 4.1. Porters Five Forces
- 5. Market Analysis, Insights and Forecast 2021-2033
- 5.1. Market Analysis, Insights and Forecast - by Product Type
- 5.1.1. Smart Tables
- 5.1.2. Smart Desks
- 5.1.3. Smart Chairs
- 5.1.4. Other Products (smart beds, smart sofas, etc.)
- 5.2. Market Analysis, Insights and Forecast - by End User
- 5.2.1. Residential
- 5.2.2. Commercial
- 5.3. Market Analysis, Insights and Forecast - by DistributionChannel
- 5.3.1. Multi-brand Stores
- 5.3.2. Specialty Stores
- 5.3.3. Online
- 5.3.4. Other Distribution Channels
- 5.4. Market Analysis, Insights and Forecast - by Geography
- 5.4.1. UAE
- 5.4.2. Saudi Arabia
- 5.4.3. Qatar
- 5.4.4. Kuwait
- 5.4.5. Rest of GCC Countries
- 5.5. Market Analysis, Insights and Forecast - by Region
- 5.5.1. UAE
- 5.5.2. Saudi Arabia
- 5.5.3. Qatar
- 5.5.4. Kuwait
- 5.5.5. Rest of GCC Countries
- 5.1. Market Analysis, Insights and Forecast - by Product Type
- 6. Global GCC Smart Furniture Market Analysis, Insights and Forecast, 2021-2033
- 6.1. Market Analysis, Insights and Forecast - by Product Type
- 6.1.1. Smart Tables
- 6.1.2. Smart Desks
- 6.1.3. Smart Chairs
- 6.1.4. Other Products (smart beds, smart sofas, etc.)
- 6.2. Market Analysis, Insights and Forecast - by End User
- 6.2.1. Residential
- 6.2.2. Commercial
- 6.3. Market Analysis, Insights and Forecast - by DistributionChannel
- 6.3.1. Multi-brand Stores
- 6.3.2. Specialty Stores
- 6.3.3. Online
- 6.3.4. Other Distribution Channels
- 6.4. Market Analysis, Insights and Forecast - by Geography
- 6.4.1. UAE
- 6.4.2. Saudi Arabia
- 6.4.3. Qatar
- 6.4.4. Kuwait
- 6.4.5. Rest of GCC Countries
- 6.1. Market Analysis, Insights and Forecast - by Product Type
- 7. UAE GCC Smart Furniture Market Analysis, Insights and Forecast, 2020-2032
- 7.1. Market Analysis, Insights and Forecast - by Product Type
- 7.1.1. Smart Tables
- 7.1.2. Smart Desks
- 7.1.3. Smart Chairs
- 7.1.4. Other Products (smart beds, smart sofas, etc.)
- 7.2. Market Analysis, Insights and Forecast - by End User
- 7.2.1. Residential
- 7.2.2. Commercial
- 7.3. Market Analysis, Insights and Forecast - by DistributionChannel
- 7.3.1. Multi-brand Stores
- 7.3.2. Specialty Stores
- 7.3.3. Online
- 7.3.4. Other Distribution Channels
- 7.4. Market Analysis, Insights and Forecast - by Geography
- 7.4.1. UAE
- 7.4.2. Saudi Arabia
- 7.4.3. Qatar
- 7.4.4. Kuwait
- 7.4.5. Rest of GCC Countries
- 7.1. Market Analysis, Insights and Forecast - by Product Type
- 8. Saudi Arabia GCC Smart Furniture Market Analysis, Insights and Forecast, 2020-2032
- 8.1. Market Analysis, Insights and Forecast - by Product Type
- 8.1.1. Smart Tables
- 8.1.2. Smart Desks
- 8.1.3. Smart Chairs
- 8.1.4. Other Products (smart beds, smart sofas, etc.)
- 8.2. Market Analysis, Insights and Forecast - by End User
- 8.2.1. Residential
- 8.2.2. Commercial
- 8.3. Market Analysis, Insights and Forecast - by DistributionChannel
- 8.3.1. Multi-brand Stores
- 8.3.2. Specialty Stores
- 8.3.3. Online
- 8.3.4. Other Distribution Channels
- 8.4. Market Analysis, Insights and Forecast - by Geography
- 8.4.1. UAE
- 8.4.2. Saudi Arabia
- 8.4.3. Qatar
- 8.4.4. Kuwait
- 8.4.5. Rest of GCC Countries
- 8.1. Market Analysis, Insights and Forecast - by Product Type
- 9. Qatar GCC Smart Furniture Market Analysis, Insights and Forecast, 2020-2032
- 9.1. Market Analysis, Insights and Forecast - by Product Type
- 9.1.1. Smart Tables
- 9.1.2. Smart Desks
- 9.1.3. Smart Chairs
- 9.1.4. Other Products (smart beds, smart sofas, etc.)
- 9.2. Market Analysis, Insights and Forecast - by End User
- 9.2.1. Residential
- 9.2.2. Commercial
- 9.3. Market Analysis, Insights and Forecast - by DistributionChannel
- 9.3.1. Multi-brand Stores
- 9.3.2. Specialty Stores
- 9.3.3. Online
- 9.3.4. Other Distribution Channels
- 9.4. Market Analysis, Insights and Forecast - by Geography
- 9.4.1. UAE
- 9.4.2. Saudi Arabia
- 9.4.3. Qatar
- 9.4.4. Kuwait
- 9.4.5. Rest of GCC Countries
- 9.1. Market Analysis, Insights and Forecast - by Product Type
- 10. Kuwait GCC Smart Furniture Market Analysis, Insights and Forecast, 2020-2032
- 10.1. Market Analysis, Insights and Forecast - by Product Type
- 10.1.1. Smart Tables
- 10.1.2. Smart Desks
- 10.1.3. Smart Chairs
- 10.1.4. Other Products (smart beds, smart sofas, etc.)
- 10.2. Market Analysis, Insights and Forecast - by End User
- 10.2.1. Residential
- 10.2.2. Commercial
- 10.3. Market Analysis, Insights and Forecast - by DistributionChannel
- 10.3.1. Multi-brand Stores
- 10.3.2. Specialty Stores
- 10.3.3. Online
- 10.3.4. Other Distribution Channels
- 10.4. Market Analysis, Insights and Forecast - by Geography
- 10.4.1. UAE
- 10.4.2. Saudi Arabia
- 10.4.3. Qatar
- 10.4.4. Kuwait
- 10.4.5. Rest of GCC Countries
- 10.1. Market Analysis, Insights and Forecast - by Product Type
- 11. Rest of GCC Countries GCC Smart Furniture Market Analysis, Insights and Forecast, 2020-2032
- 11.1. Market Analysis, Insights and Forecast - by Product Type
- 11.1.1. Smart Tables
- 11.1.2. Smart Desks
- 11.1.3. Smart Chairs
- 11.1.4. Other Products (smart beds, smart sofas, etc.)
- 11.2. Market Analysis, Insights and Forecast - by End User
- 11.2.1. Residential
- 11.2.2. Commercial
- 11.3. Market Analysis, Insights and Forecast - by DistributionChannel
- 11.3.1. Multi-brand Stores
- 11.3.2. Specialty Stores
- 11.3.3. Online
- 11.3.4. Other Distribution Channels
- 11.4. Market Analysis, Insights and Forecast - by Geography
- 11.4.1. UAE
- 11.4.2. Saudi Arabia
- 11.4.3. Qatar
- 11.4.4. Kuwait
- 11.4.5. Rest of GCC Countries
- 11.1. Market Analysis, Insights and Forecast - by Product Type
- 12. Competitive Analysis
- 12.1. Company Profiles
- 12.1.1 Al Huzaifa
- 12.1.1.1. Company Overview
- 12.1.1.2. Products
- 12.1.1.3. Company Financials
- 12.1.1.4. SWOT Analysis
- 12.1.2 Bukannan Furniture
- 12.1.2.1. Company Overview
- 12.1.2.2. Products
- 12.1.2.3. Company Financials
- 12.1.2.4. SWOT Analysis
- 12.1.3 Mordern Gardens
- 12.1.3.1. Company Overview
- 12.1.3.2. Products
- 12.1.3.3. Company Financials
- 12.1.3.4. SWOT Analysis
- 12.1.4 Pan Emirates
- 12.1.4.1. Company Overview
- 12.1.4.2. Products
- 12.1.4.3. Company Financials
- 12.1.4.4. SWOT Analysis
- 12.1.5 Bakri Furniture
- 12.1.5.1. Company Overview
- 12.1.5.2. Products
- 12.1.5.3. Company Financials
- 12.1.5.4. SWOT Analysis
- 12.1.6 Schuco
- 12.1.6.1. Company Overview
- 12.1.6.2. Products
- 12.1.6.3. Company Financials
- 12.1.6.4. SWOT Analysis
- 12.1.7 Ikea
- 12.1.7.1. Company Overview
- 12.1.7.2. Products
- 12.1.7.3. Company Financials
- 12.1.7.4. SWOT Analysis
- 12.1.8 Sagtco
- 12.1.8.1. Company Overview
- 12.1.8.2. Products
- 12.1.8.3. Company Financials
- 12.1.8.4. SWOT Analysis
- 12.1.9 Royal Furniture
- 12.1.9.1. Company Overview
- 12.1.9.2. Products
- 12.1.9.3. Company Financials
- 12.1.9.4. SWOT Analysis
- 12.1.1 Al Huzaifa
- 12.2. Market Entropy
- 12.2.1 Company's Key Areas Served
- 12.2.2 Recent Developments
- 12.3. Company Market Share Analysis 2025
- 12.3.1 Top 5 Companies Market Share Analysis
- 12.3.2 Top 3 Companies Market Share Analysis
- 12.4. List of Potential Customers
- 13. Research Methodology
List of Figures
- Figure 1: Global GCC Smart Furniture Market Revenue Breakdown (billion, %) by Region 2025 & 2033
- Figure 2: Global GCC Smart Furniture Market Volume Breakdown (K Unit, %) by Region 2025 & 2033
- Figure 3: UAE GCC Smart Furniture Market Revenue (billion), by Product Type 2025 & 2033
- Figure 4: UAE GCC Smart Furniture Market Volume (K Unit), by Product Type 2025 & 2033
- Figure 5: UAE GCC Smart Furniture Market Revenue Share (%), by Product Type 2025 & 2033
- Figure 6: UAE GCC Smart Furniture Market Volume Share (%), by Product Type 2025 & 2033
- Figure 7: UAE GCC Smart Furniture Market Revenue (billion), by End User 2025 & 2033
- Figure 8: UAE GCC Smart Furniture Market Volume (K Unit), by End User 2025 & 2033
- Figure 9: UAE GCC Smart Furniture Market Revenue Share (%), by End User 2025 & 2033
- Figure 10: UAE GCC Smart Furniture Market Volume Share (%), by End User 2025 & 2033
- Figure 11: UAE GCC Smart Furniture Market Revenue (billion), by DistributionChannel 2025 & 2033
- Figure 12: UAE GCC Smart Furniture Market Volume (K Unit), by DistributionChannel 2025 & 2033
- Figure 13: UAE GCC Smart Furniture Market Revenue Share (%), by DistributionChannel 2025 & 2033
- Figure 14: UAE GCC Smart Furniture Market Volume Share (%), by DistributionChannel 2025 & 2033
- Figure 15: UAE GCC Smart Furniture Market Revenue (billion), by Geography 2025 & 2033
- Figure 16: UAE GCC Smart Furniture Market Volume (K Unit), by Geography 2025 & 2033
- Figure 17: UAE GCC Smart Furniture Market Revenue Share (%), by Geography 2025 & 2033
- Figure 18: UAE GCC Smart Furniture Market Volume Share (%), by Geography 2025 & 2033
- Figure 19: UAE GCC Smart Furniture Market Revenue (billion), by Country 2025 & 2033
- Figure 20: UAE GCC Smart Furniture Market Volume (K Unit), by Country 2025 & 2033
- Figure 21: UAE GCC Smart Furniture Market Revenue Share (%), by Country 2025 & 2033
- Figure 22: UAE GCC Smart Furniture Market Volume Share (%), by Country 2025 & 2033
- Figure 23: Saudi Arabia GCC Smart Furniture Market Revenue (billion), by Product Type 2025 & 2033
- Figure 24: Saudi Arabia GCC Smart Furniture Market Volume (K Unit), by Product Type 2025 & 2033
- Figure 25: Saudi Arabia GCC Smart Furniture Market Revenue Share (%), by Product Type 2025 & 2033
- Figure 26: Saudi Arabia GCC Smart Furniture Market Volume Share (%), by Product Type 2025 & 2033
- Figure 27: Saudi Arabia GCC Smart Furniture Market Revenue (billion), by End User 2025 & 2033
- Figure 28: Saudi Arabia GCC Smart Furniture Market Volume (K Unit), by End User 2025 & 2033
- Figure 29: Saudi Arabia GCC Smart Furniture Market Revenue Share (%), by End User 2025 & 2033
- Figure 30: Saudi Arabia GCC Smart Furniture Market Volume Share (%), by End User 2025 & 2033
- Figure 31: Saudi Arabia GCC Smart Furniture Market Revenue (billion), by DistributionChannel 2025 & 2033
- Figure 32: Saudi Arabia GCC Smart Furniture Market Volume (K Unit), by DistributionChannel 2025 & 2033
- Figure 33: Saudi Arabia GCC Smart Furniture Market Revenue Share (%), by DistributionChannel 2025 & 2033
- Figure 34: Saudi Arabia GCC Smart Furniture Market Volume Share (%), by DistributionChannel 2025 & 2033
- Figure 35: Saudi Arabia GCC Smart Furniture Market Revenue (billion), by Geography 2025 & 2033
- Figure 36: Saudi Arabia GCC Smart Furniture Market Volume (K Unit), by Geography 2025 & 2033
- Figure 37: Saudi Arabia GCC Smart Furniture Market Revenue Share (%), by Geography 2025 & 2033
- Figure 38: Saudi Arabia GCC Smart Furniture Market Volume Share (%), by Geography 2025 & 2033
- Figure 39: Saudi Arabia GCC Smart Furniture Market Revenue (billion), by Country 2025 & 2033
- Figure 40: Saudi Arabia GCC Smart Furniture Market Volume (K Unit), by Country 2025 & 2033
- Figure 41: Saudi Arabia GCC Smart Furniture Market Revenue Share (%), by Country 2025 & 2033
- Figure 42: Saudi Arabia GCC Smart Furniture Market Volume Share (%), by Country 2025 & 2033
- Figure 43: Qatar GCC Smart Furniture Market Revenue (billion), by Product Type 2025 & 2033
- Figure 44: Qatar GCC Smart Furniture Market Volume (K Unit), by Product Type 2025 & 2033
- Figure 45: Qatar GCC Smart Furniture Market Revenue Share (%), by Product Type 2025 & 2033
- Figure 46: Qatar GCC Smart Furniture Market Volume Share (%), by Product Type 2025 & 2033
- Figure 47: Qatar GCC Smart Furniture Market Revenue (billion), by End User 2025 & 2033
- Figure 48: Qatar GCC Smart Furniture Market Volume (K Unit), by End User 2025 & 2033
- Figure 49: Qatar GCC Smart Furniture Market Revenue Share (%), by End User 2025 & 2033
- Figure 50: Qatar GCC Smart Furniture Market Volume Share (%), by End User 2025 & 2033
- Figure 51: Qatar GCC Smart Furniture Market Revenue (billion), by DistributionChannel 2025 & 2033
- Figure 52: Qatar GCC Smart Furniture Market Volume (K Unit), by DistributionChannel 2025 & 2033
- Figure 53: Qatar GCC Smart Furniture Market Revenue Share (%), by DistributionChannel 2025 & 2033
- Figure 54: Qatar GCC Smart Furniture Market Volume Share (%), by DistributionChannel 2025 & 2033
- Figure 55: Qatar GCC Smart Furniture Market Revenue (billion), by Geography 2025 & 2033
- Figure 56: Qatar GCC Smart Furniture Market Volume (K Unit), by Geography 2025 & 2033
- Figure 57: Qatar GCC Smart Furniture Market Revenue Share (%), by Geography 2025 & 2033
- Figure 58: Qatar GCC Smart Furniture Market Volume Share (%), by Geography 2025 & 2033
- Figure 59: Qatar GCC Smart Furniture Market Revenue (billion), by Country 2025 & 2033
- Figure 60: Qatar GCC Smart Furniture Market Volume (K Unit), by Country 2025 & 2033
- Figure 61: Qatar GCC Smart Furniture Market Revenue Share (%), by Country 2025 & 2033
- Figure 62: Qatar GCC Smart Furniture Market Volume Share (%), by Country 2025 & 2033
- Figure 63: Kuwait GCC Smart Furniture Market Revenue (billion), by Product Type 2025 & 2033
- Figure 64: Kuwait GCC Smart Furniture Market Volume (K Unit), by Product Type 2025 & 2033
- Figure 65: Kuwait GCC Smart Furniture Market Revenue Share (%), by Product Type 2025 & 2033
- Figure 66: Kuwait GCC Smart Furniture Market Volume Share (%), by Product Type 2025 & 2033
- Figure 67: Kuwait GCC Smart Furniture Market Revenue (billion), by End User 2025 & 2033
- Figure 68: Kuwait GCC Smart Furniture Market Volume (K Unit), by End User 2025 & 2033
- Figure 69: Kuwait GCC Smart Furniture Market Revenue Share (%), by End User 2025 & 2033
- Figure 70: Kuwait GCC Smart Furniture Market Volume Share (%), by End User 2025 & 2033
- Figure 71: Kuwait GCC Smart Furniture Market Revenue (billion), by DistributionChannel 2025 & 2033
- Figure 72: Kuwait GCC Smart Furniture Market Volume (K Unit), by DistributionChannel 2025 & 2033
- Figure 73: Kuwait GCC Smart Furniture Market Revenue Share (%), by DistributionChannel 2025 & 2033
- Figure 74: Kuwait GCC Smart Furniture Market Volume Share (%), by DistributionChannel 2025 & 2033
- Figure 75: Kuwait GCC Smart Furniture Market Revenue (billion), by Geography 2025 & 2033
- Figure 76: Kuwait GCC Smart Furniture Market Volume (K Unit), by Geography 2025 & 2033
- Figure 77: Kuwait GCC Smart Furniture Market Revenue Share (%), by Geography 2025 & 2033
- Figure 78: Kuwait GCC Smart Furniture Market Volume Share (%), by Geography 2025 & 2033
- Figure 79: Kuwait GCC Smart Furniture Market Revenue (billion), by Country 2025 & 2033
- Figure 80: Kuwait GCC Smart Furniture Market Volume (K Unit), by Country 2025 & 2033
- Figure 81: Kuwait GCC Smart Furniture Market Revenue Share (%), by Country 2025 & 2033
- Figure 82: Kuwait GCC Smart Furniture Market Volume Share (%), by Country 2025 & 2033
- Figure 83: Rest of GCC Countries GCC Smart Furniture Market Revenue (billion), by Product Type 2025 & 2033
- Figure 84: Rest of GCC Countries GCC Smart Furniture Market Volume (K Unit), by Product Type 2025 & 2033
- Figure 85: Rest of GCC Countries GCC Smart Furniture Market Revenue Share (%), by Product Type 2025 & 2033
- Figure 86: Rest of GCC Countries GCC Smart Furniture Market Volume Share (%), by Product Type 2025 & 2033
- Figure 87: Rest of GCC Countries GCC Smart Furniture Market Revenue (billion), by End User 2025 & 2033
- Figure 88: Rest of GCC Countries GCC Smart Furniture Market Volume (K Unit), by End User 2025 & 2033
- Figure 89: Rest of GCC Countries GCC Smart Furniture Market Revenue Share (%), by End User 2025 & 2033
- Figure 90: Rest of GCC Countries GCC Smart Furniture Market Volume Share (%), by End User 2025 & 2033
- Figure 91: Rest of GCC Countries GCC Smart Furniture Market Revenue (billion), by DistributionChannel 2025 & 2033
- Figure 92: Rest of GCC Countries GCC Smart Furniture Market Volume (K Unit), by DistributionChannel 2025 & 2033
- Figure 93: Rest of GCC Countries GCC Smart Furniture Market Revenue Share (%), by DistributionChannel 2025 & 2033
- Figure 94: Rest of GCC Countries GCC Smart Furniture Market Volume Share (%), by DistributionChannel 2025 & 2033
- Figure 95: Rest of GCC Countries GCC Smart Furniture Market Revenue (billion), by Geography 2025 & 2033
- Figure 96: Rest of GCC Countries GCC Smart Furniture Market Volume (K Unit), by Geography 2025 & 2033
- Figure 97: Rest of GCC Countries GCC Smart Furniture Market Revenue Share (%), by Geography 2025 & 2033
- Figure 98: Rest of GCC Countries GCC Smart Furniture Market Volume Share (%), by Geography 2025 & 2033
- Figure 99: Rest of GCC Countries GCC Smart Furniture Market Revenue (billion), by Country 2025 & 2033
- Figure 100: Rest of GCC Countries GCC Smart Furniture Market Volume (K Unit), by Country 2025 & 2033
- Figure 101: Rest of GCC Countries GCC Smart Furniture Market Revenue Share (%), by Country 2025 & 2033
- Figure 102: Rest of GCC Countries GCC Smart Furniture Market Volume Share (%), by Country 2025 & 2033
List of Tables
- Table 1: Global GCC Smart Furniture Market Revenue billion Forecast, by Product Type 2020 & 2033
- Table 2: Global GCC Smart Furniture Market Volume K Unit Forecast, by Product Type 2020 & 2033
- Table 3: Global GCC Smart Furniture Market Revenue billion Forecast, by End User 2020 & 2033
- Table 4: Global GCC Smart Furniture Market Volume K Unit Forecast, by End User 2020 & 2033
- Table 5: Global GCC Smart Furniture Market Revenue billion Forecast, by DistributionChannel 2020 & 2033
- Table 6: Global GCC Smart Furniture Market Volume K Unit Forecast, by DistributionChannel 2020 & 2033
- Table 7: Global GCC Smart Furniture Market Revenue billion Forecast, by Geography 2020 & 2033
- Table 8: Global GCC Smart Furniture Market Volume K Unit Forecast, by Geography 2020 & 2033
- Table 9: Global GCC Smart Furniture Market Revenue billion Forecast, by Region 2020 & 2033
- Table 10: Global GCC Smart Furniture Market Volume K Unit Forecast, by Region 2020 & 2033
- Table 11: Global GCC Smart Furniture Market Revenue billion Forecast, by Product Type 2020 & 2033
- Table 12: Global GCC Smart Furniture Market Volume K Unit Forecast, by Product Type 2020 & 2033
- Table 13: Global GCC Smart Furniture Market Revenue billion Forecast, by End User 2020 & 2033
- Table 14: Global GCC Smart Furniture Market Volume K Unit Forecast, by End User 2020 & 2033
- Table 15: Global GCC Smart Furniture Market Revenue billion Forecast, by DistributionChannel 2020 & 2033
- Table 16: Global GCC Smart Furniture Market Volume K Unit Forecast, by DistributionChannel 2020 & 2033
- Table 17: Global GCC Smart Furniture Market Revenue billion Forecast, by Geography 2020 & 2033
- Table 18: Global GCC Smart Furniture Market Volume K Unit Forecast, by Geography 2020 & 2033
- Table 19: Global GCC Smart Furniture Market Revenue billion Forecast, by Country 2020 & 2033
- Table 20: Global GCC Smart Furniture Market Volume K Unit Forecast, by Country 2020 & 2033
- Table 21: Global GCC Smart Furniture Market Revenue billion Forecast, by Product Type 2020 & 2033
- Table 22: Global GCC Smart Furniture Market Volume K Unit Forecast, by Product Type 2020 & 2033
- Table 23: Global GCC Smart Furniture Market Revenue billion Forecast, by End User 2020 & 2033
- Table 24: Global GCC Smart Furniture Market Volume K Unit Forecast, by End User 2020 & 2033
- Table 25: Global GCC Smart Furniture Market Revenue billion Forecast, by DistributionChannel 2020 & 2033
- Table 26: Global GCC Smart Furniture Market Volume K Unit Forecast, by DistributionChannel 2020 & 2033
- Table 27: Global GCC Smart Furniture Market Revenue billion Forecast, by Geography 2020 & 2033
- Table 28: Global GCC Smart Furniture Market Volume K Unit Forecast, by Geography 2020 & 2033
- Table 29: Global GCC Smart Furniture Market Revenue billion Forecast, by Country 2020 & 2033
- Table 30: Global GCC Smart Furniture Market Volume K Unit Forecast, by Country 2020 & 2033
- Table 31: Global GCC Smart Furniture Market Revenue billion Forecast, by Product Type 2020 & 2033
- Table 32: Global GCC Smart Furniture Market Volume K Unit Forecast, by Product Type 2020 & 2033
- Table 33: Global GCC Smart Furniture Market Revenue billion Forecast, by End User 2020 & 2033
- Table 34: Global GCC Smart Furniture Market Volume K Unit Forecast, by End User 2020 & 2033
- Table 35: Global GCC Smart Furniture Market Revenue billion Forecast, by DistributionChannel 2020 & 2033
- Table 36: Global GCC Smart Furniture Market Volume K Unit Forecast, by DistributionChannel 2020 & 2033
- Table 37: Global GCC Smart Furniture Market Revenue billion Forecast, by Geography 2020 & 2033
- Table 38: Global GCC Smart Furniture Market Volume K Unit Forecast, by Geography 2020 & 2033
- Table 39: Global GCC Smart Furniture Market Revenue billion Forecast, by Country 2020 & 2033
- Table 40: Global GCC Smart Furniture Market Volume K Unit Forecast, by Country 2020 & 2033
- Table 41: Global GCC Smart Furniture Market Revenue billion Forecast, by Product Type 2020 & 2033
- Table 42: Global GCC Smart Furniture Market Volume K Unit Forecast, by Product Type 2020 & 2033
- Table 43: Global GCC Smart Furniture Market Revenue billion Forecast, by End User 2020 & 2033
- Table 44: Global GCC Smart Furniture Market Volume K Unit Forecast, by End User 2020 & 2033
- Table 45: Global GCC Smart Furniture Market Revenue billion Forecast, by DistributionChannel 2020 & 2033
- Table 46: Global GCC Smart Furniture Market Volume K Unit Forecast, by DistributionChannel 2020 & 2033
- Table 47: Global GCC Smart Furniture Market Revenue billion Forecast, by Geography 2020 & 2033
- Table 48: Global GCC Smart Furniture Market Volume K Unit Forecast, by Geography 2020 & 2033
- Table 49: Global GCC Smart Furniture Market Revenue billion Forecast, by Country 2020 & 2033
- Table 50: Global GCC Smart Furniture Market Volume K Unit Forecast, by Country 2020 & 2033
- Table 51: Global GCC Smart Furniture Market Revenue billion Forecast, by Product Type 2020 & 2033
- Table 52: Global GCC Smart Furniture Market Volume K Unit Forecast, by Product Type 2020 & 2033
- Table 53: Global GCC Smart Furniture Market Revenue billion Forecast, by End User 2020 & 2033
- Table 54: Global GCC Smart Furniture Market Volume K Unit Forecast, by End User 2020 & 2033
- Table 55: Global GCC Smart Furniture Market Revenue billion Forecast, by DistributionChannel 2020 & 2033
- Table 56: Global GCC Smart Furniture Market Volume K Unit Forecast, by DistributionChannel 2020 & 2033
- Table 57: Global GCC Smart Furniture Market Revenue billion Forecast, by Geography 2020 & 2033
- Table 58: Global GCC Smart Furniture Market Volume K Unit Forecast, by Geography 2020 & 2033
- Table 59: Global GCC Smart Furniture Market Revenue billion Forecast, by Country 2020 & 2033
- Table 60: Global GCC Smart Furniture Market Volume K Unit Forecast, by Country 2020 & 2033
Frequently Asked Questions
1. What is the projected Compound Annual Growth Rate (CAGR) of the GCC Smart Furniture Market?
The projected CAGR is approximately 7.54%.
2. Which companies are prominent players in the GCC Smart Furniture Market?
Key companies in the market include Al Huzaifa, Bukannan Furniture, Mordern Gardens, Pan Emirates, Bakri Furniture, Schuco, Ikea, Sagtco, Royal Furniture.
3. What are the main segments of the GCC Smart Furniture Market?
The market segments include Product Type, End User, DistributionChannel, Geography.
4. Can you provide details about the market size?
The market size is estimated to be USD 15.61 billion as of 2022.
5. What are some drivers contributing to market growth?
Increasing Online Sales is Driving the Market; Growing Urbanisation is Driving need for Small Appliances.
6. What are the notable trends driving market growth?
Rise in Consumer Expenditure on Home Improvement Fuels the Market.
7. Are there any restraints impacting market growth?
Changing Needs of Customers; Limited Usage of the Product.
8. Can you provide examples of recent developments in the market?
N/A
9. What pricing options are available for accessing the report?
Pricing options include single-user, multi-user, and enterprise licenses priced at USD 4750, USD 5250, and USD 8750 respectively.
10. Is the market size provided in terms of value or volume?
The market size is provided in terms of value, measured in billion and volume, measured in K Unit.
11. Are there any specific market keywords associated with the report?
Yes, the market keyword associated with the report is "GCC Smart Furniture Market," which aids in identifying and referencing the specific market segment covered.
12. How do I determine which pricing option suits my needs best?
The pricing options vary based on user requirements and access needs. Individual users may opt for single-user licenses, while businesses requiring broader access may choose multi-user or enterprise licenses for cost-effective access to the report.
13. Are there any additional resources or data provided in the GCC Smart Furniture Market report?
While the report offers comprehensive insights, it's advisable to review the specific contents or supplementary materials provided to ascertain if additional resources or data are available.
14. How can I stay updated on further developments or reports in the GCC Smart Furniture Market?
To stay informed about further developments, trends, and reports in the GCC Smart Furniture Market, consider subscribing to industry newsletters, following relevant companies and organizations, or regularly checking reputable industry news sources and publications.
Methodology
Step 1 - Identification of Relevant Samples Size from Population Database


Step 2 - Approaches for Defining Global Market Size (Value, Volume* & Price*)

Note*: In applicable scenarios
Step 3 - Data Sources
Primary Research
- Web Analytics
- Survey Reports
- Research Institute
- Latest Research Reports
- Opinion Leaders
Secondary Research
- Annual Reports
- White Paper
- Latest Press Release
- Industry Association
- Paid Database
- Investor Presentations

Step 4 - Data Triangulation
Involves using different sources of information in order to increase the validity of a study
These sources are likely to be stakeholders in a program - participants, other researchers, program staff, other community members, and so on.
Then we put all data in single framework & apply various statistical tools to find out the dynamic on the market.
During the analysis stage, feedback from the stakeholder groups would be compared to determine areas of agreement as well as areas of divergence