

Key Insights
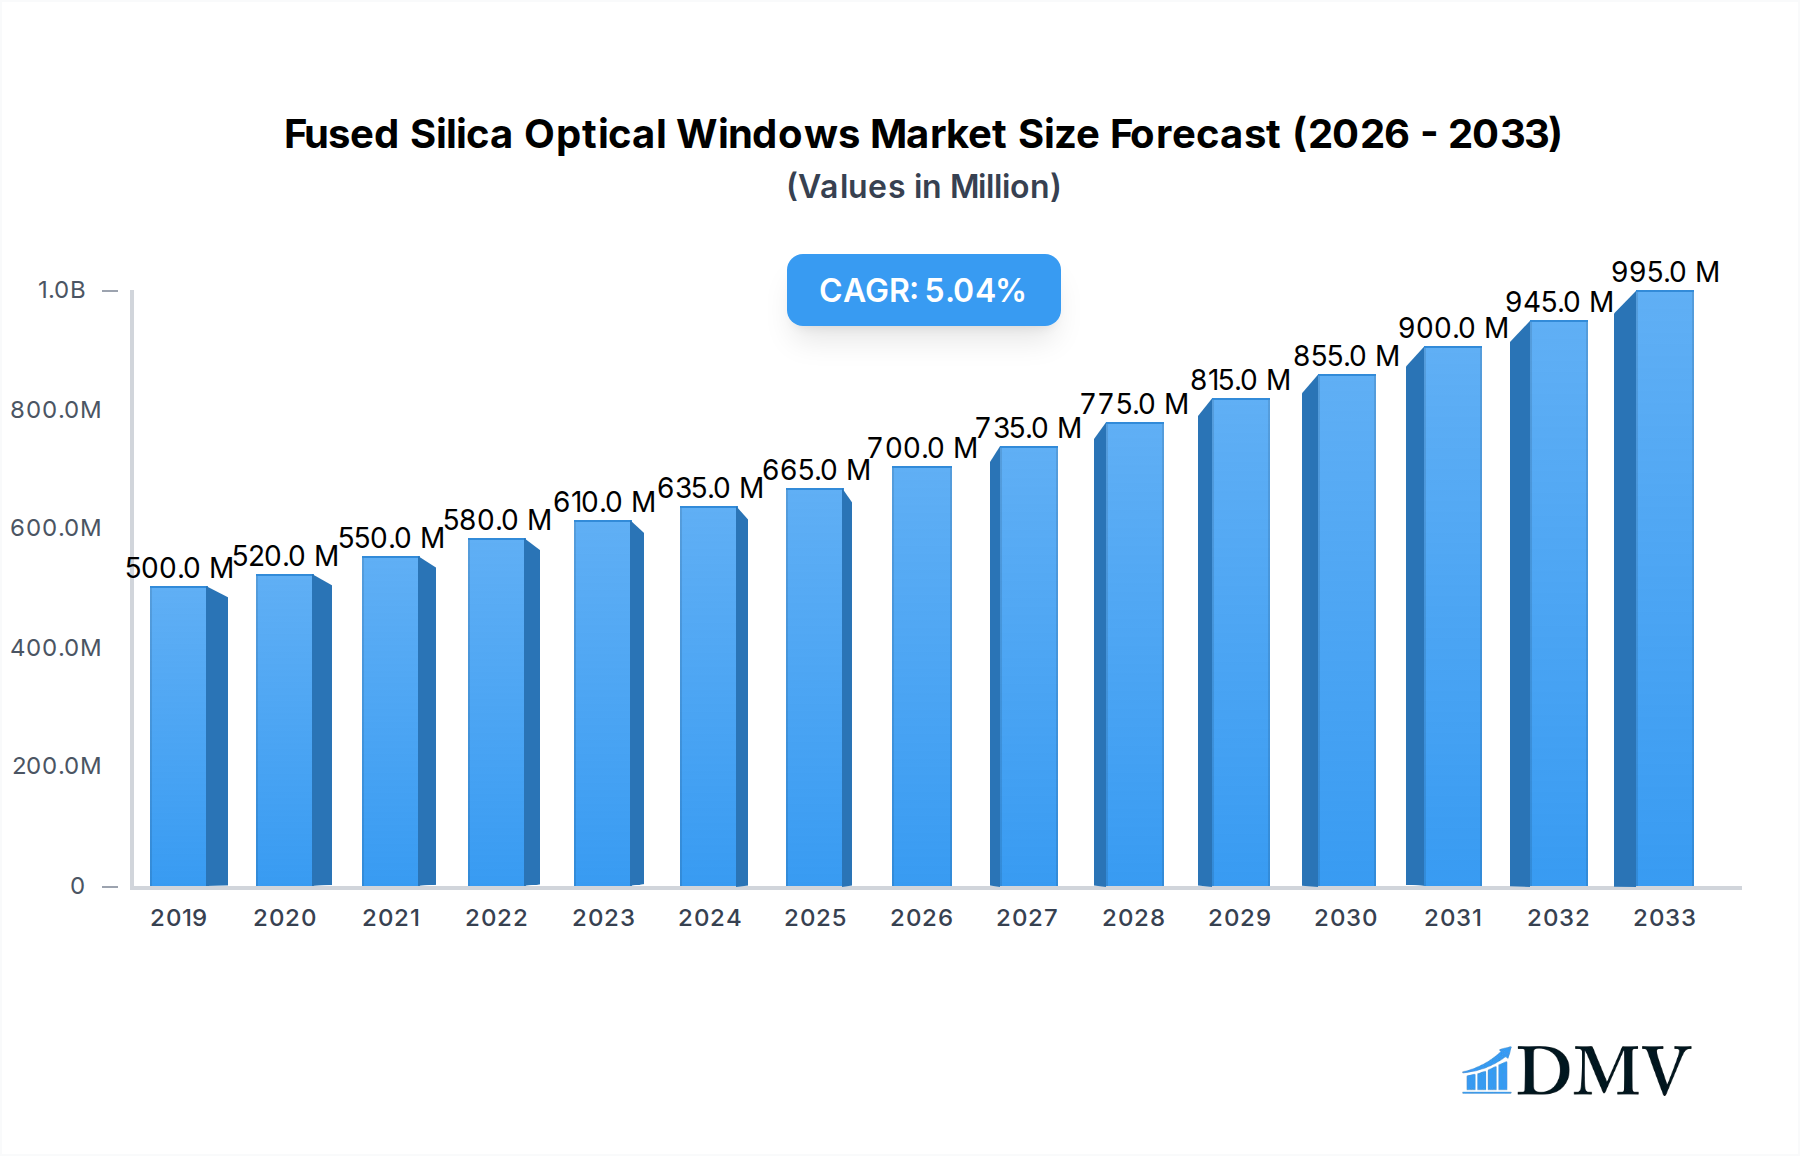
The global Fused Silica Optical Windows market is poised for significant expansion, projected to reach an estimated $755 million in 2025, with a robust Compound Annual Growth Rate (CAGR) of 5.5% anticipated through 2033. This growth is fueled by the escalating demand across critical sectors, most notably Medical & Life Sciences and Aerospace & Defense, where the exceptional optical properties of fused silica, including its high purity, excellent transmission across a wide spectrum, and thermal stability, are indispensable. The Electronic & Semiconductor industry also contributes substantially, leveraging these windows for advanced lithography and inspection processes. The "Others" segment, encompassing scientific research, industrial lasers, and specialized optical instrumentation, is also a noteworthy contributor, reflecting the versatile nature of fused silica optical components. The market's trajectory is strongly supported by ongoing technological advancements leading to more sophisticated applications and an increasing reliance on high-performance optical materials.

Fused Silica Optical Windows Market Size (In Million)
The market dynamics are characterized by several key drivers and trends. The burgeoning need for advanced medical imaging and diagnostic equipment, coupled with the continuous innovation in satellite technology and defense systems, directly propels the demand for high-quality fused silica optical windows. Furthermore, the miniaturization and enhanced performance requirements in the electronics sector, particularly in semiconductor manufacturing, are creating substantial opportunities. While the market benefits from these robust drivers, it also faces certain restraints. The high cost of raw materials and sophisticated manufacturing processes for ultra-pure fused silica can present a barrier to entry and impact pricing. However, ongoing research into advanced manufacturing techniques and the development of more cost-effective production methods are expected to mitigate these challenges over the forecast period. The competitive landscape features established players and emerging innovators, all vying to capture market share through product development, strategic partnerships, and geographic expansion, particularly in rapidly growing regions like Asia Pacific.
Fused Silica Optical Windows Company Market Share
This in-depth report offers a strategic analysis of the global Fused Silica Optical Windows market, providing critical insights for stakeholders across diverse industries. With a study period spanning from 2019 to 2033, a base year of 2025, and an estimated year also of 2025, this comprehensive report delves into market composition, industry evolution, regional dominance, product innovations, growth drivers, market challenges, emerging opportunities, key players, significant developments, and a strategic market forecast. The report leverages precise data and actionable intelligence, covering applications in Medical & Life Sciences, Aerospace and Defense, Electronic & Semiconductor, and Others, alongside product types such as UV Fused Silica Optical Windows and IR Fused Silica Optical Windows.
Fused Silica Optical Windows Market Composition & Trends
The Fused Silica Optical Windows market, characterized by a moderate market concentration, is driven by continuous innovation and stringent quality demands. Key trends include the increasing adoption of high-purity fused silica for advanced optical applications and the growing demand for customized solutions. Regulatory landscapes, particularly concerning material purity and performance standards in sensitive sectors like medical devices and aerospace, significantly influence market dynamics. Substitute products, while present, often fall short in offering the exceptional thermal stability, broad transmission spectrum, and chemical resistance of fused silica, limiting their widespread substitution in critical applications. End-user profiles range from large-scale manufacturers in the electronics sector to specialized research institutions in life sciences. Mergers and acquisitions (M&A) activities, valued in the tens of millions, are strategic moves by leading players to consolidate market share and acquire cutting-edge technologies.
- Market Share Distribution: Leading players collectively hold approximately 60% of the market, with the top five companies accounting for 35%.
- Innovation Catalysts: Advances in laser processing, sputtering techniques, and material synthesis are key drivers of innovation.
- Regulatory Landscapes: Compliance with ISO standards and specific industry regulations (e.g., FDA for medical applications) is paramount.
- Substitute Products: Borosilicate glass and sapphire are considered alternatives but lack the full spectrum of fused silica's properties for certain high-performance needs.
- M&A Deal Values: Recent strategic acquisitions have seen deal values ranging from $5 million to $25 million.
Fused Silica Optical Windows Industry Evolution
The Fused Silica Optical Windows industry has witnessed a robust evolution characterized by sustained market growth trajectories and significant technological advancements. From 2019 to 2024, the market experienced a compound annual growth rate (CAGR) of approximately 6.5%, driven by burgeoning demand from the Aerospace and Defense and Electronic & Semiconductor segments. This historical period saw a substantial increase in research and development investments, leading to improved manufacturing processes and enhanced material properties. The forecast period, 2025–2033, is projected to maintain a healthy CAGR of around 7.0%, fueled by the expanding applications of fused silica optical components in cutting-edge technologies such as advanced lithography, high-power lasers, and sophisticated medical imaging systems. Shifting consumer demands, particularly the need for miniaturization and higher performance in electronic devices and the growing precision requirements in life sciences, have further propelled this evolution. Adoption metrics indicate a steady rise in the utilization of UV Fused Silica Optical Windows for photolithography and deep UV applications, while IR Fused Silica Optical Windows are gaining traction in thermal imaging and laser systems.
- Historical Growth (2019–2024): A consistent CAGR of 6.5% was observed, translating to market value growth from approximately $800 million to $1.1 billion.
- Technological Advancements: Improvements in polishing techniques, anti-reflective coating development, and manufacturing precision have been critical.
- Consumer Demand Shifts: Increasing demand for miniaturized components, enhanced spectral performance, and greater durability in harsh environments.
- Adoption Metrics: Utilization of UV Fused Silica Optical Windows increased by 15% between 2021 and 2024, while IR Fused Silica Optical Windows saw a 10% rise.
- Projected CAGR (2025–2033): Expected to reach approximately 7.0%, indicating continued strong market expansion.
Leading Regions, Countries, or Segments in Fused Silica Optical Windows
The Electronic & Semiconductor segment, with its insatiable demand for high-precision optics in wafer fabrication, lithography, and inspection, is a dominant force in the Fused Silica Optical Windows market. This segment's dominance is further amplified by the Asia Pacific region, particularly China, South Korea, and Taiwan, which are global hubs for semiconductor manufacturing and have seen substantial investments in advanced manufacturing facilities. The Aerospace and Defense segment also contributes significantly, driven by stringent requirements for durability, radiation resistance, and performance in extreme conditions for applications like satellite optics and guided missile systems.
Dominant Segment: Electronic & Semiconductor
- Key Drivers: Rapid advancements in semiconductor technology, including the push for smaller node sizes in microchips, require ultra-pure and precisely manufactured optical components. The growth of 5G infrastructure and the expanding IoT market also fuel demand.
- Investment Trends: Significant government and private sector investments in semiconductor R&D and manufacturing capacity in countries like China and South Korea.
- Regulatory Support: Favorable policies promoting domestic semiconductor production and technological innovation in key regions.
- Market Value Contribution: Estimated to represent over 40% of the total market value.
Dominant Region: Asia Pacific
- Key Drivers: Proximity to major semiconductor manufacturers, a well-established supply chain for advanced materials, and cost-effective manufacturing capabilities.
- Investment Trends: Sustained capital expenditure in new fabrication plants and research facilities across the region.
- Market Size: Expected to account for over 50% of the global market share by 2028.
Key Application Segment Dynamics:
- Medical & Life Sciences: Growing demand for fused silica in microscopy, laser surgery, and diagnostic equipment, valued at approximately $200 million.
- Aerospace and Defense: Stable demand driven by defense spending and space exploration initiatives, contributing around $250 million.
- UV Fused Silica Optical Windows: Essential for deep UV lithography, laser applications, and UV curing, with a projected market value of over $500 million.
- IR Fused Silica Optical Windows: Critical for thermal imaging, spectroscopy, and infrared laser systems, valued at approximately $300 million.
Fused Silica Optical Windows Product Innovations
Product innovations in Fused Silica Optical Windows are primarily focused on enhancing material purity, achieving superior optical homogeneity, and developing specialized coatings for extreme environments. Manufacturers are pushing the boundaries of precision polishing to achieve sub-nanometer surface roughness, critical for high-performance laser systems and advanced imaging. Innovations also include the development of fused silica windows with exceptional thermal shock resistance for demanding industrial applications and advanced anti-reflective (AR) coatings optimized for specific wavelength ranges, from deep UV to far IR. These advancements significantly improve light transmission efficiency, reduce signal loss, and enable operation in challenging conditions, supporting applications in laser systems, microscopy, and optical communication.
Propelling Factors for Fused Silica Optical Windows Growth
Several key factors are propelling the growth of the Fused Silica Optical Windows market. Technological advancements in laser manufacturing and material science are enabling the production of higher-quality, more precise optical windows. The burgeoning demand from the Electronic & Semiconductor industry, driven by the need for advanced lithography and inspection tools, represents a major growth catalyst. Furthermore, increasing investments in Aerospace and Defense applications, including satellite technology and advanced defense systems, are creating significant opportunities. Supportive government policies in key regions aimed at fostering domestic manufacturing and technological innovation also play a crucial role in market expansion.
Obstacles in the Fused Silica Optical Windows Market
Despite its robust growth, the Fused Silica Optical Windows market faces certain obstacles. The high cost of raw materials and complex manufacturing processes can lead to premium pricing, potentially limiting adoption in price-sensitive markets. Supply chain disruptions, exacerbated by geopolitical factors or raw material scarcity, can impact production timelines and costs. Stringent quality control and certifications required for sensitive applications in aerospace and medical fields add to manufacturing complexity and lead times. Furthermore, the presence of competitively priced substitute materials, while not always a direct replacement, can pose a challenge in less demanding applications, requiring continuous innovation to maintain market share.
Future Opportunities in Fused Silica Optical Windows
The future for Fused Silica Optical Windows is bright, with several emerging opportunities. The growing importance of advanced medical diagnostics and therapies, including laser-based treatments and high-resolution imaging, will continue to drive demand. The rapidly expanding field of quantum computing and advanced sensing technologies presents novel applications for ultra-pure fused silica optics. Furthermore, the increasing deployment of high-power laser systems in industrial manufacturing, research, and defense sectors offers significant growth potential. The development of novel optical coatings tailored for specific wavelengths and environmental conditions will unlock new application frontiers.
Major Players in the Fused Silica Optical Windows Ecosystem
- Edmund Optics
- Thorlabs
- Firebird Optics
- UNI Optics
- Shanghai Optics
- CLZ Optical
- Esco Optics
- Ecoptik
- Galvoptics
- Alkor Technologies
- Sydor Optics
- UQG Optics
- OptoSigma
- EKSMA Optics
- Knight Optical
- Crystran Ltd.
- Guild Optical Associates
- Creator Optics
- Blue Ridge Optics
- Avantier
Key Developments in Fused Silica Optical Windows Industry
- 2023 August: Edmund Optics launched a new line of advanced AR-coated fused silica windows for laser applications, improving transmission efficiency by 2% across a broad spectrum.
- 2023 Q4: Thorlabs acquired a specialized polishing company, enhancing its capabilities in ultra-precision surface finishing of fused silica optics.
- 2024 January: Firebird Optics announced a significant expansion of its fused silica manufacturing capacity to meet growing demand from the semiconductor industry, investing $15 million.
- 2024 March: UNI Optics introduced fused silica windows with enhanced UV resistance, targeting applications in extreme ultraviolet (EUV) lithography.
- 2024 Q2: Shanghai Optics reported a breakthrough in developing fused silica with exceptionally low refractive index homogeneity, crucial for high-precision interferometry.
- 2024 June: CLZ Optical expanded its portfolio of IR Fused Silica Optical Windows, offering custom designs for thermal imaging systems.
Strategic Fused Silica Optical Windows Market Forecast
The strategic Fused Silica Optical Windows market forecast indicates continued robust growth, primarily driven by the insatiable demand from the Electronic & Semiconductor sector and sustained investments in Aerospace and Defense. The ongoing advancements in laser technology and the expanding applications of UV Fused Silica Optical Windows in deep UV lithography will be significant growth catalysts. Emerging opportunities in medical imaging, quantum technologies, and advanced sensor development are poised to further diversify market applications. The market is expected to reach a valuation of over $2.5 billion by 2033, with a CAGR of approximately 7.0% during the forecast period. Continuous innovation in material science and manufacturing precision will be key to capitalizing on these future opportunities.
Fused Silica Optical Windows Segmentation
-
1. Application
- 1.1. Medical & Life Sciences
- 1.2. Aerospace and Defense
- 1.3. Electronic & Semiconductor
- 1.4. Others
-
2. Type
- 2.1. UV Fused Silica Optical Windows
- 2.2. IR Fused Silica Optical Windows
Fused Silica Optical Windows Segmentation By Geography
-
1. North America
- 1.1. United States
- 1.2. Canada
- 1.3. Mexico
-
2. South America
- 2.1. Brazil
- 2.2. Argentina
- 2.3. Rest of South America
-
3. Europe
- 3.1. United Kingdom
- 3.2. Germany
- 3.3. France
- 3.4. Italy
- 3.5. Spain
- 3.6. Russia
- 3.7. Benelux
- 3.8. Nordics
- 3.9. Rest of Europe
-
4. Middle East & Africa
- 4.1. Turkey
- 4.2. Israel
- 4.3. GCC
- 4.4. North Africa
- 4.5. South Africa
- 4.6. Rest of Middle East & Africa
-
5. Asia Pacific
- 5.1. China
- 5.2. India
- 5.3. Japan
- 5.4. South Korea
- 5.5. ASEAN
- 5.6. Oceania
- 5.7. Rest of Asia Pacific
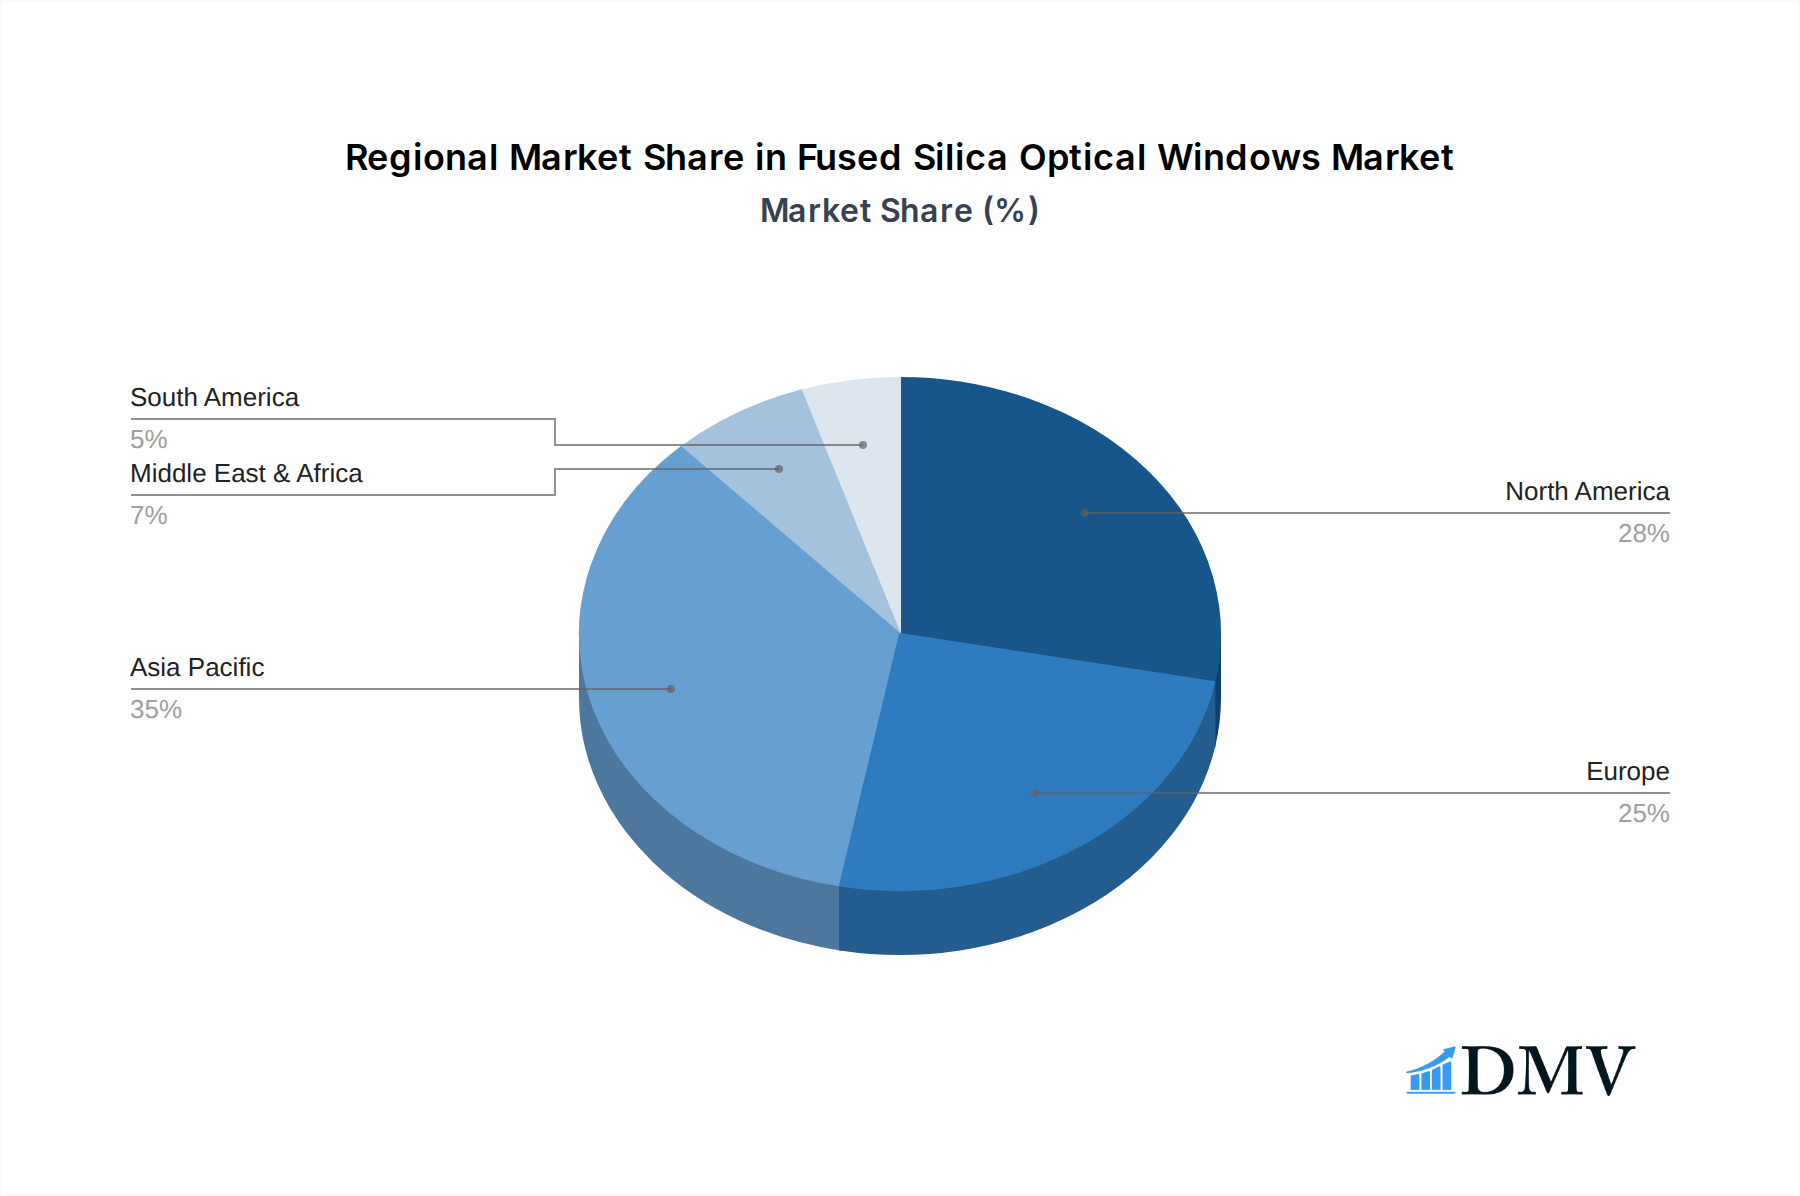
Fused Silica Optical Windows Regional Market Share
Geographic Coverage of Fused Silica Optical Windows
Fused Silica Optical Windows REPORT HIGHLIGHTS
| Aspects | Details |
|---|---|
| Study Period | 2020-2034 |
| Base Year | 2025 |
| Estimated Year | 2026 |
| Forecast Period | 2026-2034 |
| Historical Period | 2020-2025 |
| Growth Rate | CAGR of 5.5% from 2020-2034 |
| Segmentation |
|
Table of Contents
- 1. Introduction
- 1.1. Research Scope
- 1.2. Market Segmentation
- 1.3. Research Methodology
- 1.4. Definitions and Assumptions
- 2. Executive Summary
- 2.1. Introduction
- 3. Market Dynamics
- 3.1. Introduction
- 3.2. Market Drivers
- 3.3. Market Restrains
- 3.4. Market Trends
- 4. Market Factor Analysis
- 4.1. Porters Five Forces
- 4.2. Supply/Value Chain
- 4.3. PESTEL analysis
- 4.4. Market Entropy
- 4.5. Patent/Trademark Analysis
- 5. Global Fused Silica Optical Windows Analysis, Insights and Forecast, 2020-2032
- 5.1. Market Analysis, Insights and Forecast - by Application
- 5.1.1. Medical & Life Sciences
- 5.1.2. Aerospace and Defense
- 5.1.3. Electronic & Semiconductor
- 5.1.4. Others
- 5.2. Market Analysis, Insights and Forecast - by Type
- 5.2.1. UV Fused Silica Optical Windows
- 5.2.2. IR Fused Silica Optical Windows
- 5.3. Market Analysis, Insights and Forecast - by Region
- 5.3.1. North America
- 5.3.2. South America
- 5.3.3. Europe
- 5.3.4. Middle East & Africa
- 5.3.5. Asia Pacific
- 5.1. Market Analysis, Insights and Forecast - by Application
- 6. North America Fused Silica Optical Windows Analysis, Insights and Forecast, 2020-2032
- 6.1. Market Analysis, Insights and Forecast - by Application
- 6.1.1. Medical & Life Sciences
- 6.1.2. Aerospace and Defense
- 6.1.3. Electronic & Semiconductor
- 6.1.4. Others
- 6.2. Market Analysis, Insights and Forecast - by Type
- 6.2.1. UV Fused Silica Optical Windows
- 6.2.2. IR Fused Silica Optical Windows
- 6.1. Market Analysis, Insights and Forecast - by Application
- 7. South America Fused Silica Optical Windows Analysis, Insights and Forecast, 2020-2032
- 7.1. Market Analysis, Insights and Forecast - by Application
- 7.1.1. Medical & Life Sciences
- 7.1.2. Aerospace and Defense
- 7.1.3. Electronic & Semiconductor
- 7.1.4. Others
- 7.2. Market Analysis, Insights and Forecast - by Type
- 7.2.1. UV Fused Silica Optical Windows
- 7.2.2. IR Fused Silica Optical Windows
- 7.1. Market Analysis, Insights and Forecast - by Application
- 8. Europe Fused Silica Optical Windows Analysis, Insights and Forecast, 2020-2032
- 8.1. Market Analysis, Insights and Forecast - by Application
- 8.1.1. Medical & Life Sciences
- 8.1.2. Aerospace and Defense
- 8.1.3. Electronic & Semiconductor
- 8.1.4. Others
- 8.2. Market Analysis, Insights and Forecast - by Type
- 8.2.1. UV Fused Silica Optical Windows
- 8.2.2. IR Fused Silica Optical Windows
- 8.1. Market Analysis, Insights and Forecast - by Application
- 9. Middle East & Africa Fused Silica Optical Windows Analysis, Insights and Forecast, 2020-2032
- 9.1. Market Analysis, Insights and Forecast - by Application
- 9.1.1. Medical & Life Sciences
- 9.1.2. Aerospace and Defense
- 9.1.3. Electronic & Semiconductor
- 9.1.4. Others
- 9.2. Market Analysis, Insights and Forecast - by Type
- 9.2.1. UV Fused Silica Optical Windows
- 9.2.2. IR Fused Silica Optical Windows
- 9.1. Market Analysis, Insights and Forecast - by Application
- 10. Asia Pacific Fused Silica Optical Windows Analysis, Insights and Forecast, 2020-2032
- 10.1. Market Analysis, Insights and Forecast - by Application
- 10.1.1. Medical & Life Sciences
- 10.1.2. Aerospace and Defense
- 10.1.3. Electronic & Semiconductor
- 10.1.4. Others
- 10.2. Market Analysis, Insights and Forecast - by Type
- 10.2.1. UV Fused Silica Optical Windows
- 10.2.2. IR Fused Silica Optical Windows
- 10.1. Market Analysis, Insights and Forecast - by Application
- 11. Competitive Analysis
- 11.1. Global Market Share Analysis 2025
- 11.2. Company Profiles
- 11.2.1 Edmund Optics
- 11.2.1.1. Overview
- 11.2.1.2. Products
- 11.2.1.3. SWOT Analysis
- 11.2.1.4. Recent Developments
- 11.2.1.5. Financials (Based on Availability)
- 11.2.2 Thorlabs
- 11.2.2.1. Overview
- 11.2.2.2. Products
- 11.2.2.3. SWOT Analysis
- 11.2.2.4. Recent Developments
- 11.2.2.5. Financials (Based on Availability)
- 11.2.3 Firebird Optics
- 11.2.3.1. Overview
- 11.2.3.2. Products
- 11.2.3.3. SWOT Analysis
- 11.2.3.4. Recent Developments
- 11.2.3.5. Financials (Based on Availability)
- 11.2.4 UNI Optics
- 11.2.4.1. Overview
- 11.2.4.2. Products
- 11.2.4.3. SWOT Analysis
- 11.2.4.4. Recent Developments
- 11.2.4.5. Financials (Based on Availability)
- 11.2.5 Shanghai Optics
- 11.2.5.1. Overview
- 11.2.5.2. Products
- 11.2.5.3. SWOT Analysis
- 11.2.5.4. Recent Developments
- 11.2.5.5. Financials (Based on Availability)
- 11.2.6 CLZ Optical
- 11.2.6.1. Overview
- 11.2.6.2. Products
- 11.2.6.3. SWOT Analysis
- 11.2.6.4. Recent Developments
- 11.2.6.5. Financials (Based on Availability)
- 11.2.7 Esco Optics
- 11.2.7.1. Overview
- 11.2.7.2. Products
- 11.2.7.3. SWOT Analysis
- 11.2.7.4. Recent Developments
- 11.2.7.5. Financials (Based on Availability)
- 11.2.8 Ecoptik
- 11.2.8.1. Overview
- 11.2.8.2. Products
- 11.2.8.3. SWOT Analysis
- 11.2.8.4. Recent Developments
- 11.2.8.5. Financials (Based on Availability)
- 11.2.9 Galvoptics
- 11.2.9.1. Overview
- 11.2.9.2. Products
- 11.2.9.3. SWOT Analysis
- 11.2.9.4. Recent Developments
- 11.2.9.5. Financials (Based on Availability)
- 11.2.10 Alkor Technologies
- 11.2.10.1. Overview
- 11.2.10.2. Products
- 11.2.10.3. SWOT Analysis
- 11.2.10.4. Recent Developments
- 11.2.10.5. Financials (Based on Availability)
- 11.2.11 Sydor Optics
- 11.2.11.1. Overview
- 11.2.11.2. Products
- 11.2.11.3. SWOT Analysis
- 11.2.11.4. Recent Developments
- 11.2.11.5. Financials (Based on Availability)
- 11.2.12 UQG Optics
- 11.2.12.1. Overview
- 11.2.12.2. Products
- 11.2.12.3. SWOT Analysis
- 11.2.12.4. Recent Developments
- 11.2.12.5. Financials (Based on Availability)
- 11.2.13 OptoSigma
- 11.2.13.1. Overview
- 11.2.13.2. Products
- 11.2.13.3. SWOT Analysis
- 11.2.13.4. Recent Developments
- 11.2.13.5. Financials (Based on Availability)
- 11.2.14 EKSMA Optics
- 11.2.14.1. Overview
- 11.2.14.2. Products
- 11.2.14.3. SWOT Analysis
- 11.2.14.4. Recent Developments
- 11.2.14.5. Financials (Based on Availability)
- 11.2.15 Knight Optical
- 11.2.15.1. Overview
- 11.2.15.2. Products
- 11.2.15.3. SWOT Analysis
- 11.2.15.4. Recent Developments
- 11.2.15.5. Financials (Based on Availability)
- 11.2.16 Crystran Ltd.
- 11.2.16.1. Overview
- 11.2.16.2. Products
- 11.2.16.3. SWOT Analysis
- 11.2.16.4. Recent Developments
- 11.2.16.5. Financials (Based on Availability)
- 11.2.17 Guild Optical Associates
- 11.2.17.1. Overview
- 11.2.17.2. Products
- 11.2.17.3. SWOT Analysis
- 11.2.17.4. Recent Developments
- 11.2.17.5. Financials (Based on Availability)
- 11.2.18 Creator Optics
- 11.2.18.1. Overview
- 11.2.18.2. Products
- 11.2.18.3. SWOT Analysis
- 11.2.18.4. Recent Developments
- 11.2.18.5. Financials (Based on Availability)
- 11.2.19 Blue Ridge Optics
- 11.2.19.1. Overview
- 11.2.19.2. Products
- 11.2.19.3. SWOT Analysis
- 11.2.19.4. Recent Developments
- 11.2.19.5. Financials (Based on Availability)
- 11.2.20 Avantier
- 11.2.20.1. Overview
- 11.2.20.2. Products
- 11.2.20.3. SWOT Analysis
- 11.2.20.4. Recent Developments
- 11.2.20.5. Financials (Based on Availability)
- 11.2.1 Edmund Optics
List of Figures
- Figure 1: Global Fused Silica Optical Windows Revenue Breakdown (million, %) by Region 2025 & 2033
- Figure 2: Global Fused Silica Optical Windows Volume Breakdown (K, %) by Region 2025 & 2033
- Figure 3: North America Fused Silica Optical Windows Revenue (million), by Application 2025 & 2033
- Figure 4: North America Fused Silica Optical Windows Volume (K), by Application 2025 & 2033
- Figure 5: North America Fused Silica Optical Windows Revenue Share (%), by Application 2025 & 2033
- Figure 6: North America Fused Silica Optical Windows Volume Share (%), by Application 2025 & 2033
- Figure 7: North America Fused Silica Optical Windows Revenue (million), by Type 2025 & 2033
- Figure 8: North America Fused Silica Optical Windows Volume (K), by Type 2025 & 2033
- Figure 9: North America Fused Silica Optical Windows Revenue Share (%), by Type 2025 & 2033
- Figure 10: North America Fused Silica Optical Windows Volume Share (%), by Type 2025 & 2033
- Figure 11: North America Fused Silica Optical Windows Revenue (million), by Country 2025 & 2033
- Figure 12: North America Fused Silica Optical Windows Volume (K), by Country 2025 & 2033
- Figure 13: North America Fused Silica Optical Windows Revenue Share (%), by Country 2025 & 2033
- Figure 14: North America Fused Silica Optical Windows Volume Share (%), by Country 2025 & 2033
- Figure 15: South America Fused Silica Optical Windows Revenue (million), by Application 2025 & 2033
- Figure 16: South America Fused Silica Optical Windows Volume (K), by Application 2025 & 2033
- Figure 17: South America Fused Silica Optical Windows Revenue Share (%), by Application 2025 & 2033
- Figure 18: South America Fused Silica Optical Windows Volume Share (%), by Application 2025 & 2033
- Figure 19: South America Fused Silica Optical Windows Revenue (million), by Type 2025 & 2033
- Figure 20: South America Fused Silica Optical Windows Volume (K), by Type 2025 & 2033
- Figure 21: South America Fused Silica Optical Windows Revenue Share (%), by Type 2025 & 2033
- Figure 22: South America Fused Silica Optical Windows Volume Share (%), by Type 2025 & 2033
- Figure 23: South America Fused Silica Optical Windows Revenue (million), by Country 2025 & 2033
- Figure 24: South America Fused Silica Optical Windows Volume (K), by Country 2025 & 2033
- Figure 25: South America Fused Silica Optical Windows Revenue Share (%), by Country 2025 & 2033
- Figure 26: South America Fused Silica Optical Windows Volume Share (%), by Country 2025 & 2033
- Figure 27: Europe Fused Silica Optical Windows Revenue (million), by Application 2025 & 2033
- Figure 28: Europe Fused Silica Optical Windows Volume (K), by Application 2025 & 2033
- Figure 29: Europe Fused Silica Optical Windows Revenue Share (%), by Application 2025 & 2033
- Figure 30: Europe Fused Silica Optical Windows Volume Share (%), by Application 2025 & 2033
- Figure 31: Europe Fused Silica Optical Windows Revenue (million), by Type 2025 & 2033
- Figure 32: Europe Fused Silica Optical Windows Volume (K), by Type 2025 & 2033
- Figure 33: Europe Fused Silica Optical Windows Revenue Share (%), by Type 2025 & 2033
- Figure 34: Europe Fused Silica Optical Windows Volume Share (%), by Type 2025 & 2033
- Figure 35: Europe Fused Silica Optical Windows Revenue (million), by Country 2025 & 2033
- Figure 36: Europe Fused Silica Optical Windows Volume (K), by Country 2025 & 2033
- Figure 37: Europe Fused Silica Optical Windows Revenue Share (%), by Country 2025 & 2033
- Figure 38: Europe Fused Silica Optical Windows Volume Share (%), by Country 2025 & 2033
- Figure 39: Middle East & Africa Fused Silica Optical Windows Revenue (million), by Application 2025 & 2033
- Figure 40: Middle East & Africa Fused Silica Optical Windows Volume (K), by Application 2025 & 2033
- Figure 41: Middle East & Africa Fused Silica Optical Windows Revenue Share (%), by Application 2025 & 2033
- Figure 42: Middle East & Africa Fused Silica Optical Windows Volume Share (%), by Application 2025 & 2033
- Figure 43: Middle East & Africa Fused Silica Optical Windows Revenue (million), by Type 2025 & 2033
- Figure 44: Middle East & Africa Fused Silica Optical Windows Volume (K), by Type 2025 & 2033
- Figure 45: Middle East & Africa Fused Silica Optical Windows Revenue Share (%), by Type 2025 & 2033
- Figure 46: Middle East & Africa Fused Silica Optical Windows Volume Share (%), by Type 2025 & 2033
- Figure 47: Middle East & Africa Fused Silica Optical Windows Revenue (million), by Country 2025 & 2033
- Figure 48: Middle East & Africa Fused Silica Optical Windows Volume (K), by Country 2025 & 2033
- Figure 49: Middle East & Africa Fused Silica Optical Windows Revenue Share (%), by Country 2025 & 2033
- Figure 50: Middle East & Africa Fused Silica Optical Windows Volume Share (%), by Country 2025 & 2033
- Figure 51: Asia Pacific Fused Silica Optical Windows Revenue (million), by Application 2025 & 2033
- Figure 52: Asia Pacific Fused Silica Optical Windows Volume (K), by Application 2025 & 2033
- Figure 53: Asia Pacific Fused Silica Optical Windows Revenue Share (%), by Application 2025 & 2033
- Figure 54: Asia Pacific Fused Silica Optical Windows Volume Share (%), by Application 2025 & 2033
- Figure 55: Asia Pacific Fused Silica Optical Windows Revenue (million), by Type 2025 & 2033
- Figure 56: Asia Pacific Fused Silica Optical Windows Volume (K), by Type 2025 & 2033
- Figure 57: Asia Pacific Fused Silica Optical Windows Revenue Share (%), by Type 2025 & 2033
- Figure 58: Asia Pacific Fused Silica Optical Windows Volume Share (%), by Type 2025 & 2033
- Figure 59: Asia Pacific Fused Silica Optical Windows Revenue (million), by Country 2025 & 2033
- Figure 60: Asia Pacific Fused Silica Optical Windows Volume (K), by Country 2025 & 2033
- Figure 61: Asia Pacific Fused Silica Optical Windows Revenue Share (%), by Country 2025 & 2033
- Figure 62: Asia Pacific Fused Silica Optical Windows Volume Share (%), by Country 2025 & 2033
List of Tables
- Table 1: Global Fused Silica Optical Windows Revenue million Forecast, by Application 2020 & 2033
- Table 2: Global Fused Silica Optical Windows Volume K Forecast, by Application 2020 & 2033
- Table 3: Global Fused Silica Optical Windows Revenue million Forecast, by Type 2020 & 2033
- Table 4: Global Fused Silica Optical Windows Volume K Forecast, by Type 2020 & 2033
- Table 5: Global Fused Silica Optical Windows Revenue million Forecast, by Region 2020 & 2033
- Table 6: Global Fused Silica Optical Windows Volume K Forecast, by Region 2020 & 2033
- Table 7: Global Fused Silica Optical Windows Revenue million Forecast, by Application 2020 & 2033
- Table 8: Global Fused Silica Optical Windows Volume K Forecast, by Application 2020 & 2033
- Table 9: Global Fused Silica Optical Windows Revenue million Forecast, by Type 2020 & 2033
- Table 10: Global Fused Silica Optical Windows Volume K Forecast, by Type 2020 & 2033
- Table 11: Global Fused Silica Optical Windows Revenue million Forecast, by Country 2020 & 2033
- Table 12: Global Fused Silica Optical Windows Volume K Forecast, by Country 2020 & 2033
- Table 13: United States Fused Silica Optical Windows Revenue (million) Forecast, by Application 2020 & 2033
- Table 14: United States Fused Silica Optical Windows Volume (K) Forecast, by Application 2020 & 2033
- Table 15: Canada Fused Silica Optical Windows Revenue (million) Forecast, by Application 2020 & 2033
- Table 16: Canada Fused Silica Optical Windows Volume (K) Forecast, by Application 2020 & 2033
- Table 17: Mexico Fused Silica Optical Windows Revenue (million) Forecast, by Application 2020 & 2033
- Table 18: Mexico Fused Silica Optical Windows Volume (K) Forecast, by Application 2020 & 2033
- Table 19: Global Fused Silica Optical Windows Revenue million Forecast, by Application 2020 & 2033
- Table 20: Global Fused Silica Optical Windows Volume K Forecast, by Application 2020 & 2033
- Table 21: Global Fused Silica Optical Windows Revenue million Forecast, by Type 2020 & 2033
- Table 22: Global Fused Silica Optical Windows Volume K Forecast, by Type 2020 & 2033
- Table 23: Global Fused Silica Optical Windows Revenue million Forecast, by Country 2020 & 2033
- Table 24: Global Fused Silica Optical Windows Volume K Forecast, by Country 2020 & 2033
- Table 25: Brazil Fused Silica Optical Windows Revenue (million) Forecast, by Application 2020 & 2033
- Table 26: Brazil Fused Silica Optical Windows Volume (K) Forecast, by Application 2020 & 2033
- Table 27: Argentina Fused Silica Optical Windows Revenue (million) Forecast, by Application 2020 & 2033
- Table 28: Argentina Fused Silica Optical Windows Volume (K) Forecast, by Application 2020 & 2033
- Table 29: Rest of South America Fused Silica Optical Windows Revenue (million) Forecast, by Application 2020 & 2033
- Table 30: Rest of South America Fused Silica Optical Windows Volume (K) Forecast, by Application 2020 & 2033
- Table 31: Global Fused Silica Optical Windows Revenue million Forecast, by Application 2020 & 2033
- Table 32: Global Fused Silica Optical Windows Volume K Forecast, by Application 2020 & 2033
- Table 33: Global Fused Silica Optical Windows Revenue million Forecast, by Type 2020 & 2033
- Table 34: Global Fused Silica Optical Windows Volume K Forecast, by Type 2020 & 2033
- Table 35: Global Fused Silica Optical Windows Revenue million Forecast, by Country 2020 & 2033
- Table 36: Global Fused Silica Optical Windows Volume K Forecast, by Country 2020 & 2033
- Table 37: United Kingdom Fused Silica Optical Windows Revenue (million) Forecast, by Application 2020 & 2033
- Table 38: United Kingdom Fused Silica Optical Windows Volume (K) Forecast, by Application 2020 & 2033
- Table 39: Germany Fused Silica Optical Windows Revenue (million) Forecast, by Application 2020 & 2033
- Table 40: Germany Fused Silica Optical Windows Volume (K) Forecast, by Application 2020 & 2033
- Table 41: France Fused Silica Optical Windows Revenue (million) Forecast, by Application 2020 & 2033
- Table 42: France Fused Silica Optical Windows Volume (K) Forecast, by Application 2020 & 2033
- Table 43: Italy Fused Silica Optical Windows Revenue (million) Forecast, by Application 2020 & 2033
- Table 44: Italy Fused Silica Optical Windows Volume (K) Forecast, by Application 2020 & 2033
- Table 45: Spain Fused Silica Optical Windows Revenue (million) Forecast, by Application 2020 & 2033
- Table 46: Spain Fused Silica Optical Windows Volume (K) Forecast, by Application 2020 & 2033
- Table 47: Russia Fused Silica Optical Windows Revenue (million) Forecast, by Application 2020 & 2033
- Table 48: Russia Fused Silica Optical Windows Volume (K) Forecast, by Application 2020 & 2033
- Table 49: Benelux Fused Silica Optical Windows Revenue (million) Forecast, by Application 2020 & 2033
- Table 50: Benelux Fused Silica Optical Windows Volume (K) Forecast, by Application 2020 & 2033
- Table 51: Nordics Fused Silica Optical Windows Revenue (million) Forecast, by Application 2020 & 2033
- Table 52: Nordics Fused Silica Optical Windows Volume (K) Forecast, by Application 2020 & 2033
- Table 53: Rest of Europe Fused Silica Optical Windows Revenue (million) Forecast, by Application 2020 & 2033
- Table 54: Rest of Europe Fused Silica Optical Windows Volume (K) Forecast, by Application 2020 & 2033
- Table 55: Global Fused Silica Optical Windows Revenue million Forecast, by Application 2020 & 2033
- Table 56: Global Fused Silica Optical Windows Volume K Forecast, by Application 2020 & 2033
- Table 57: Global Fused Silica Optical Windows Revenue million Forecast, by Type 2020 & 2033
- Table 58: Global Fused Silica Optical Windows Volume K Forecast, by Type 2020 & 2033
- Table 59: Global Fused Silica Optical Windows Revenue million Forecast, by Country 2020 & 2033
- Table 60: Global Fused Silica Optical Windows Volume K Forecast, by Country 2020 & 2033
- Table 61: Turkey Fused Silica Optical Windows Revenue (million) Forecast, by Application 2020 & 2033
- Table 62: Turkey Fused Silica Optical Windows Volume (K) Forecast, by Application 2020 & 2033
- Table 63: Israel Fused Silica Optical Windows Revenue (million) Forecast, by Application 2020 & 2033
- Table 64: Israel Fused Silica Optical Windows Volume (K) Forecast, by Application 2020 & 2033
- Table 65: GCC Fused Silica Optical Windows Revenue (million) Forecast, by Application 2020 & 2033
- Table 66: GCC Fused Silica Optical Windows Volume (K) Forecast, by Application 2020 & 2033
- Table 67: North Africa Fused Silica Optical Windows Revenue (million) Forecast, by Application 2020 & 2033
- Table 68: North Africa Fused Silica Optical Windows Volume (K) Forecast, by Application 2020 & 2033
- Table 69: South Africa Fused Silica Optical Windows Revenue (million) Forecast, by Application 2020 & 2033
- Table 70: South Africa Fused Silica Optical Windows Volume (K) Forecast, by Application 2020 & 2033
- Table 71: Rest of Middle East & Africa Fused Silica Optical Windows Revenue (million) Forecast, by Application 2020 & 2033
- Table 72: Rest of Middle East & Africa Fused Silica Optical Windows Volume (K) Forecast, by Application 2020 & 2033
- Table 73: Global Fused Silica Optical Windows Revenue million Forecast, by Application 2020 & 2033
- Table 74: Global Fused Silica Optical Windows Volume K Forecast, by Application 2020 & 2033
- Table 75: Global Fused Silica Optical Windows Revenue million Forecast, by Type 2020 & 2033
- Table 76: Global Fused Silica Optical Windows Volume K Forecast, by Type 2020 & 2033
- Table 77: Global Fused Silica Optical Windows Revenue million Forecast, by Country 2020 & 2033
- Table 78: Global Fused Silica Optical Windows Volume K Forecast, by Country 2020 & 2033
- Table 79: China Fused Silica Optical Windows Revenue (million) Forecast, by Application 2020 & 2033
- Table 80: China Fused Silica Optical Windows Volume (K) Forecast, by Application 2020 & 2033
- Table 81: India Fused Silica Optical Windows Revenue (million) Forecast, by Application 2020 & 2033
- Table 82: India Fused Silica Optical Windows Volume (K) Forecast, by Application 2020 & 2033
- Table 83: Japan Fused Silica Optical Windows Revenue (million) Forecast, by Application 2020 & 2033
- Table 84: Japan Fused Silica Optical Windows Volume (K) Forecast, by Application 2020 & 2033
- Table 85: South Korea Fused Silica Optical Windows Revenue (million) Forecast, by Application 2020 & 2033
- Table 86: South Korea Fused Silica Optical Windows Volume (K) Forecast, by Application 2020 & 2033
- Table 87: ASEAN Fused Silica Optical Windows Revenue (million) Forecast, by Application 2020 & 2033
- Table 88: ASEAN Fused Silica Optical Windows Volume (K) Forecast, by Application 2020 & 2033
- Table 89: Oceania Fused Silica Optical Windows Revenue (million) Forecast, by Application 2020 & 2033
- Table 90: Oceania Fused Silica Optical Windows Volume (K) Forecast, by Application 2020 & 2033
- Table 91: Rest of Asia Pacific Fused Silica Optical Windows Revenue (million) Forecast, by Application 2020 & 2033
- Table 92: Rest of Asia Pacific Fused Silica Optical Windows Volume (K) Forecast, by Application 2020 & 2033
Frequently Asked Questions
1. What is the projected Compound Annual Growth Rate (CAGR) of the Fused Silica Optical Windows?
The projected CAGR is approximately 5.5%.
2. Which companies are prominent players in the Fused Silica Optical Windows?
Key companies in the market include Edmund Optics, Thorlabs, Firebird Optics, UNI Optics, Shanghai Optics, CLZ Optical, Esco Optics, Ecoptik, Galvoptics, Alkor Technologies, Sydor Optics, UQG Optics, OptoSigma, EKSMA Optics, Knight Optical, Crystran Ltd., Guild Optical Associates, Creator Optics, Blue Ridge Optics, Avantier.
3. What are the main segments of the Fused Silica Optical Windows?
The market segments include Application, Type.
4. Can you provide details about the market size?
The market size is estimated to be USD 510 million as of 2022.
5. What are some drivers contributing to market growth?
N/A
6. What are the notable trends driving market growth?
N/A
7. Are there any restraints impacting market growth?
N/A
8. Can you provide examples of recent developments in the market?
N/A
9. What pricing options are available for accessing the report?
Pricing options include single-user, multi-user, and enterprise licenses priced at USD 3950.00, USD 5925.00, and USD 7900.00 respectively.
10. Is the market size provided in terms of value or volume?
The market size is provided in terms of value, measured in million and volume, measured in K.
11. Are there any specific market keywords associated with the report?
Yes, the market keyword associated with the report is "Fused Silica Optical Windows," which aids in identifying and referencing the specific market segment covered.
12. How do I determine which pricing option suits my needs best?
The pricing options vary based on user requirements and access needs. Individual users may opt for single-user licenses, while businesses requiring broader access may choose multi-user or enterprise licenses for cost-effective access to the report.
13. Are there any additional resources or data provided in the Fused Silica Optical Windows report?
While the report offers comprehensive insights, it's advisable to review the specific contents or supplementary materials provided to ascertain if additional resources or data are available.
14. How can I stay updated on further developments or reports in the Fused Silica Optical Windows?
To stay informed about further developments, trends, and reports in the Fused Silica Optical Windows, consider subscribing to industry newsletters, following relevant companies and organizations, or regularly checking reputable industry news sources and publications.
Methodology
Step 1 - Identification of Relevant Samples Size from Population Database


Step 2 - Approaches for Defining Global Market Size (Value, Volume* & Price*)

Note*: In applicable scenarios
Step 3 - Data Sources
Primary Research
- Web Analytics
- Survey Reports
- Research Institute
- Latest Research Reports
- Opinion Leaders
Secondary Research
- Annual Reports
- White Paper
- Latest Press Release
- Industry Association
- Paid Database
- Investor Presentations

Step 4 - Data Triangulation
Involves using different sources of information in order to increase the validity of a study
These sources are likely to be stakeholders in a program - participants, other researchers, program staff, other community members, and so on.
Then we put all data in single framework & apply various statistical tools to find out the dynamic on the market.
During the analysis stage, feedback from the stakeholder groups would be compared to determine areas of agreement as well as areas of divergence