

Key Insights
The global Chromatography Resins Market is poised for substantial expansion, projected to reach a significant $2480 million by 2025, driven by an impressive Compound Annual Growth Rate (CAGR) of over 7.00%. This robust growth is fueled by the increasing demand for high-purity compounds across various industries, particularly in pharmaceuticals and biotechnology for drug discovery, development, and production. Advancements in chromatography technologies, such as more efficient Ion Exchange and Affinity Chromatography resins, are enabling researchers to achieve finer separations, leading to improved product quality and yield. The expanding applications in water and environmental testing, along with the growing food and beverage sector's focus on quality control and contaminant analysis, further bolster market momentum. Key market drivers include the escalating need for biopharmaceuticals, personalized medicine, and stringent regulatory requirements for product purity. The market also benefits from continuous innovation in resin chemistry and manufacturing processes, enhancing selectivity, capacity, and reusability.
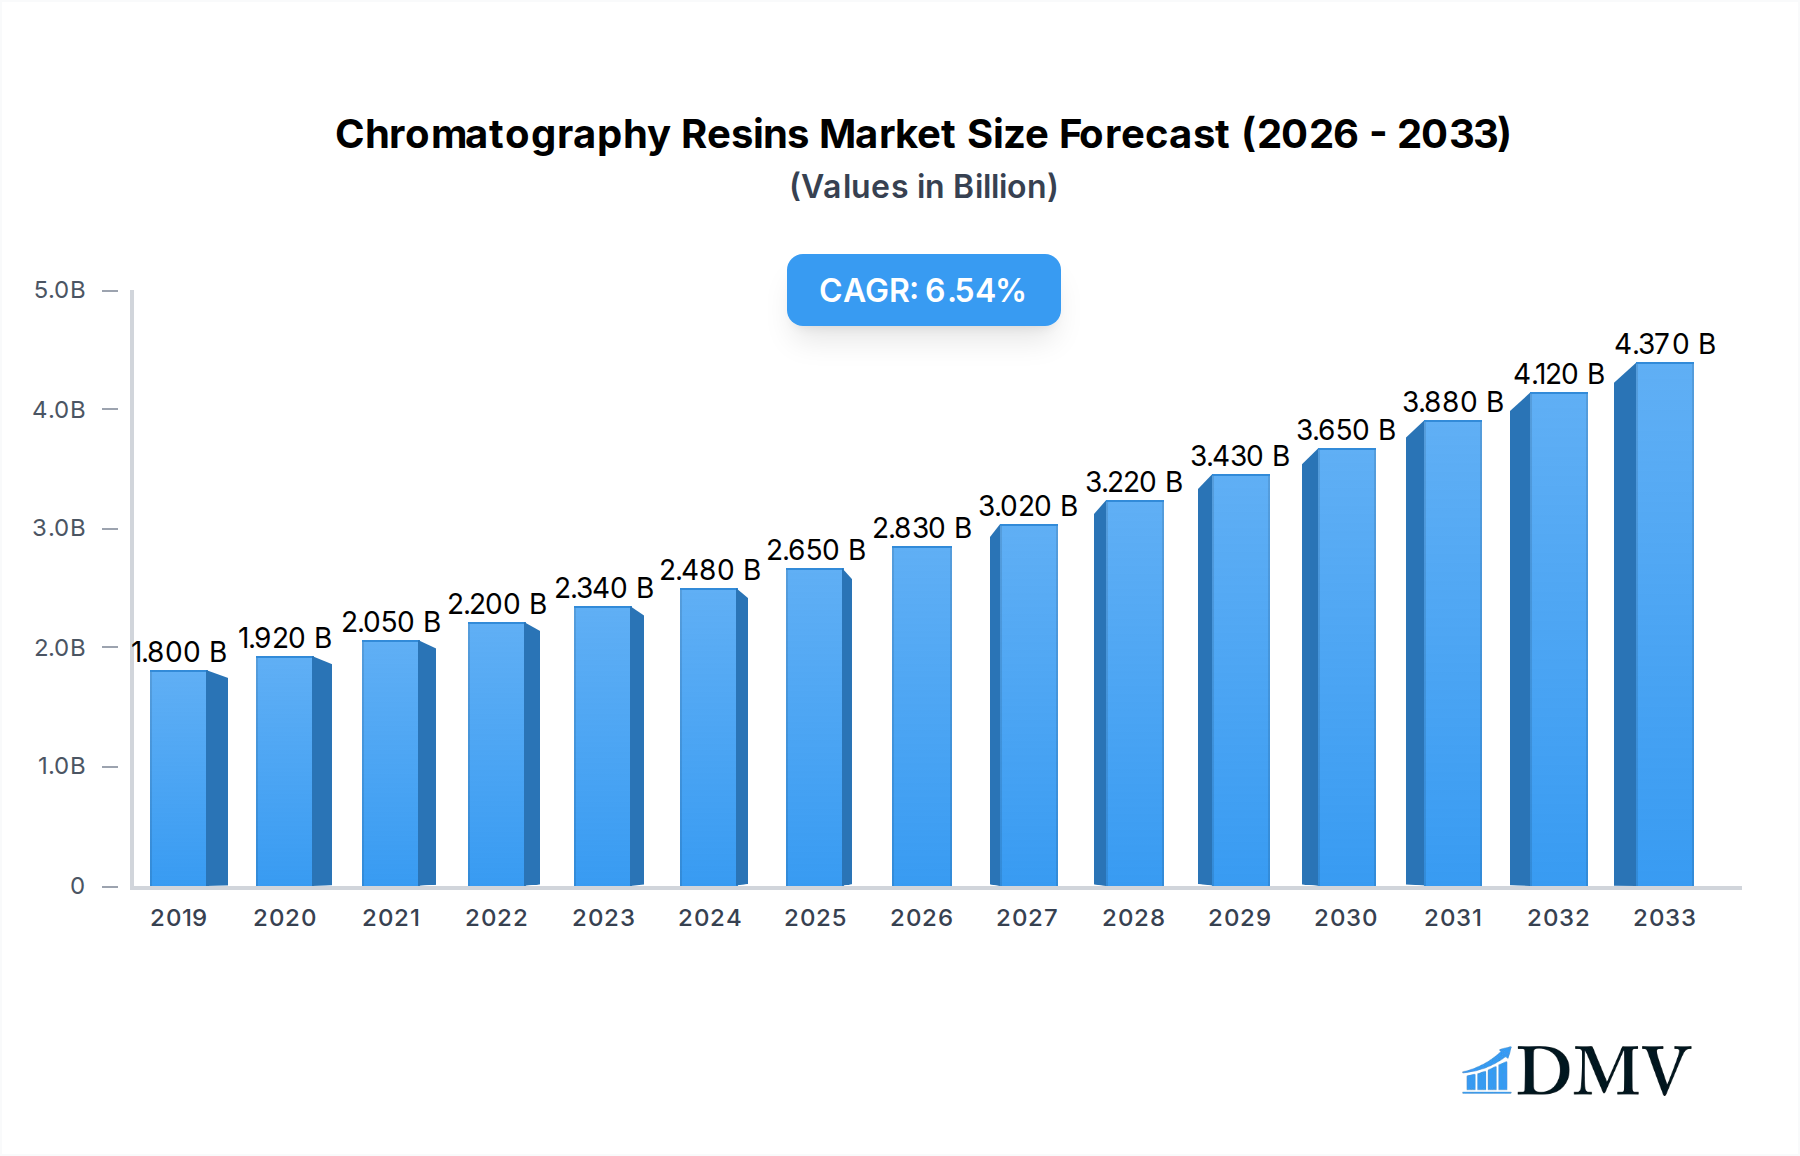
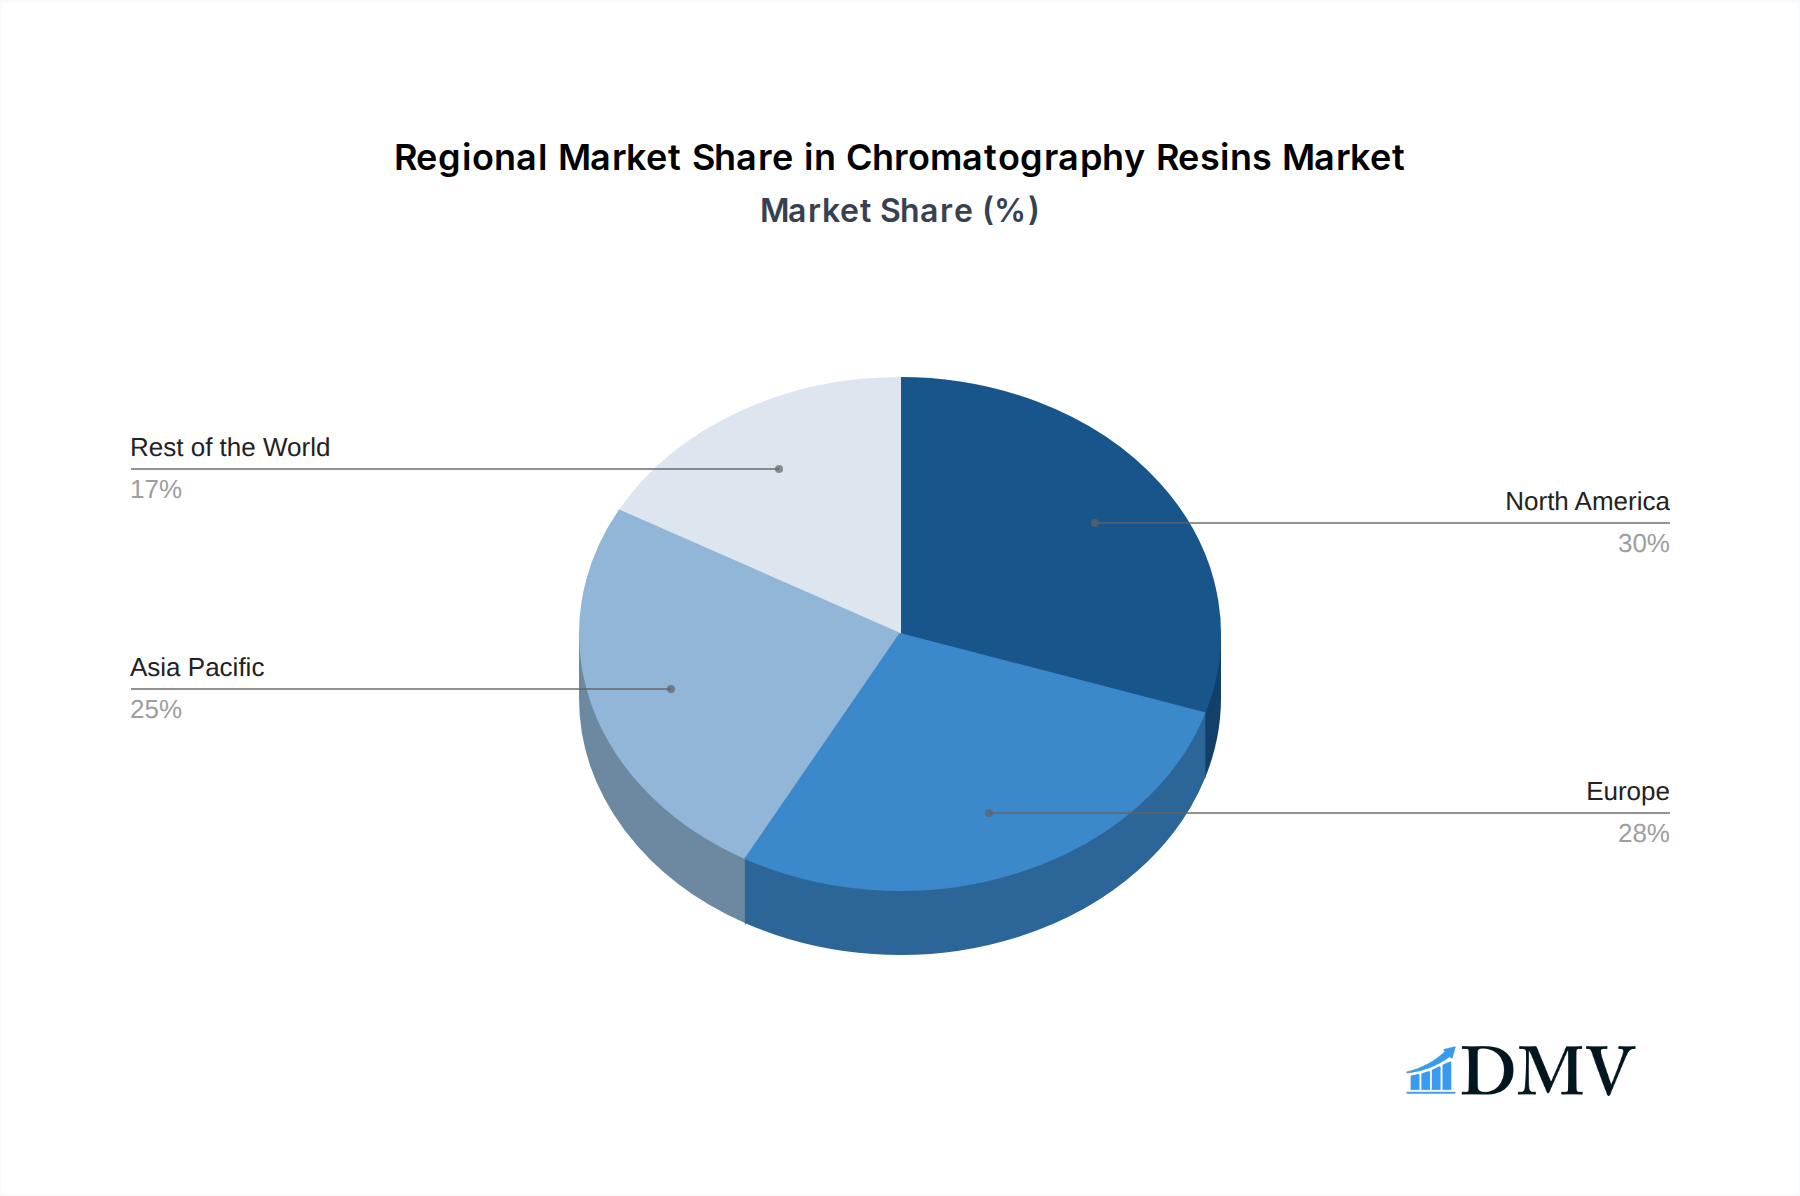
Chromatography Resins Market Market Size (In Billion)
The market segmentation reveals a dynamic landscape. Natural-based resins, including Agarose and Dextran, continue to hold a significant share due to their biocompatibility and specific binding properties. However, synthetic-based resins like Silica Gel, Aluminum Oxide, Polystyrene, and other synthetic resins are gaining traction due to their versatility, cost-effectiveness, and tailored functionalities for diverse applications. In terms of technology, Ion Exchange and Affinity Chromatography resins are expected to dominate due to their effectiveness in protein purification and biomolecule separation. Size Exclusion and Hydrophobic Interaction Chromatography resins also play crucial roles in specific analytical and preparative applications. Geographically, North America and Europe currently lead the market, driven by well-established pharmaceutical and biotechnology industries. However, the Asia Pacific region, particularly China and India, is anticipated to witness the fastest growth, fueled by increasing investments in R&D, a burgeoning biopharmaceutical sector, and a growing demand for advanced analytical techniques in food and environmental monitoring. Restraints such as the high cost of some specialized resins and the complexity of resin regeneration processes are being addressed through ongoing technological advancements and the development of more durable and cost-effective alternatives.

Chromatography Resins Market Company Market Share
Comprehensive Chromatography Resins Market Report: Trends, Forecasts, and Key Players (2019-2033)
This in-depth report provides a thorough analysis of the global Chromatography Resins Market, offering critical insights into market dynamics, growth drivers, technological advancements, and competitive landscapes. Covering the study period of 2019–2033, with a base year of 2025, this research equips stakeholders with actionable intelligence to navigate this rapidly evolving industry. Explore natural-based resins and synthetic-based resins, diverse chromatography technologies, and their pivotal role across key end-user industries, including pharmaceuticals, water and environmental agencies, and food and beverages. Uncover the strategic moves of major players and anticipate future market trajectory through our strategic market forecast.
Chromatography Resins Market Market Composition & Trends
The global Chromatography Resins Market exhibits a dynamic composition, characterized by a moderate market concentration with key players like Thermo Fisher Scientific, Avantor Inc., and Merck KGaA holding significant shares, estimated at over 60% in 2025. Innovation serves as a primary catalyst, driven by increasing R&D investments in advanced purification techniques within the pharmaceuticals sector, particularly in biotechnology and drug discovery. The regulatory landscape, while stringent, also fosters innovation, mandating higher purity standards for biopharmaceuticals and food products. Substitute products, though present in niche applications, are largely overshadowed by the superior performance of chromatography resins in high-value separation processes. End-user profiles are increasingly sophisticated, with pharmaceutical companies demanding higher throughput, better resolution, and cost-effective solutions for both small molecule and biologic purification. M&A activities are shaping the market, with a total deal value estimated to be in the billions over the historical period.
- Market Share Distribution (2025 Estimate):
- Top 5 Players: XX%
- Top 10 Players: XX%
- Fragmented Market Share: XX%
- Key M&A Activities (Historical Period):
- Notable deals in the chromatography consumables space, bolstering product portfolios and market reach.
- Acquisitions focusing on specialized affinity chromatography resins and ion exchange chromatography resins.
Chromatography Resins Market Industry Evolution
The Chromatography Resins Market has witnessed remarkable evolution, transitioning from basic separation techniques to highly sophisticated purification platforms that are indispensable for modern scientific advancements. The market's growth trajectory has been consistently upward, propelled by a CAGR of approximately XX% during the historical period and projected to continue at a robust XX% during the forecast period. Technological advancements have been the cornerstone of this evolution. Early adoption of synthetic-based resins like silica gel and polystyrene offered improved performance and scalability compared to their natural-based counterparts such as agarose and dextran. However, recent innovations have seen a resurgence in optimized natural-based resins for specific biologic purifications. The shift towards advanced chromatography technologies like affinity chromatography resins, offering highly specific binding capabilities, and size exclusion chromatography resins, crucial for protein characterization, has significantly broadened the application scope.
Consumer demands have also played a pivotal role. The escalating need for high-purity pharmaceuticals, particularly biologics and vaccines, has driven the demand for resins capable of achieving stringent purity standards and maximizing yield. The increasing complexity of drug molecules, including monoclonal antibodies and gene therapies, necessitates resins with enhanced selectivity and capacity. Furthermore, the growing awareness and regulatory focus on water quality and environmental monitoring have expanded the market for water and environmental agencies as end-users. Food and beverage industries are also leveraging chromatography for quality control and contaminant detection, further fueling market expansion. The market's ability to adapt to these evolving demands by developing novel resin chemistries, improving particle size distribution for better flow rates, and enhancing resin stability under various operating conditions underscores its dynamic nature and promising future. The overall market size in 2025 is estimated to be USD XXXX Million, with projected growth to USD XXXX Million by 2033.
Leading Regions, Countries, or Segments in Chromatography Resins Market
North America and Europe currently dominate the Chromatography Resins Market, driven by their well-established pharmaceutical and biotechnology industries, significant R&D investments, and stringent regulatory frameworks. In North America, the United States leads with a substantial market share, fueled by a robust pipeline of biologic drugs and a strong presence of leading pharmaceutical companies. Europe, with countries like Germany, the UK, and Switzerland, also exhibits high demand due to advanced healthcare infrastructure and a thriving biopharmaceutical sector.
The dominance of certain segments is particularly evident:
- End-user Industry:
- Pharmaceuticals: This segment, encompassing biotechnology, drug discovery, and drug production, is the largest and fastest-growing contributor to the market. The relentless pursuit of novel therapeutics, coupled with the increasing complexity of biologic drugs, necessitates advanced purification solutions. The market for affinity chromatography resins within the pharmaceutical sector is particularly strong due to their high specificity in capturing target molecules. The overall pharmaceutical segment is estimated to contribute USD XXXX Million in 2025.
- Technology:
- Ion Exchange Chromatography Resins: These remain a foundational technology due to their cost-effectiveness and broad applicability in protein and nucleic acid purification. Their versatility in separating molecules based on charge makes them essential across various stages of biopharmaceutical manufacturing.
- Affinity Chromatography Resins: While often more expensive, the unparalleled specificity and high recovery rates offered by affinity chromatography, especially in capturing target proteins, make them indispensable for high-value biopharmaceutical purification. The market for custom affinity resins is also expanding.
- Origin:
- Synthetic-based Resins: Particularly silica gel and polystyrene, continue to hold a significant market share due to their consistent performance, mechanical strength, and ease of functionalization. Their scalability and cost-effectiveness make them suitable for a wide range of applications.
- However, natural-based resins, especially optimized agarose resins, are gaining traction for highly sensitive biologic applications where mild operating conditions are crucial.
Key drivers for regional dominance include:
- Investment Trends: Significant venture capital and government funding for life sciences research and development.
- Regulatory Support: Favorable regulatory environments that encourage pharmaceutical innovation and product approvals.
- Technological Infrastructure: Availability of advanced manufacturing facilities and research institutions.
- Market Size and Demand: Large patient populations and a growing demand for advanced healthcare solutions.
Asia Pacific is emerging as a significant growth region, driven by increasing investments in biopharmaceutical manufacturing, a growing generics market, and government initiatives to boost domestic drug production.
Chromatography Resins Market Product Innovations
Product innovation in the Chromatography Resins Market is primarily focused on enhancing purification efficiency, increasing binding capacity, and improving resin longevity. Companies are developing novel resin chemistries that offer higher selectivity for complex biomolecules, such as exosomes and viral vectors, which are gaining prominence in gene and cell therapies. Innovations include the development of multimodal resins, capable of binding targets through multiple interaction mechanisms, thus improving capture efficiency and reducing the number of purification steps. Furthermore, advancements in resin manufacturing, such as controlled pore size distribution and improved bead integrity, lead to better flow characteristics and reduced backpressure, crucial for high-throughput applications in the pharmaceuticals sector. The development of single-use chromatography solutions, integrating advanced resins, is also a key trend, addressing concerns around cross-contamination and validation in biopharmaceutical manufacturing. These innovations are critical for achieving higher purity levels and cost-effectiveness in biopharmaceutical production and drug discovery.
Propelling Factors for Chromatography Resins Market Growth
The Chromatography Resins Market is propelled by several key factors. Firstly, the exponential growth of the biotechnology and pharmaceuticals sector, particularly the surging demand for complex biologics, monoclonal antibodies, and gene therapies, necessitates highly efficient and selective purification techniques. Secondly, increasing R&D investments in drug discovery and development worldwide are driving innovation and the adoption of advanced chromatography resins. Thirdly, stringent regulatory requirements for pharmaceutical purity and safety globally mandate the use of sophisticated purification methods, thereby boosting demand for high-performance resins. Technological advancements, such as the development of novel resin chemistries and improved manufacturing processes for affinity chromatography resins and ion exchange chromatography resins, are also critical growth enablers. Finally, the expanding applications of chromatography in other sectors like food and beverages for quality control and water and environmental agencies for contaminant analysis are contributing to market expansion. The market size is expected to grow at a CAGR of XX% from 2025 to 2033, reaching USD XXXX Million by 2033.
Obstacles in the Chromatography Resins Market Market
Despite the robust growth, the Chromatography Resins Market faces several obstacles. High development and manufacturing costs associated with specialized affinity chromatography resins and novel synthetic materials can limit accessibility for smaller research institutions and emerging markets. Stringent regulatory approval processes for new chromatography resins, especially for pharmaceutical applications, can lead to extended development timelines and increased R&D expenses. Supply chain disruptions, particularly for raw materials required in resin synthesis, can impact production volumes and lead to price volatility. Furthermore, the availability of cost-effective alternative separation technologies, though often less efficient for high-purity applications, poses a competitive challenge in certain market segments. The need for skilled personnel to operate and maintain sophisticated chromatography systems also presents a hurdle in certain regions.
Future Opportunities in Chromatography Resins Market
The Chromatography Resins Market is ripe with future opportunities. The burgeoning field of personalized medicine and the increasing development of cell and gene therapies are creating a demand for highly specialized and high-capacity purification resins, particularly in affinity chromatography. Expansion into emerging markets, such as Asia Pacific and Latin America, with their growing pharmaceutical and biotech industries, presents significant untapped potential. The development of more sustainable and environmentally friendly chromatography resins, using bio-based materials and efficient manufacturing processes, aligns with global sustainability initiatives and offers a competitive edge. Furthermore, the integration of artificial intelligence and machine learning in chromatography process optimization could lead to the development of "smart" resins and automated purification systems, revolutionizing drug manufacturing. The increasing focus on single-use chromatography systems also presents an opportunity for manufacturers to develop integrated resin and disposable column solutions.
Major Players in the Chromatography Resins Market Ecosystem
- Repligen Corporation
- General Electric
- Bio-Rad Laboratories Inc
- Merck KGaA
- Mitsubishi Chemical Corporation
- Dupont
- Perkinelmer Inc
- Pall Corporation
- Tosoh Bioscience LLC
- Purolite
- Agilient Technologies
- Avantor Inc
- Thermo Fisher Scientific
Key Developments in Chromatography Resins Market Industry
- 2021: Repligen Corporation acquired Pall Corporation's Chromatography and Filtration business, significantly strengthening its position in the bioprocessing market and expanding its portfolio of chromatography solutions. This strategic move aimed to enhance its offerings in downstream processing for biologics.
- 2022: Thermo Fisher Scientific launched a new line of chromatography resins designed for high-throughput biopharmaceutical purification. This development focused on improving efficiency and speed in the production of therapeutic proteins and antibodies, addressing the growing need for accelerated drug development timelines.
- Ongoing: Continuous development of novel resin chemistries for improved selectivity and capacity in areas like gene therapy and mRNA production.
- Ongoing: Increased focus on sustainable manufacturing processes and the development of bio-based chromatography materials.
Strategic Chromatography Resins Market Market Forecast
The Chromatography Resins Market is poised for substantial growth driven by an confluence of compelling factors. The escalating demand for biologics and complex therapeutics, coupled with continuous innovation in purification technologies, will serve as primary growth catalysts. Increased R&D spending in the pharmaceutical and biotechnology sectors globally, particularly in emerging economies, will further fuel market expansion. Strategic collaborations and mergers & acquisitions among key players are expected to consolidate market share and drive technological advancements. The market's future trajectory is also influenced by the growing adoption of chromatography in food safety testing and environmental monitoring, diversifying its application base. With an estimated market size of USD XXXX Million in 2025, the Chromatography Resins Market is projected to reach USD XXXX Million by 2033, exhibiting a healthy CAGR of XX% during the forecast period, highlighting significant market potential and sustained upward momentum.
Chromatography Resins Market Segmentation
-
1. Origin
-
1.1. Natural-based
- 1.1.1. Agarose
- 1.1.2. Dextran
-
1.2. Synthetic-based
- 1.2.1. Silica Gel
- 1.2.2. Aluminum Oxide
- 1.2.3. Polystyrene
- 1.2.4. Other Synthetic-based Resins
-
1.1. Natural-based
-
2. Technology
- 2.1. Ion Exchange Chromatography Resins
- 2.2. Affinity Chromatography Resins
- 2.3. Size Exclusion Chromatography Resins
- 2.4. Hydrophobic Interaction Chromatography Resins
- 2.5. Other Technologies
-
3. End-user Industry
-
3.1. Pharmaceuticals
- 3.1.1. Biotechnology
- 3.1.2. Drug Discovery
- 3.1.3. Drug Production
- 3.2. Water and Environmental Agencies
- 3.3. Food and Beverages
- 3.4. Other End-user Industries
-
3.1. Pharmaceuticals
Chromatography Resins Market Segmentation By Geography
-
1. Asia Pacific
- 1.1. China
- 1.2. India
- 1.3. Japan
- 1.4. Rest of Asia Pacific
-
2. North America
- 2.1. United States
- 2.2. Canada
- 2.3. Mexico
-
3. Europe
- 3.1. Germany
- 3.2. United Kingdom
- 3.3. Italy
- 3.4. France
- 3.5. Switzerland
- 3.6. Rest of Europe
-
4. Rest of the World
- 4.1. South America
- 4.2. Middle East and Africa
Chromatography Resins Market Regional Market Share
Geographic Coverage of Chromatography Resins Market
Chromatography Resins Market REPORT HIGHLIGHTS
| Aspects | Details |
|---|---|
| Study Period | 2020-2034 |
| Base Year | 2025 |
| Estimated Year | 2026 |
| Forecast Period | 2026-2034 |
| Historical Period | 2020-2025 |
| Growth Rate | CAGR of > 7.00% from 2020-2034 |
| Segmentation |
|
Table of Contents
- 1. Introduction
- 1.1. Research Scope
- 1.2. Market Segmentation
- 1.3. Research Objective
- 1.4. Definitions and Assumptions
- 2. Executive Summary
- 2.1. Market Snapshot
- 3. Market Dynamics
- 3.1. Market Drivers
- 3.2. Market Restrains
- 3.3. Market Trends
- 3.4. Market Opportunities
- 4. Market Factor Analysis
- 4.1. Porters Five Forces
- 4.1.1. Bargaining Power of Suppliers
- 4.1.2. Bargaining Power of Buyers
- 4.1.3. Threat of New Entrants
- 4.1.4. Threat of Substitutes
- 4.1.5. Competitive Rivalry
- 4.2. PESTEL analysis
- 4.3. BCG Analysis
- 4.3.1. Stars (High Growth, High Market Share)
- 4.3.2. Cash Cows (Low Growth, High Market Share)
- 4.3.3. Question Mark (High Growth, Low Market Share)
- 4.3.4. Dogs (Low Growth, Low Market Share)
- 4.4. Ansoff Matrix Analysis
- 4.5. Supply Chain Analysis
- 4.6. Regulatory Landscape
- 4.7. Current Market Potential and Opportunity Assessment (TAM–SAM–SOM Framework)
- 4.8. DMV Analyst Note
- 4.1. Porters Five Forces
- 5. Market Analysis, Insights and Forecast 2021-2033
- 5.1. Market Analysis, Insights and Forecast - by Origin
- 5.1.1. Natural-based
- 5.1.1.1. Agarose
- 5.1.1.2. Dextran
- 5.1.2. Synthetic-based
- 5.1.2.1. Silica Gel
- 5.1.2.2. Aluminum Oxide
- 5.1.2.3. Polystyrene
- 5.1.2.4. Other Synthetic-based Resins
- 5.1.1. Natural-based
- 5.2. Market Analysis, Insights and Forecast - by Technology
- 5.2.1. Ion Exchange Chromatography Resins
- 5.2.2. Affinity Chromatography Resins
- 5.2.3. Size Exclusion Chromatography Resins
- 5.2.4. Hydrophobic Interaction Chromatography Resins
- 5.2.5. Other Technologies
- 5.3. Market Analysis, Insights and Forecast - by End-user Industry
- 5.3.1. Pharmaceuticals
- 5.3.1.1. Biotechnology
- 5.3.1.2. Drug Discovery
- 5.3.1.3. Drug Production
- 5.3.2. Water and Environmental Agencies
- 5.3.3. Food and Beverages
- 5.3.4. Other End-user Industries
- 5.3.1. Pharmaceuticals
- 5.4. Market Analysis, Insights and Forecast - by Region
- 5.4.1. Asia Pacific
- 5.4.2. North America
- 5.4.3. Europe
- 5.4.4. Rest of the World
- 5.1. Market Analysis, Insights and Forecast - by Origin
- 6. Global Chromatography Resins Market Analysis, Insights and Forecast, 2021-2033
- 6.1. Market Analysis, Insights and Forecast - by Origin
- 6.1.1. Natural-based
- 6.1.1.1. Agarose
- 6.1.1.2. Dextran
- 6.1.2. Synthetic-based
- 6.1.2.1. Silica Gel
- 6.1.2.2. Aluminum Oxide
- 6.1.2.3. Polystyrene
- 6.1.2.4. Other Synthetic-based Resins
- 6.1.1. Natural-based
- 6.2. Market Analysis, Insights and Forecast - by Technology
- 6.2.1. Ion Exchange Chromatography Resins
- 6.2.2. Affinity Chromatography Resins
- 6.2.3. Size Exclusion Chromatography Resins
- 6.2.4. Hydrophobic Interaction Chromatography Resins
- 6.2.5. Other Technologies
- 6.3. Market Analysis, Insights and Forecast - by End-user Industry
- 6.3.1. Pharmaceuticals
- 6.3.1.1. Biotechnology
- 6.3.1.2. Drug Discovery
- 6.3.1.3. Drug Production
- 6.3.2. Water and Environmental Agencies
- 6.3.3. Food and Beverages
- 6.3.4. Other End-user Industries
- 6.3.1. Pharmaceuticals
- 6.1. Market Analysis, Insights and Forecast - by Origin
- 7. Asia Pacific Chromatography Resins Market Analysis, Insights and Forecast, 2020-2032
- 7.1. Market Analysis, Insights and Forecast - by Origin
- 7.1.1. Natural-based
- 7.1.1.1. Agarose
- 7.1.1.2. Dextran
- 7.1.2. Synthetic-based
- 7.1.2.1. Silica Gel
- 7.1.2.2. Aluminum Oxide
- 7.1.2.3. Polystyrene
- 7.1.2.4. Other Synthetic-based Resins
- 7.1.1. Natural-based
- 7.2. Market Analysis, Insights and Forecast - by Technology
- 7.2.1. Ion Exchange Chromatography Resins
- 7.2.2. Affinity Chromatography Resins
- 7.2.3. Size Exclusion Chromatography Resins
- 7.2.4. Hydrophobic Interaction Chromatography Resins
- 7.2.5. Other Technologies
- 7.3. Market Analysis, Insights and Forecast - by End-user Industry
- 7.3.1. Pharmaceuticals
- 7.3.1.1. Biotechnology
- 7.3.1.2. Drug Discovery
- 7.3.1.3. Drug Production
- 7.3.2. Water and Environmental Agencies
- 7.3.3. Food and Beverages
- 7.3.4. Other End-user Industries
- 7.3.1. Pharmaceuticals
- 7.1. Market Analysis, Insights and Forecast - by Origin
- 8. North America Chromatography Resins Market Analysis, Insights and Forecast, 2020-2032
- 8.1. Market Analysis, Insights and Forecast - by Origin
- 8.1.1. Natural-based
- 8.1.1.1. Agarose
- 8.1.1.2. Dextran
- 8.1.2. Synthetic-based
- 8.1.2.1. Silica Gel
- 8.1.2.2. Aluminum Oxide
- 8.1.2.3. Polystyrene
- 8.1.2.4. Other Synthetic-based Resins
- 8.1.1. Natural-based
- 8.2. Market Analysis, Insights and Forecast - by Technology
- 8.2.1. Ion Exchange Chromatography Resins
- 8.2.2. Affinity Chromatography Resins
- 8.2.3. Size Exclusion Chromatography Resins
- 8.2.4. Hydrophobic Interaction Chromatography Resins
- 8.2.5. Other Technologies
- 8.3. Market Analysis, Insights and Forecast - by End-user Industry
- 8.3.1. Pharmaceuticals
- 8.3.1.1. Biotechnology
- 8.3.1.2. Drug Discovery
- 8.3.1.3. Drug Production
- 8.3.2. Water and Environmental Agencies
- 8.3.3. Food and Beverages
- 8.3.4. Other End-user Industries
- 8.3.1. Pharmaceuticals
- 8.1. Market Analysis, Insights and Forecast - by Origin
- 9. Europe Chromatography Resins Market Analysis, Insights and Forecast, 2020-2032
- 9.1. Market Analysis, Insights and Forecast - by Origin
- 9.1.1. Natural-based
- 9.1.1.1. Agarose
- 9.1.1.2. Dextran
- 9.1.2. Synthetic-based
- 9.1.2.1. Silica Gel
- 9.1.2.2. Aluminum Oxide
- 9.1.2.3. Polystyrene
- 9.1.2.4. Other Synthetic-based Resins
- 9.1.1. Natural-based
- 9.2. Market Analysis, Insights and Forecast - by Technology
- 9.2.1. Ion Exchange Chromatography Resins
- 9.2.2. Affinity Chromatography Resins
- 9.2.3. Size Exclusion Chromatography Resins
- 9.2.4. Hydrophobic Interaction Chromatography Resins
- 9.2.5. Other Technologies
- 9.3. Market Analysis, Insights and Forecast - by End-user Industry
- 9.3.1. Pharmaceuticals
- 9.3.1.1. Biotechnology
- 9.3.1.2. Drug Discovery
- 9.3.1.3. Drug Production
- 9.3.2. Water and Environmental Agencies
- 9.3.3. Food and Beverages
- 9.3.4. Other End-user Industries
- 9.3.1. Pharmaceuticals
- 9.1. Market Analysis, Insights and Forecast - by Origin
- 10. Rest of the World Chromatography Resins Market Analysis, Insights and Forecast, 2020-2032
- 10.1. Market Analysis, Insights and Forecast - by Origin
- 10.1.1. Natural-based
- 10.1.1.1. Agarose
- 10.1.1.2. Dextran
- 10.1.2. Synthetic-based
- 10.1.2.1. Silica Gel
- 10.1.2.2. Aluminum Oxide
- 10.1.2.3. Polystyrene
- 10.1.2.4. Other Synthetic-based Resins
- 10.1.1. Natural-based
- 10.2. Market Analysis, Insights and Forecast - by Technology
- 10.2.1. Ion Exchange Chromatography Resins
- 10.2.2. Affinity Chromatography Resins
- 10.2.3. Size Exclusion Chromatography Resins
- 10.2.4. Hydrophobic Interaction Chromatography Resins
- 10.2.5. Other Technologies
- 10.3. Market Analysis, Insights and Forecast - by End-user Industry
- 10.3.1. Pharmaceuticals
- 10.3.1.1. Biotechnology
- 10.3.1.2. Drug Discovery
- 10.3.1.3. Drug Production
- 10.3.2. Water and Environmental Agencies
- 10.3.3. Food and Beverages
- 10.3.4. Other End-user Industries
- 10.3.1. Pharmaceuticals
- 10.1. Market Analysis, Insights and Forecast - by Origin
- 11. Competitive Analysis
- 11.1. Company Profiles
- 11.1.1 Repligen Corporation
- 11.1.1.1. Company Overview
- 11.1.1.2. Products
- 11.1.1.3. Company Financials
- 11.1.1.4. SWOT Analysis
- 11.1.2 General Electric
- 11.1.2.1. Company Overview
- 11.1.2.2. Products
- 11.1.2.3. Company Financials
- 11.1.2.4. SWOT Analysis
- 11.1.3 Bio-Rad Laboratories Inc
- 11.1.3.1. Company Overview
- 11.1.3.2. Products
- 11.1.3.3. Company Financials
- 11.1.3.4. SWOT Analysis
- 11.1.4 Merck KGaA
- 11.1.4.1. Company Overview
- 11.1.4.2. Products
- 11.1.4.3. Company Financials
- 11.1.4.4. SWOT Analysis
- 11.1.5 Mitsubishi Chemical Corporation
- 11.1.5.1. Company Overview
- 11.1.5.2. Products
- 11.1.5.3. Company Financials
- 11.1.5.4. SWOT Analysis
- 11.1.6 Dupont
- 11.1.6.1. Company Overview
- 11.1.6.2. Products
- 11.1.6.3. Company Financials
- 11.1.6.4. SWOT Analysis
- 11.1.7 Perkinelmer Inc
- 11.1.7.1. Company Overview
- 11.1.7.2. Products
- 11.1.7.3. Company Financials
- 11.1.7.4. SWOT Analysis
- 11.1.8 Pall Corporation
- 11.1.8.1. Company Overview
- 11.1.8.2. Products
- 11.1.8.3. Company Financials
- 11.1.8.4. SWOT Analysis
- 11.1.9 Tosoh Bioscience LLC*List Not Exhaustive
- 11.1.9.1. Company Overview
- 11.1.9.2. Products
- 11.1.9.3. Company Financials
- 11.1.9.4. SWOT Analysis
- 11.1.10 Purolite
- 11.1.10.1. Company Overview
- 11.1.10.2. Products
- 11.1.10.3. Company Financials
- 11.1.10.4. SWOT Analysis
- 11.1.11 Agilient Technologies
- 11.1.11.1. Company Overview
- 11.1.11.2. Products
- 11.1.11.3. Company Financials
- 11.1.11.4. SWOT Analysis
- 11.1.12 Avantor Inc
- 11.1.12.1. Company Overview
- 11.1.12.2. Products
- 11.1.12.3. Company Financials
- 11.1.12.4. SWOT Analysis
- 11.1.13 Thermo Fisher Scientific
- 11.1.13.1. Company Overview
- 11.1.13.2. Products
- 11.1.13.3. Company Financials
- 11.1.13.4. SWOT Analysis
- 11.1.1 Repligen Corporation
- 11.2. Market Entropy
- 11.2.1 Company's Key Areas Served
- 11.2.2 Recent Developments
- 11.3. Company Market Share Analysis 2025
- 11.3.1 Top 5 Companies Market Share Analysis
- 11.3.2 Top 3 Companies Market Share Analysis
- 11.4. List of Potential Customers
- 12. Research Methodology
List of Figures
- Figure 1: Global Chromatography Resins Market Revenue Breakdown (Million, %) by Region 2025 & 2033
- Figure 2: Global Chromatography Resins Market Volume Breakdown (K Tons, %) by Region 2025 & 2033
- Figure 3: Asia Pacific Chromatography Resins Market Revenue (Million), by Origin 2025 & 2033
- Figure 4: Asia Pacific Chromatography Resins Market Volume (K Tons), by Origin 2025 & 2033
- Figure 5: Asia Pacific Chromatography Resins Market Revenue Share (%), by Origin 2025 & 2033
- Figure 6: Asia Pacific Chromatography Resins Market Volume Share (%), by Origin 2025 & 2033
- Figure 7: Asia Pacific Chromatography Resins Market Revenue (Million), by Technology 2025 & 2033
- Figure 8: Asia Pacific Chromatography Resins Market Volume (K Tons), by Technology 2025 & 2033
- Figure 9: Asia Pacific Chromatography Resins Market Revenue Share (%), by Technology 2025 & 2033
- Figure 10: Asia Pacific Chromatography Resins Market Volume Share (%), by Technology 2025 & 2033
- Figure 11: Asia Pacific Chromatography Resins Market Revenue (Million), by End-user Industry 2025 & 2033
- Figure 12: Asia Pacific Chromatography Resins Market Volume (K Tons), by End-user Industry 2025 & 2033
- Figure 13: Asia Pacific Chromatography Resins Market Revenue Share (%), by End-user Industry 2025 & 2033
- Figure 14: Asia Pacific Chromatography Resins Market Volume Share (%), by End-user Industry 2025 & 2033
- Figure 15: Asia Pacific Chromatography Resins Market Revenue (Million), by Country 2025 & 2033
- Figure 16: Asia Pacific Chromatography Resins Market Volume (K Tons), by Country 2025 & 2033
- Figure 17: Asia Pacific Chromatography Resins Market Revenue Share (%), by Country 2025 & 2033
- Figure 18: Asia Pacific Chromatography Resins Market Volume Share (%), by Country 2025 & 2033
- Figure 19: North America Chromatography Resins Market Revenue (Million), by Origin 2025 & 2033
- Figure 20: North America Chromatography Resins Market Volume (K Tons), by Origin 2025 & 2033
- Figure 21: North America Chromatography Resins Market Revenue Share (%), by Origin 2025 & 2033
- Figure 22: North America Chromatography Resins Market Volume Share (%), by Origin 2025 & 2033
- Figure 23: North America Chromatography Resins Market Revenue (Million), by Technology 2025 & 2033
- Figure 24: North America Chromatography Resins Market Volume (K Tons), by Technology 2025 & 2033
- Figure 25: North America Chromatography Resins Market Revenue Share (%), by Technology 2025 & 2033
- Figure 26: North America Chromatography Resins Market Volume Share (%), by Technology 2025 & 2033
- Figure 27: North America Chromatography Resins Market Revenue (Million), by End-user Industry 2025 & 2033
- Figure 28: North America Chromatography Resins Market Volume (K Tons), by End-user Industry 2025 & 2033
- Figure 29: North America Chromatography Resins Market Revenue Share (%), by End-user Industry 2025 & 2033
- Figure 30: North America Chromatography Resins Market Volume Share (%), by End-user Industry 2025 & 2033
- Figure 31: North America Chromatography Resins Market Revenue (Million), by Country 2025 & 2033
- Figure 32: North America Chromatography Resins Market Volume (K Tons), by Country 2025 & 2033
- Figure 33: North America Chromatography Resins Market Revenue Share (%), by Country 2025 & 2033
- Figure 34: North America Chromatography Resins Market Volume Share (%), by Country 2025 & 2033
- Figure 35: Europe Chromatography Resins Market Revenue (Million), by Origin 2025 & 2033
- Figure 36: Europe Chromatography Resins Market Volume (K Tons), by Origin 2025 & 2033
- Figure 37: Europe Chromatography Resins Market Revenue Share (%), by Origin 2025 & 2033
- Figure 38: Europe Chromatography Resins Market Volume Share (%), by Origin 2025 & 2033
- Figure 39: Europe Chromatography Resins Market Revenue (Million), by Technology 2025 & 2033
- Figure 40: Europe Chromatography Resins Market Volume (K Tons), by Technology 2025 & 2033
- Figure 41: Europe Chromatography Resins Market Revenue Share (%), by Technology 2025 & 2033
- Figure 42: Europe Chromatography Resins Market Volume Share (%), by Technology 2025 & 2033
- Figure 43: Europe Chromatography Resins Market Revenue (Million), by End-user Industry 2025 & 2033
- Figure 44: Europe Chromatography Resins Market Volume (K Tons), by End-user Industry 2025 & 2033
- Figure 45: Europe Chromatography Resins Market Revenue Share (%), by End-user Industry 2025 & 2033
- Figure 46: Europe Chromatography Resins Market Volume Share (%), by End-user Industry 2025 & 2033
- Figure 47: Europe Chromatography Resins Market Revenue (Million), by Country 2025 & 2033
- Figure 48: Europe Chromatography Resins Market Volume (K Tons), by Country 2025 & 2033
- Figure 49: Europe Chromatography Resins Market Revenue Share (%), by Country 2025 & 2033
- Figure 50: Europe Chromatography Resins Market Volume Share (%), by Country 2025 & 2033
- Figure 51: Rest of the World Chromatography Resins Market Revenue (Million), by Origin 2025 & 2033
- Figure 52: Rest of the World Chromatography Resins Market Volume (K Tons), by Origin 2025 & 2033
- Figure 53: Rest of the World Chromatography Resins Market Revenue Share (%), by Origin 2025 & 2033
- Figure 54: Rest of the World Chromatography Resins Market Volume Share (%), by Origin 2025 & 2033
- Figure 55: Rest of the World Chromatography Resins Market Revenue (Million), by Technology 2025 & 2033
- Figure 56: Rest of the World Chromatography Resins Market Volume (K Tons), by Technology 2025 & 2033
- Figure 57: Rest of the World Chromatography Resins Market Revenue Share (%), by Technology 2025 & 2033
- Figure 58: Rest of the World Chromatography Resins Market Volume Share (%), by Technology 2025 & 2033
- Figure 59: Rest of the World Chromatography Resins Market Revenue (Million), by End-user Industry 2025 & 2033
- Figure 60: Rest of the World Chromatography Resins Market Volume (K Tons), by End-user Industry 2025 & 2033
- Figure 61: Rest of the World Chromatography Resins Market Revenue Share (%), by End-user Industry 2025 & 2033
- Figure 62: Rest of the World Chromatography Resins Market Volume Share (%), by End-user Industry 2025 & 2033
- Figure 63: Rest of the World Chromatography Resins Market Revenue (Million), by Country 2025 & 2033
- Figure 64: Rest of the World Chromatography Resins Market Volume (K Tons), by Country 2025 & 2033
- Figure 65: Rest of the World Chromatography Resins Market Revenue Share (%), by Country 2025 & 2033
- Figure 66: Rest of the World Chromatography Resins Market Volume Share (%), by Country 2025 & 2033
List of Tables
- Table 1: Global Chromatography Resins Market Revenue Million Forecast, by Origin 2020 & 2033
- Table 2: Global Chromatography Resins Market Volume K Tons Forecast, by Origin 2020 & 2033
- Table 3: Global Chromatography Resins Market Revenue Million Forecast, by Technology 2020 & 2033
- Table 4: Global Chromatography Resins Market Volume K Tons Forecast, by Technology 2020 & 2033
- Table 5: Global Chromatography Resins Market Revenue Million Forecast, by End-user Industry 2020 & 2033
- Table 6: Global Chromatography Resins Market Volume K Tons Forecast, by End-user Industry 2020 & 2033
- Table 7: Global Chromatography Resins Market Revenue Million Forecast, by Region 2020 & 2033
- Table 8: Global Chromatography Resins Market Volume K Tons Forecast, by Region 2020 & 2033
- Table 9: Global Chromatography Resins Market Revenue Million Forecast, by Origin 2020 & 2033
- Table 10: Global Chromatography Resins Market Volume K Tons Forecast, by Origin 2020 & 2033
- Table 11: Global Chromatography Resins Market Revenue Million Forecast, by Technology 2020 & 2033
- Table 12: Global Chromatography Resins Market Volume K Tons Forecast, by Technology 2020 & 2033
- Table 13: Global Chromatography Resins Market Revenue Million Forecast, by End-user Industry 2020 & 2033
- Table 14: Global Chromatography Resins Market Volume K Tons Forecast, by End-user Industry 2020 & 2033
- Table 15: Global Chromatography Resins Market Revenue Million Forecast, by Country 2020 & 2033
- Table 16: Global Chromatography Resins Market Volume K Tons Forecast, by Country 2020 & 2033
- Table 17: China Chromatography Resins Market Revenue (Million) Forecast, by Application 2020 & 2033
- Table 18: China Chromatography Resins Market Volume (K Tons) Forecast, by Application 2020 & 2033
- Table 19: India Chromatography Resins Market Revenue (Million) Forecast, by Application 2020 & 2033
- Table 20: India Chromatography Resins Market Volume (K Tons) Forecast, by Application 2020 & 2033
- Table 21: Japan Chromatography Resins Market Revenue (Million) Forecast, by Application 2020 & 2033
- Table 22: Japan Chromatography Resins Market Volume (K Tons) Forecast, by Application 2020 & 2033
- Table 23: Rest of Asia Pacific Chromatography Resins Market Revenue (Million) Forecast, by Application 2020 & 2033
- Table 24: Rest of Asia Pacific Chromatography Resins Market Volume (K Tons) Forecast, by Application 2020 & 2033
- Table 25: Global Chromatography Resins Market Revenue Million Forecast, by Origin 2020 & 2033
- Table 26: Global Chromatography Resins Market Volume K Tons Forecast, by Origin 2020 & 2033
- Table 27: Global Chromatography Resins Market Revenue Million Forecast, by Technology 2020 & 2033
- Table 28: Global Chromatography Resins Market Volume K Tons Forecast, by Technology 2020 & 2033
- Table 29: Global Chromatography Resins Market Revenue Million Forecast, by End-user Industry 2020 & 2033
- Table 30: Global Chromatography Resins Market Volume K Tons Forecast, by End-user Industry 2020 & 2033
- Table 31: Global Chromatography Resins Market Revenue Million Forecast, by Country 2020 & 2033
- Table 32: Global Chromatography Resins Market Volume K Tons Forecast, by Country 2020 & 2033
- Table 33: United States Chromatography Resins Market Revenue (Million) Forecast, by Application 2020 & 2033
- Table 34: United States Chromatography Resins Market Volume (K Tons) Forecast, by Application 2020 & 2033
- Table 35: Canada Chromatography Resins Market Revenue (Million) Forecast, by Application 2020 & 2033
- Table 36: Canada Chromatography Resins Market Volume (K Tons) Forecast, by Application 2020 & 2033
- Table 37: Mexico Chromatography Resins Market Revenue (Million) Forecast, by Application 2020 & 2033
- Table 38: Mexico Chromatography Resins Market Volume (K Tons) Forecast, by Application 2020 & 2033
- Table 39: Global Chromatography Resins Market Revenue Million Forecast, by Origin 2020 & 2033
- Table 40: Global Chromatography Resins Market Volume K Tons Forecast, by Origin 2020 & 2033
- Table 41: Global Chromatography Resins Market Revenue Million Forecast, by Technology 2020 & 2033
- Table 42: Global Chromatography Resins Market Volume K Tons Forecast, by Technology 2020 & 2033
- Table 43: Global Chromatography Resins Market Revenue Million Forecast, by End-user Industry 2020 & 2033
- Table 44: Global Chromatography Resins Market Volume K Tons Forecast, by End-user Industry 2020 & 2033
- Table 45: Global Chromatography Resins Market Revenue Million Forecast, by Country 2020 & 2033
- Table 46: Global Chromatography Resins Market Volume K Tons Forecast, by Country 2020 & 2033
- Table 47: Germany Chromatography Resins Market Revenue (Million) Forecast, by Application 2020 & 2033
- Table 48: Germany Chromatography Resins Market Volume (K Tons) Forecast, by Application 2020 & 2033
- Table 49: United Kingdom Chromatography Resins Market Revenue (Million) Forecast, by Application 2020 & 2033
- Table 50: United Kingdom Chromatography Resins Market Volume (K Tons) Forecast, by Application 2020 & 2033
- Table 51: Italy Chromatography Resins Market Revenue (Million) Forecast, by Application 2020 & 2033
- Table 52: Italy Chromatography Resins Market Volume (K Tons) Forecast, by Application 2020 & 2033
- Table 53: France Chromatography Resins Market Revenue (Million) Forecast, by Application 2020 & 2033
- Table 54: France Chromatography Resins Market Volume (K Tons) Forecast, by Application 2020 & 2033
- Table 55: Switzerland Chromatography Resins Market Revenue (Million) Forecast, by Application 2020 & 2033
- Table 56: Switzerland Chromatography Resins Market Volume (K Tons) Forecast, by Application 2020 & 2033
- Table 57: Rest of Europe Chromatography Resins Market Revenue (Million) Forecast, by Application 2020 & 2033
- Table 58: Rest of Europe Chromatography Resins Market Volume (K Tons) Forecast, by Application 2020 & 2033
- Table 59: Global Chromatography Resins Market Revenue Million Forecast, by Origin 2020 & 2033
- Table 60: Global Chromatography Resins Market Volume K Tons Forecast, by Origin 2020 & 2033
- Table 61: Global Chromatography Resins Market Revenue Million Forecast, by Technology 2020 & 2033
- Table 62: Global Chromatography Resins Market Volume K Tons Forecast, by Technology 2020 & 2033
- Table 63: Global Chromatography Resins Market Revenue Million Forecast, by End-user Industry 2020 & 2033
- Table 64: Global Chromatography Resins Market Volume K Tons Forecast, by End-user Industry 2020 & 2033
- Table 65: Global Chromatography Resins Market Revenue Million Forecast, by Country 2020 & 2033
- Table 66: Global Chromatography Resins Market Volume K Tons Forecast, by Country 2020 & 2033
- Table 67: South America Chromatography Resins Market Revenue (Million) Forecast, by Application 2020 & 2033
- Table 68: South America Chromatography Resins Market Volume (K Tons) Forecast, by Application 2020 & 2033
- Table 69: Middle East and Africa Chromatography Resins Market Revenue (Million) Forecast, by Application 2020 & 2033
- Table 70: Middle East and Africa Chromatography Resins Market Volume (K Tons) Forecast, by Application 2020 & 2033
Frequently Asked Questions
1. What is the projected Compound Annual Growth Rate (CAGR) of the Chromatography Resins Market?
The projected CAGR is approximately > 7.00%.
2. Which companies are prominent players in the Chromatography Resins Market?
Key companies in the market include Repligen Corporation, General Electric, Bio-Rad Laboratories Inc, Merck KGaA, Mitsubishi Chemical Corporation, Dupont, Perkinelmer Inc, Pall Corporation, Tosoh Bioscience LLC*List Not Exhaustive, Purolite, Agilient Technologies, Avantor Inc, Thermo Fisher Scientific.
3. What are the main segments of the Chromatography Resins Market?
The market segments include Origin, Technology, End-user Industry.
4. Can you provide details about the market size?
The market size is estimated to be USD 2480 Million as of 2022.
5. What are some drivers contributing to market growth?
; Rising Demand from the Pharmaceutical Sector; Technological Advancements in Chromatography Resins; Increasing Importance of Chromatography Tests in Drug Approvals.
6. What are the notable trends driving market growth?
Increasing Demand from Pharmaceutical Sector.
7. Are there any restraints impacting market growth?
; Lack of Professional Expertise in the Emerging Countries; High Costs vs. Productivity of Chromatography Systems.
8. Can you provide examples of recent developments in the market?
In 2021, Repligen Corporation acquired Pall Corporation's Chromatography and Filtration business. In 2022, Thermo Fisher Scientific launched a new line of chromatography resins designed for high-throughput biopharmaceutical purification.
9. What pricing options are available for accessing the report?
Pricing options include single-user, multi-user, and enterprise licenses priced at USD 4750, USD 5250, and USD 8750 respectively.
10. Is the market size provided in terms of value or volume?
The market size is provided in terms of value, measured in Million and volume, measured in K Tons.
11. Are there any specific market keywords associated with the report?
Yes, the market keyword associated with the report is "Chromatography Resins Market," which aids in identifying and referencing the specific market segment covered.
12. How do I determine which pricing option suits my needs best?
The pricing options vary based on user requirements and access needs. Individual users may opt for single-user licenses, while businesses requiring broader access may choose multi-user or enterprise licenses for cost-effective access to the report.
13. Are there any additional resources or data provided in the Chromatography Resins Market report?
While the report offers comprehensive insights, it's advisable to review the specific contents or supplementary materials provided to ascertain if additional resources or data are available.
14. How can I stay updated on further developments or reports in the Chromatography Resins Market?
To stay informed about further developments, trends, and reports in the Chromatography Resins Market, consider subscribing to industry newsletters, following relevant companies and organizations, or regularly checking reputable industry news sources and publications.
Methodology
Step 1 - Identification of Relevant Samples Size from Population Database


Step 2 - Approaches for Defining Global Market Size (Value, Volume* & Price*)

Note*: In applicable scenarios
Step 3 - Data Sources
Primary Research
- Web Analytics
- Survey Reports
- Research Institute
- Latest Research Reports
- Opinion Leaders
Secondary Research
- Annual Reports
- White Paper
- Latest Press Release
- Industry Association
- Paid Database
- Investor Presentations

Step 4 - Data Triangulation
Involves using different sources of information in order to increase the validity of a study
These sources are likely to be stakeholders in a program - participants, other researchers, program staff, other community members, and so on.
Then we put all data in single framework & apply various statistical tools to find out the dynamic on the market.
During the analysis stage, feedback from the stakeholder groups would be compared to determine areas of agreement as well as areas of divergence