

Key Insights
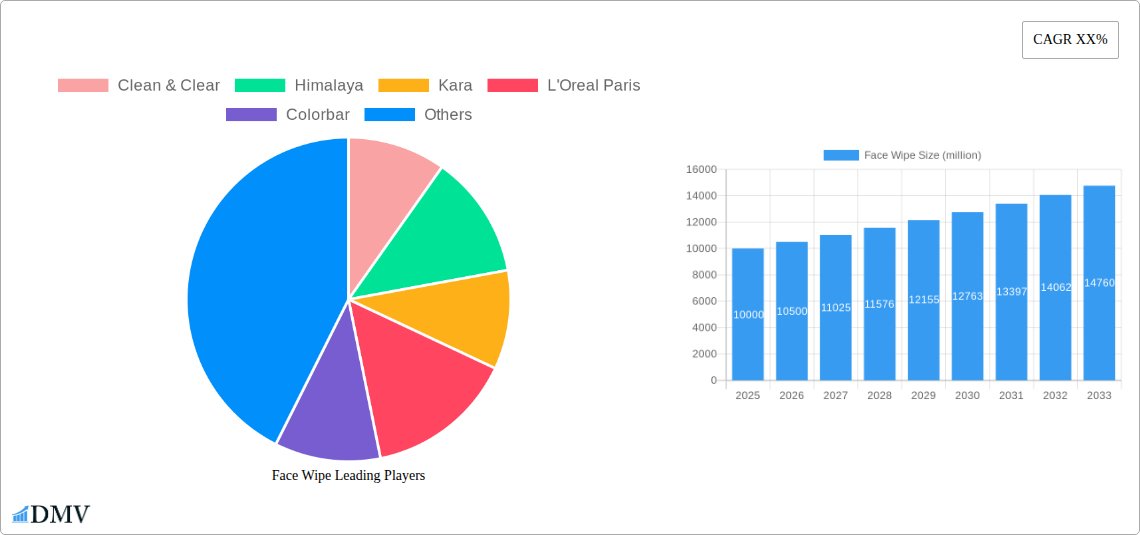
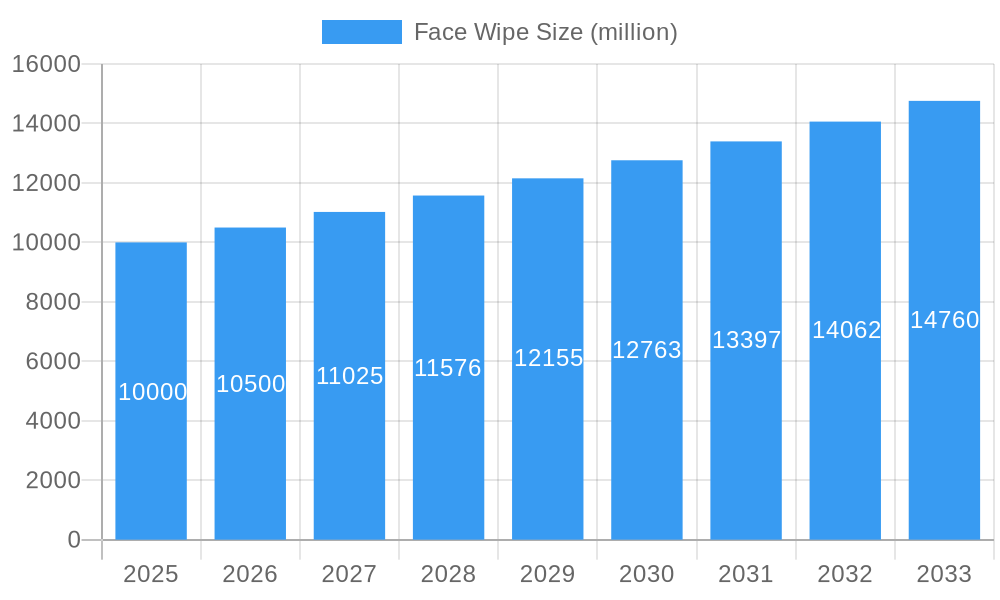
The global face wipe market is experiencing robust growth, driven by increasing consumer demand for convenient and effective skincare solutions. The rising popularity of on-the-go lifestyles and a growing awareness of hygiene contribute significantly to this upward trend. The market, estimated at $10 billion in 2025, is projected to experience a Compound Annual Growth Rate (CAGR) of 5% from 2025 to 2033, reaching an estimated value of approximately $14 billion by 2033. This growth is fueled by several factors including the introduction of innovative products with enhanced formulations focusing on natural ingredients and specific skin concerns like acne and dryness. Furthermore, the rise of e-commerce and increased marketing efforts by major players are boosting market penetration and reach.
Face Wipe Market Size (In Billion)
Key segments within the market include wipes for different skin types (oily, dry, sensitive), those incorporating specific functionalities (e.g., makeup removal, cleansing, toning), and varying price points catering to diverse consumer preferences. Major players like Clean & Clear, Himalaya, L'Oreal Paris, and Pond's are leveraging brand recognition and product diversification to maintain market share. However, increasing raw material costs and growing concerns about environmental impact due to single-use plastic packaging present challenges. The market is witnessing a shift towards sustainable packaging solutions, including biodegradable and reusable options, creating new opportunities for manufacturers committed to eco-friendly practices. Regional variations in market size reflect differing consumer preferences and purchasing power, with North America and Europe currently representing significant market segments.
Face Wipe Company Market Share
Face Wipe Market Report: A Comprehensive Analysis of a Multi-Million Dollar Industry (2019-2033)
This insightful report provides a comprehensive analysis of the global face wipe market, projecting a multi-million dollar valuation by 2033. The study meticulously examines market trends, competitive dynamics, and future growth potential, offering crucial insights for stakeholders across the value chain. Covering the period from 2019 to 2033, with 2025 as the base and estimated year, this report offers invaluable data for informed decision-making. The analysis includes detailed profiles of key players like Clean & Clear, Himalaya, L'Oréal Paris, and many more, illuminating their strategies and market positions within this burgeoning industry.
Face Wipe Market Composition & Trends
This section delves into the intricate structure of the face wipe market, analyzing market concentration, innovation, regulatory landscapes, and competitive activities. We explore the interplay of substitute products, end-user profiles, and mergers and acquisitions (M&A) impacting the market's evolution.
Market Concentration: The global face wipe market exhibits a moderately concentrated landscape, with the top 10 players holding an estimated xx% market share in 2025. This concentration is expected to shift slightly by 2033, with increased competition from emerging brands.
Innovation Catalysts: Advancements in materials science (e.g., biodegradable wipes), sustainable packaging, and enhanced formulations (e.g., inclusion of natural ingredients) are driving innovation.
Regulatory Landscape: Growing awareness of microplastic pollution and the environmental impact of wipes is leading to stricter regulations in various regions, influencing product development and packaging choices. This includes restrictions on certain ingredients and a push for sustainable alternatives.
Substitute Products: The market faces competition from alternative cleansing methods such as traditional cleansing products, reusable cloths, and cleansing balms. However, the convenience of face wipes maintains significant market demand.
End-User Profiles: The primary end-users are consumers aged 18-45, with significant demand across various demographics and genders. However, market penetration in mature demographics is also increasing.
M&A Activities: The past five years have witnessed several M&A activities in the face wipe industry, with total deal values exceeding $xx million in 2024. These activities primarily focused on expanding product portfolios and geographical reach. Significant acquisitions are expected to continue within the forecast period (2025-2033).
Face Wipe Industry Evolution
This section examines the face wipe market’s dynamic evolution, tracing its growth trajectory, technological progress, and shifting consumer preferences. We analyze growth rates, adoption rates, and market penetration. The historical period (2019-2024) showcased robust growth, with a Compound Annual Growth Rate (CAGR) of xx%. This growth is projected to continue, albeit at a slightly moderated pace, in the forecast period (2025-2033), reaching a CAGR of xx%. The growing awareness of personal hygiene and the rise of on-the-go lifestyles are driving sustained market growth. Technological advancements in materials science, including the development of sustainable and biodegradable wipes, are furthering market expansion. Changing consumer preferences toward natural and organic ingredients are influencing product formulations and packaging. Furthermore, increasing disposable incomes in emerging economies have expanded the market's addressable population.
Leading Regions, Countries, or Segments in Face Wipe
This section pinpoints the leading regions and segments within the global face wipe market. North America currently dominates the market, driven by high per capita consumption and established distribution networks.
Key Drivers for North American Dominance:
- High disposable income levels.
- Strong presence of major players.
- Well-developed retail infrastructure.
- High awareness of personal hygiene.
Regional Analysis: While North America leads, Asia-Pacific is showing strong growth potential due to its expanding population and rising disposable incomes. European markets, while mature, exhibit steady growth due to increasing demand for convenient and eco-friendly products.
The dominance of specific segments, such as wet wipes compared to dry wipes, will also be analyzed based on usage trends and preference shifts in consumer demographics.
Face Wipe Product Innovations
Recent product innovations focus on incorporating natural ingredients, sustainable materials (biodegradable fibers, recyclable packaging), and improved functionalities, such as enhanced cleansing capabilities and added skin benefits (e.g., moisturizing, anti-aging). These innovative products offer unique selling propositions that cater to growing consumer demand for sustainable and effective solutions. Furthermore, technological advances in manufacturing processes are improving wipe efficacy and reducing environmental impact.
Propelling Factors for Face Wipe Growth
Several factors are propelling the face wipe market’s growth. Firstly, the rising demand for convenient and effective personal hygiene solutions is a major driver, particularly among younger demographics. Secondly, increasing disposable incomes in developing economies are expanding the market’s addressable population. Thirdly, technological advancements in materials science and manufacturing have led to improved product efficacy and sustainability.
Obstacles in the Face Wipe Market
The face wipe market faces challenges like increasing environmental concerns regarding the disposal of non-biodegradable wipes, potentially leading to stricter regulations and higher manufacturing costs. Fluctuations in raw material prices and potential supply chain disruptions also pose challenges. Furthermore, intense competition from established and emerging players can impact market share and profitability for individual brands.
Future Opportunities in Face Wipe
Future opportunities lie in expanding into developing markets, focusing on sustainable and eco-friendly product offerings, and catering to evolving consumer preferences for specialized wipes (e.g., makeup removal wipes, sensitive skin wipes). The development of innovative materials and formulations will create new growth avenues.
Major Players in the Face Wipe Ecosystem
- Clean & Clear
- Himalaya
- Kara
- L'Oréal Paris
- Colorbar
- Lacto Calamine
- Kaya Youth
- Pond's
- Neutrogena
- P&G
- Johnson & Johnson
- Kimberly-Clark
- Nice-Pak Products
- Rockline Industries
- GS Converting
- Albaad Massuot
- Beiersdorf
- 3M
- Diamond Wipes International
- SCA
- Hengan Group
- Mandom Corporation
- DHC
- Shu Uemura
- MAC
- The Saem
- Kose
- Kao
Key Developments in Face Wipe Industry
- 2022 Q3: L'Oréal Paris launched a new line of biodegradable face wipes.
- 2023 Q1: Johnson & Johnson acquired a smaller competitor, expanding its market share. (Specific details like acquisition value are not provided).
- 2024 Q2: New regulations on microplastics in face wipes came into effect in the EU.
Further significant developments impacting the market and its key players, with dates and quantifiable impacts, will be detailed in the full report.
Strategic Face Wipe Market Forecast
The face wipe market is poised for continued growth, driven by increasing consumer demand for convenient hygiene solutions and the emergence of innovative, sustainable products. The forecast period (2025-2033) indicates a significant expansion, offering substantial opportunities for established players and new entrants alike. Continued innovation in materials and formulations, coupled with strategic market penetration in developing economies, will be key factors in shaping the future of this dynamic market.
Face Wipe Segmentation
-
1. Application
- 1.1. Online Sales
- 1.2. Offline Sales
-
2. Types
- 2.1. Cleansing Wipe
- 2.2. Makeup Remover Wipe
Face Wipe Segmentation By Geography
-
1. North America
- 1.1. United States
- 1.2. Canada
- 1.3. Mexico
-
2. South America
- 2.1. Brazil
- 2.2. Argentina
- 2.3. Rest of South America
-
3. Europe
- 3.1. United Kingdom
- 3.2. Germany
- 3.3. France
- 3.4. Italy
- 3.5. Spain
- 3.6. Russia
- 3.7. Benelux
- 3.8. Nordics
- 3.9. Rest of Europe
-
4. Middle East & Africa
- 4.1. Turkey
- 4.2. Israel
- 4.3. GCC
- 4.4. North Africa
- 4.5. South Africa
- 4.6. Rest of Middle East & Africa
-
5. Asia Pacific
- 5.1. China
- 5.2. India
- 5.3. Japan
- 5.4. South Korea
- 5.5. ASEAN
- 5.6. Oceania
- 5.7. Rest of Asia Pacific

Face Wipe Regional Market Share
Geographic Coverage of Face Wipe
Face Wipe REPORT HIGHLIGHTS
| Aspects | Details |
|---|---|
| Study Period | 2020-2034 |
| Base Year | 2025 |
| Estimated Year | 2026 |
| Forecast Period | 2026-2034 |
| Historical Period | 2020-2025 |
| Growth Rate | CAGR of XX% from 2020-2034 |
| Segmentation |
|
Table of Contents
- 1. Introduction
- 1.1. Research Scope
- 1.2. Market Segmentation
- 1.3. Research Methodology
- 1.4. Definitions and Assumptions
- 2. Executive Summary
- 2.1. Introduction
- 3. Market Dynamics
- 3.1. Introduction
- 3.2. Market Drivers
- 3.3. Market Restrains
- 3.4. Market Trends
- 4. Market Factor Analysis
- 4.1. Porters Five Forces
- 4.2. Supply/Value Chain
- 4.3. PESTEL analysis
- 4.4. Market Entropy
- 4.5. Patent/Trademark Analysis
- 5. Global Face Wipe Analysis, Insights and Forecast, 2020-2032
- 5.1. Market Analysis, Insights and Forecast - by Application
- 5.1.1. Online Sales
- 5.1.2. Offline Sales
- 5.2. Market Analysis, Insights and Forecast - by Types
- 5.2.1. Cleansing Wipe
- 5.2.2. Makeup Remover Wipe
- 5.3. Market Analysis, Insights and Forecast - by Region
- 5.3.1. North America
- 5.3.2. South America
- 5.3.3. Europe
- 5.3.4. Middle East & Africa
- 5.3.5. Asia Pacific
- 5.1. Market Analysis, Insights and Forecast - by Application
- 6. North America Face Wipe Analysis, Insights and Forecast, 2020-2032
- 6.1. Market Analysis, Insights and Forecast - by Application
- 6.1.1. Online Sales
- 6.1.2. Offline Sales
- 6.2. Market Analysis, Insights and Forecast - by Types
- 6.2.1. Cleansing Wipe
- 6.2.2. Makeup Remover Wipe
- 6.1. Market Analysis, Insights and Forecast - by Application
- 7. South America Face Wipe Analysis, Insights and Forecast, 2020-2032
- 7.1. Market Analysis, Insights and Forecast - by Application
- 7.1.1. Online Sales
- 7.1.2. Offline Sales
- 7.2. Market Analysis, Insights and Forecast - by Types
- 7.2.1. Cleansing Wipe
- 7.2.2. Makeup Remover Wipe
- 7.1. Market Analysis, Insights and Forecast - by Application
- 8. Europe Face Wipe Analysis, Insights and Forecast, 2020-2032
- 8.1. Market Analysis, Insights and Forecast - by Application
- 8.1.1. Online Sales
- 8.1.2. Offline Sales
- 8.2. Market Analysis, Insights and Forecast - by Types
- 8.2.1. Cleansing Wipe
- 8.2.2. Makeup Remover Wipe
- 8.1. Market Analysis, Insights and Forecast - by Application
- 9. Middle East & Africa Face Wipe Analysis, Insights and Forecast, 2020-2032
- 9.1. Market Analysis, Insights and Forecast - by Application
- 9.1.1. Online Sales
- 9.1.2. Offline Sales
- 9.2. Market Analysis, Insights and Forecast - by Types
- 9.2.1. Cleansing Wipe
- 9.2.2. Makeup Remover Wipe
- 9.1. Market Analysis, Insights and Forecast - by Application
- 10. Asia Pacific Face Wipe Analysis, Insights and Forecast, 2020-2032
- 10.1. Market Analysis, Insights and Forecast - by Application
- 10.1.1. Online Sales
- 10.1.2. Offline Sales
- 10.2. Market Analysis, Insights and Forecast - by Types
- 10.2.1. Cleansing Wipe
- 10.2.2. Makeup Remover Wipe
- 10.1. Market Analysis, Insights and Forecast - by Application
- 11. Competitive Analysis
- 11.1. Global Market Share Analysis 2025
- 11.2. Company Profiles
- 11.2.1 Clean & Clear
- 11.2.1.1. Overview
- 11.2.1.2. Products
- 11.2.1.3. SWOT Analysis
- 11.2.1.4. Recent Developments
- 11.2.1.5. Financials (Based on Availability)
- 11.2.2 Himalaya
- 11.2.2.1. Overview
- 11.2.2.2. Products
- 11.2.2.3. SWOT Analysis
- 11.2.2.4. Recent Developments
- 11.2.2.5. Financials (Based on Availability)
- 11.2.3 Kara
- 11.2.3.1. Overview
- 11.2.3.2. Products
- 11.2.3.3. SWOT Analysis
- 11.2.3.4. Recent Developments
- 11.2.3.5. Financials (Based on Availability)
- 11.2.4 L'Oreal Paris
- 11.2.4.1. Overview
- 11.2.4.2. Products
- 11.2.4.3. SWOT Analysis
- 11.2.4.4. Recent Developments
- 11.2.4.5. Financials (Based on Availability)
- 11.2.5 Colorbar
- 11.2.5.1. Overview
- 11.2.5.2. Products
- 11.2.5.3. SWOT Analysis
- 11.2.5.4. Recent Developments
- 11.2.5.5. Financials (Based on Availability)
- 11.2.6 Lacto Calamine
- 11.2.6.1. Overview
- 11.2.6.2. Products
- 11.2.6.3. SWOT Analysis
- 11.2.6.4. Recent Developments
- 11.2.6.5. Financials (Based on Availability)
- 11.2.7 Kaya Youth
- 11.2.7.1. Overview
- 11.2.7.2. Products
- 11.2.7.3. SWOT Analysis
- 11.2.7.4. Recent Developments
- 11.2.7.5. Financials (Based on Availability)
- 11.2.8 Pond's
- 11.2.8.1. Overview
- 11.2.8.2. Products
- 11.2.8.3. SWOT Analysis
- 11.2.8.4. Recent Developments
- 11.2.8.5. Financials (Based on Availability)
- 11.2.9 Neutrogena
- 11.2.9.1. Overview
- 11.2.9.2. Products
- 11.2.9.3. SWOT Analysis
- 11.2.9.4. Recent Developments
- 11.2.9.5. Financials (Based on Availability)
- 11.2.10 P&G
- 11.2.10.1. Overview
- 11.2.10.2. Products
- 11.2.10.3. SWOT Analysis
- 11.2.10.4. Recent Developments
- 11.2.10.5. Financials (Based on Availability)
- 11.2.11 Johnson & Johnson
- 11.2.11.1. Overview
- 11.2.11.2. Products
- 11.2.11.3. SWOT Analysis
- 11.2.11.4. Recent Developments
- 11.2.11.5. Financials (Based on Availability)
- 11.2.12 Kimberly-Clark
- 11.2.12.1. Overview
- 11.2.12.2. Products
- 11.2.12.3. SWOT Analysis
- 11.2.12.4. Recent Developments
- 11.2.12.5. Financials (Based on Availability)
- 11.2.13 Nice-Pak Products
- 11.2.13.1. Overview
- 11.2.13.2. Products
- 11.2.13.3. SWOT Analysis
- 11.2.13.4. Recent Developments
- 11.2.13.5. Financials (Based on Availability)
- 11.2.14 Rockline Industries
- 11.2.14.1. Overview
- 11.2.14.2. Products
- 11.2.14.3. SWOT Analysis
- 11.2.14.4. Recent Developments
- 11.2.14.5. Financials (Based on Availability)
- 11.2.15 GS Coverting
- 11.2.15.1. Overview
- 11.2.15.2. Products
- 11.2.15.3. SWOT Analysis
- 11.2.15.4. Recent Developments
- 11.2.15.5. Financials (Based on Availability)
- 11.2.16 Albaad Massuot
- 11.2.16.1. Overview
- 11.2.16.2. Products
- 11.2.16.3. SWOT Analysis
- 11.2.16.4. Recent Developments
- 11.2.16.5. Financials (Based on Availability)
- 11.2.17 Beiersdorf
- 11.2.17.1. Overview
- 11.2.17.2. Products
- 11.2.17.3. SWOT Analysis
- 11.2.17.4. Recent Developments
- 11.2.17.5. Financials (Based on Availability)
- 11.2.18 3M
- 11.2.18.1. Overview
- 11.2.18.2. Products
- 11.2.18.3. SWOT Analysis
- 11.2.18.4. Recent Developments
- 11.2.18.5. Financials (Based on Availability)
- 11.2.19 Diamond Wipes International
- 11.2.19.1. Overview
- 11.2.19.2. Products
- 11.2.19.3. SWOT Analysis
- 11.2.19.4. Recent Developments
- 11.2.19.5. Financials (Based on Availability)
- 11.2.20 SCA
- 11.2.20.1. Overview
- 11.2.20.2. Products
- 11.2.20.3. SWOT Analysis
- 11.2.20.4. Recent Developments
- 11.2.20.5. Financials (Based on Availability)
- 11.2.21 Hengan Group
- 11.2.21.1. Overview
- 11.2.21.2. Products
- 11.2.21.3. SWOT Analysis
- 11.2.21.4. Recent Developments
- 11.2.21.5. Financials (Based on Availability)
- 11.2.22 Mandom Corporation
- 11.2.22.1. Overview
- 11.2.22.2. Products
- 11.2.22.3. SWOT Analysis
- 11.2.22.4. Recent Developments
- 11.2.22.5. Financials (Based on Availability)
- 11.2.23 DHC
- 11.2.23.1. Overview
- 11.2.23.2. Products
- 11.2.23.3. SWOT Analysis
- 11.2.23.4. Recent Developments
- 11.2.23.5. Financials (Based on Availability)
- 11.2.24 Shu Uemura
- 11.2.24.1. Overview
- 11.2.24.2. Products
- 11.2.24.3. SWOT Analysis
- 11.2.24.4. Recent Developments
- 11.2.24.5. Financials (Based on Availability)
- 11.2.25 MAC
- 11.2.25.1. Overview
- 11.2.25.2. Products
- 11.2.25.3. SWOT Analysis
- 11.2.25.4. Recent Developments
- 11.2.25.5. Financials (Based on Availability)
- 11.2.26 The Saem
- 11.2.26.1. Overview
- 11.2.26.2. Products
- 11.2.26.3. SWOT Analysis
- 11.2.26.4. Recent Developments
- 11.2.26.5. Financials (Based on Availability)
- 11.2.27 Kose
- 11.2.27.1. Overview
- 11.2.27.2. Products
- 11.2.27.3. SWOT Analysis
- 11.2.27.4. Recent Developments
- 11.2.27.5. Financials (Based on Availability)
- 11.2.28 Kao
- 11.2.28.1. Overview
- 11.2.28.2. Products
- 11.2.28.3. SWOT Analysis
- 11.2.28.4. Recent Developments
- 11.2.28.5. Financials (Based on Availability)
- 11.2.1 Clean & Clear
List of Figures
- Figure 1: Global Face Wipe Revenue Breakdown (million, %) by Region 2025 & 2033
- Figure 2: Global Face Wipe Volume Breakdown (K, %) by Region 2025 & 2033
- Figure 3: North America Face Wipe Revenue (million), by Application 2025 & 2033
- Figure 4: North America Face Wipe Volume (K), by Application 2025 & 2033
- Figure 5: North America Face Wipe Revenue Share (%), by Application 2025 & 2033
- Figure 6: North America Face Wipe Volume Share (%), by Application 2025 & 2033
- Figure 7: North America Face Wipe Revenue (million), by Types 2025 & 2033
- Figure 8: North America Face Wipe Volume (K), by Types 2025 & 2033
- Figure 9: North America Face Wipe Revenue Share (%), by Types 2025 & 2033
- Figure 10: North America Face Wipe Volume Share (%), by Types 2025 & 2033
- Figure 11: North America Face Wipe Revenue (million), by Country 2025 & 2033
- Figure 12: North America Face Wipe Volume (K), by Country 2025 & 2033
- Figure 13: North America Face Wipe Revenue Share (%), by Country 2025 & 2033
- Figure 14: North America Face Wipe Volume Share (%), by Country 2025 & 2033
- Figure 15: South America Face Wipe Revenue (million), by Application 2025 & 2033
- Figure 16: South America Face Wipe Volume (K), by Application 2025 & 2033
- Figure 17: South America Face Wipe Revenue Share (%), by Application 2025 & 2033
- Figure 18: South America Face Wipe Volume Share (%), by Application 2025 & 2033
- Figure 19: South America Face Wipe Revenue (million), by Types 2025 & 2033
- Figure 20: South America Face Wipe Volume (K), by Types 2025 & 2033
- Figure 21: South America Face Wipe Revenue Share (%), by Types 2025 & 2033
- Figure 22: South America Face Wipe Volume Share (%), by Types 2025 & 2033
- Figure 23: South America Face Wipe Revenue (million), by Country 2025 & 2033
- Figure 24: South America Face Wipe Volume (K), by Country 2025 & 2033
- Figure 25: South America Face Wipe Revenue Share (%), by Country 2025 & 2033
- Figure 26: South America Face Wipe Volume Share (%), by Country 2025 & 2033
- Figure 27: Europe Face Wipe Revenue (million), by Application 2025 & 2033
- Figure 28: Europe Face Wipe Volume (K), by Application 2025 & 2033
- Figure 29: Europe Face Wipe Revenue Share (%), by Application 2025 & 2033
- Figure 30: Europe Face Wipe Volume Share (%), by Application 2025 & 2033
- Figure 31: Europe Face Wipe Revenue (million), by Types 2025 & 2033
- Figure 32: Europe Face Wipe Volume (K), by Types 2025 & 2033
- Figure 33: Europe Face Wipe Revenue Share (%), by Types 2025 & 2033
- Figure 34: Europe Face Wipe Volume Share (%), by Types 2025 & 2033
- Figure 35: Europe Face Wipe Revenue (million), by Country 2025 & 2033
- Figure 36: Europe Face Wipe Volume (K), by Country 2025 & 2033
- Figure 37: Europe Face Wipe Revenue Share (%), by Country 2025 & 2033
- Figure 38: Europe Face Wipe Volume Share (%), by Country 2025 & 2033
- Figure 39: Middle East & Africa Face Wipe Revenue (million), by Application 2025 & 2033
- Figure 40: Middle East & Africa Face Wipe Volume (K), by Application 2025 & 2033
- Figure 41: Middle East & Africa Face Wipe Revenue Share (%), by Application 2025 & 2033
- Figure 42: Middle East & Africa Face Wipe Volume Share (%), by Application 2025 & 2033
- Figure 43: Middle East & Africa Face Wipe Revenue (million), by Types 2025 & 2033
- Figure 44: Middle East & Africa Face Wipe Volume (K), by Types 2025 & 2033
- Figure 45: Middle East & Africa Face Wipe Revenue Share (%), by Types 2025 & 2033
- Figure 46: Middle East & Africa Face Wipe Volume Share (%), by Types 2025 & 2033
- Figure 47: Middle East & Africa Face Wipe Revenue (million), by Country 2025 & 2033
- Figure 48: Middle East & Africa Face Wipe Volume (K), by Country 2025 & 2033
- Figure 49: Middle East & Africa Face Wipe Revenue Share (%), by Country 2025 & 2033
- Figure 50: Middle East & Africa Face Wipe Volume Share (%), by Country 2025 & 2033
- Figure 51: Asia Pacific Face Wipe Revenue (million), by Application 2025 & 2033
- Figure 52: Asia Pacific Face Wipe Volume (K), by Application 2025 & 2033
- Figure 53: Asia Pacific Face Wipe Revenue Share (%), by Application 2025 & 2033
- Figure 54: Asia Pacific Face Wipe Volume Share (%), by Application 2025 & 2033
- Figure 55: Asia Pacific Face Wipe Revenue (million), by Types 2025 & 2033
- Figure 56: Asia Pacific Face Wipe Volume (K), by Types 2025 & 2033
- Figure 57: Asia Pacific Face Wipe Revenue Share (%), by Types 2025 & 2033
- Figure 58: Asia Pacific Face Wipe Volume Share (%), by Types 2025 & 2033
- Figure 59: Asia Pacific Face Wipe Revenue (million), by Country 2025 & 2033
- Figure 60: Asia Pacific Face Wipe Volume (K), by Country 2025 & 2033
- Figure 61: Asia Pacific Face Wipe Revenue Share (%), by Country 2025 & 2033
- Figure 62: Asia Pacific Face Wipe Volume Share (%), by Country 2025 & 2033
List of Tables
- Table 1: Global Face Wipe Revenue million Forecast, by Application 2020 & 2033
- Table 2: Global Face Wipe Volume K Forecast, by Application 2020 & 2033
- Table 3: Global Face Wipe Revenue million Forecast, by Types 2020 & 2033
- Table 4: Global Face Wipe Volume K Forecast, by Types 2020 & 2033
- Table 5: Global Face Wipe Revenue million Forecast, by Region 2020 & 2033
- Table 6: Global Face Wipe Volume K Forecast, by Region 2020 & 2033
- Table 7: Global Face Wipe Revenue million Forecast, by Application 2020 & 2033
- Table 8: Global Face Wipe Volume K Forecast, by Application 2020 & 2033
- Table 9: Global Face Wipe Revenue million Forecast, by Types 2020 & 2033
- Table 10: Global Face Wipe Volume K Forecast, by Types 2020 & 2033
- Table 11: Global Face Wipe Revenue million Forecast, by Country 2020 & 2033
- Table 12: Global Face Wipe Volume K Forecast, by Country 2020 & 2033
- Table 13: United States Face Wipe Revenue (million) Forecast, by Application 2020 & 2033
- Table 14: United States Face Wipe Volume (K) Forecast, by Application 2020 & 2033
- Table 15: Canada Face Wipe Revenue (million) Forecast, by Application 2020 & 2033
- Table 16: Canada Face Wipe Volume (K) Forecast, by Application 2020 & 2033
- Table 17: Mexico Face Wipe Revenue (million) Forecast, by Application 2020 & 2033
- Table 18: Mexico Face Wipe Volume (K) Forecast, by Application 2020 & 2033
- Table 19: Global Face Wipe Revenue million Forecast, by Application 2020 & 2033
- Table 20: Global Face Wipe Volume K Forecast, by Application 2020 & 2033
- Table 21: Global Face Wipe Revenue million Forecast, by Types 2020 & 2033
- Table 22: Global Face Wipe Volume K Forecast, by Types 2020 & 2033
- Table 23: Global Face Wipe Revenue million Forecast, by Country 2020 & 2033
- Table 24: Global Face Wipe Volume K Forecast, by Country 2020 & 2033
- Table 25: Brazil Face Wipe Revenue (million) Forecast, by Application 2020 & 2033
- Table 26: Brazil Face Wipe Volume (K) Forecast, by Application 2020 & 2033
- Table 27: Argentina Face Wipe Revenue (million) Forecast, by Application 2020 & 2033
- Table 28: Argentina Face Wipe Volume (K) Forecast, by Application 2020 & 2033
- Table 29: Rest of South America Face Wipe Revenue (million) Forecast, by Application 2020 & 2033
- Table 30: Rest of South America Face Wipe Volume (K) Forecast, by Application 2020 & 2033
- Table 31: Global Face Wipe Revenue million Forecast, by Application 2020 & 2033
- Table 32: Global Face Wipe Volume K Forecast, by Application 2020 & 2033
- Table 33: Global Face Wipe Revenue million Forecast, by Types 2020 & 2033
- Table 34: Global Face Wipe Volume K Forecast, by Types 2020 & 2033
- Table 35: Global Face Wipe Revenue million Forecast, by Country 2020 & 2033
- Table 36: Global Face Wipe Volume K Forecast, by Country 2020 & 2033
- Table 37: United Kingdom Face Wipe Revenue (million) Forecast, by Application 2020 & 2033
- Table 38: United Kingdom Face Wipe Volume (K) Forecast, by Application 2020 & 2033
- Table 39: Germany Face Wipe Revenue (million) Forecast, by Application 2020 & 2033
- Table 40: Germany Face Wipe Volume (K) Forecast, by Application 2020 & 2033
- Table 41: France Face Wipe Revenue (million) Forecast, by Application 2020 & 2033
- Table 42: France Face Wipe Volume (K) Forecast, by Application 2020 & 2033
- Table 43: Italy Face Wipe Revenue (million) Forecast, by Application 2020 & 2033
- Table 44: Italy Face Wipe Volume (K) Forecast, by Application 2020 & 2033
- Table 45: Spain Face Wipe Revenue (million) Forecast, by Application 2020 & 2033
- Table 46: Spain Face Wipe Volume (K) Forecast, by Application 2020 & 2033
- Table 47: Russia Face Wipe Revenue (million) Forecast, by Application 2020 & 2033
- Table 48: Russia Face Wipe Volume (K) Forecast, by Application 2020 & 2033
- Table 49: Benelux Face Wipe Revenue (million) Forecast, by Application 2020 & 2033
- Table 50: Benelux Face Wipe Volume (K) Forecast, by Application 2020 & 2033
- Table 51: Nordics Face Wipe Revenue (million) Forecast, by Application 2020 & 2033
- Table 52: Nordics Face Wipe Volume (K) Forecast, by Application 2020 & 2033
- Table 53: Rest of Europe Face Wipe Revenue (million) Forecast, by Application 2020 & 2033
- Table 54: Rest of Europe Face Wipe Volume (K) Forecast, by Application 2020 & 2033
- Table 55: Global Face Wipe Revenue million Forecast, by Application 2020 & 2033
- Table 56: Global Face Wipe Volume K Forecast, by Application 2020 & 2033
- Table 57: Global Face Wipe Revenue million Forecast, by Types 2020 & 2033
- Table 58: Global Face Wipe Volume K Forecast, by Types 2020 & 2033
- Table 59: Global Face Wipe Revenue million Forecast, by Country 2020 & 2033
- Table 60: Global Face Wipe Volume K Forecast, by Country 2020 & 2033
- Table 61: Turkey Face Wipe Revenue (million) Forecast, by Application 2020 & 2033
- Table 62: Turkey Face Wipe Volume (K) Forecast, by Application 2020 & 2033
- Table 63: Israel Face Wipe Revenue (million) Forecast, by Application 2020 & 2033
- Table 64: Israel Face Wipe Volume (K) Forecast, by Application 2020 & 2033
- Table 65: GCC Face Wipe Revenue (million) Forecast, by Application 2020 & 2033
- Table 66: GCC Face Wipe Volume (K) Forecast, by Application 2020 & 2033
- Table 67: North Africa Face Wipe Revenue (million) Forecast, by Application 2020 & 2033
- Table 68: North Africa Face Wipe Volume (K) Forecast, by Application 2020 & 2033
- Table 69: South Africa Face Wipe Revenue (million) Forecast, by Application 2020 & 2033
- Table 70: South Africa Face Wipe Volume (K) Forecast, by Application 2020 & 2033
- Table 71: Rest of Middle East & Africa Face Wipe Revenue (million) Forecast, by Application 2020 & 2033
- Table 72: Rest of Middle East & Africa Face Wipe Volume (K) Forecast, by Application 2020 & 2033
- Table 73: Global Face Wipe Revenue million Forecast, by Application 2020 & 2033
- Table 74: Global Face Wipe Volume K Forecast, by Application 2020 & 2033
- Table 75: Global Face Wipe Revenue million Forecast, by Types 2020 & 2033
- Table 76: Global Face Wipe Volume K Forecast, by Types 2020 & 2033
- Table 77: Global Face Wipe Revenue million Forecast, by Country 2020 & 2033
- Table 78: Global Face Wipe Volume K Forecast, by Country 2020 & 2033
- Table 79: China Face Wipe Revenue (million) Forecast, by Application 2020 & 2033
- Table 80: China Face Wipe Volume (K) Forecast, by Application 2020 & 2033
- Table 81: India Face Wipe Revenue (million) Forecast, by Application 2020 & 2033
- Table 82: India Face Wipe Volume (K) Forecast, by Application 2020 & 2033
- Table 83: Japan Face Wipe Revenue (million) Forecast, by Application 2020 & 2033
- Table 84: Japan Face Wipe Volume (K) Forecast, by Application 2020 & 2033
- Table 85: South Korea Face Wipe Revenue (million) Forecast, by Application 2020 & 2033
- Table 86: South Korea Face Wipe Volume (K) Forecast, by Application 2020 & 2033
- Table 87: ASEAN Face Wipe Revenue (million) Forecast, by Application 2020 & 2033
- Table 88: ASEAN Face Wipe Volume (K) Forecast, by Application 2020 & 2033
- Table 89: Oceania Face Wipe Revenue (million) Forecast, by Application 2020 & 2033
- Table 90: Oceania Face Wipe Volume (K) Forecast, by Application 2020 & 2033
- Table 91: Rest of Asia Pacific Face Wipe Revenue (million) Forecast, by Application 2020 & 2033
- Table 92: Rest of Asia Pacific Face Wipe Volume (K) Forecast, by Application 2020 & 2033
Frequently Asked Questions
1. What is the projected Compound Annual Growth Rate (CAGR) of the Face Wipe?
The projected CAGR is approximately XX%.
2. Which companies are prominent players in the Face Wipe?
Key companies in the market include Clean & Clear, Himalaya, Kara, L'Oreal Paris, Colorbar, Lacto Calamine, Kaya Youth, Pond's, Neutrogena, P&G, Johnson & Johnson, Kimberly-Clark, Nice-Pak Products, Rockline Industries, GS Coverting, Albaad Massuot, Beiersdorf, 3M, Diamond Wipes International, SCA, Hengan Group, Mandom Corporation, DHC, Shu Uemura, MAC, The Saem, Kose, Kao.
3. What are the main segments of the Face Wipe?
The market segments include Application, Types.
4. Can you provide details about the market size?
The market size is estimated to be USD XXX million as of 2022.
5. What are some drivers contributing to market growth?
N/A
6. What are the notable trends driving market growth?
N/A
7. Are there any restraints impacting market growth?
N/A
8. Can you provide examples of recent developments in the market?
N/A
9. What pricing options are available for accessing the report?
Pricing options include single-user, multi-user, and enterprise licenses priced at USD 3350.00, USD 5025.00, and USD 6700.00 respectively.
10. Is the market size provided in terms of value or volume?
The market size is provided in terms of value, measured in million and volume, measured in K.
11. Are there any specific market keywords associated with the report?
Yes, the market keyword associated with the report is "Face Wipe," which aids in identifying and referencing the specific market segment covered.
12. How do I determine which pricing option suits my needs best?
The pricing options vary based on user requirements and access needs. Individual users may opt for single-user licenses, while businesses requiring broader access may choose multi-user or enterprise licenses for cost-effective access to the report.
13. Are there any additional resources or data provided in the Face Wipe report?
While the report offers comprehensive insights, it's advisable to review the specific contents or supplementary materials provided to ascertain if additional resources or data are available.
14. How can I stay updated on further developments or reports in the Face Wipe?
To stay informed about further developments, trends, and reports in the Face Wipe, consider subscribing to industry newsletters, following relevant companies and organizations, or regularly checking reputable industry news sources and publications.
Methodology
Step 1 - Identification of Relevant Samples Size from Population Database


Step 2 - Approaches for Defining Global Market Size (Value, Volume* & Price*)

Note*: In applicable scenarios
Step 3 - Data Sources
Primary Research
- Web Analytics
- Survey Reports
- Research Institute
- Latest Research Reports
- Opinion Leaders
Secondary Research
- Annual Reports
- White Paper
- Latest Press Release
- Industry Association
- Paid Database
- Investor Presentations

Step 4 - Data Triangulation
Involves using different sources of information in order to increase the validity of a study
These sources are likely to be stakeholders in a program - participants, other researchers, program staff, other community members, and so on.
Then we put all data in single framework & apply various statistical tools to find out the dynamic on the market.
During the analysis stage, feedback from the stakeholder groups would be compared to determine areas of agreement as well as areas of divergence