

Key Insights
The Erythropoietin Stimulating Agents (ESA) market, projected at $10.55 billion in 2025, is set for substantial growth, forecasting a Compound Annual Growth Rate (CAGR) of 12.06% between 2025 and 2033. This upward trajectory is primarily driven by the increasing incidence of chronic kidney disease (CKD), a primary application for ESAs, alongside the rising prevalence of cancer and expanded use in managing anemia linked to anti-retroviral therapies. Innovations in ESA formulations enhancing efficacy and safety also contribute significantly. However, concerns regarding potential adverse events, including thrombosis and cardiovascular risks, may temper expansion. The market is segmented by product type (Epoetin Alfa, Epoetin Beta, Darbepoetin Alfa, others) and application (cancer, renal disorders, anti-retroviral treatment, neural diseases, others). North America currently leads, attributed to high healthcare spending and disease prevalence. Conversely, the Asia Pacific region is poised for significant growth, propelled by rising incomes, enhanced healthcare awareness, and improved access to advanced medical technologies. The competitive landscape features key pharmaceutical players like Amgen, Johnson & Johnson, and Roche, focused on developing and marketing innovative ESA solutions.
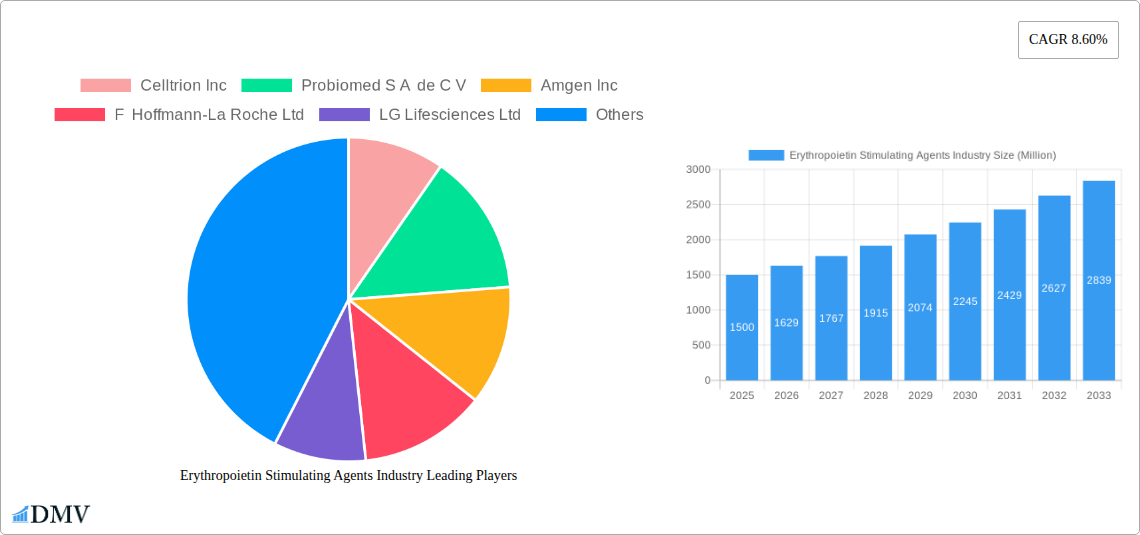
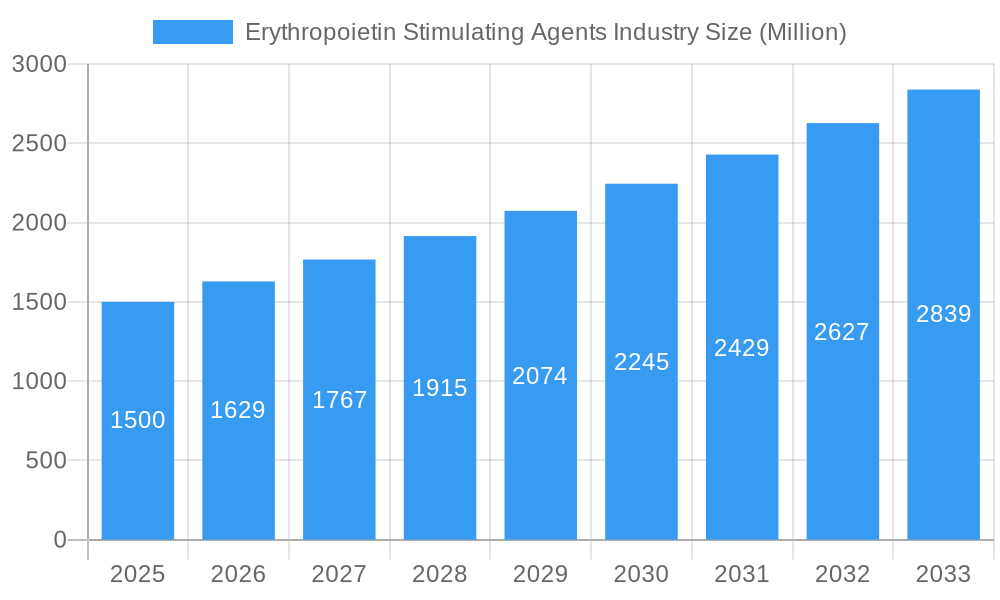
Erythropoietin Stimulating Agents Industry Market Size (In Billion)
Leading market participants are increasingly prioritizing the development of biosimilars and novel ESA formulations to address cost pressures and improve safety. The adoption of personalized medicine, customizing ESA therapy based on individual patient needs, is also growing. Regulatory approvals and pricing strategies will continue to shape market access and growth across regions. Healthcare systems' focus on cost containment will drive demand for value-based pricing and outcomes-based reimbursement. Future growth will depend on mitigating safety concerns, improving patient education, and ensuring sustainable access to ESA therapies. Granular market analysis by specific cancer or renal disease types, alongside detailed regional assessments, is crucial for identifying growth opportunities and refining targeted marketing strategies.
Erythropoietin Stimulating Agents Industry Company Market Share
Erythropoietin Stimulating Agents (ESA) Industry: A Comprehensive Market Report (2019-2033)
This insightful report provides a detailed analysis of the Erythropoietin Stimulating Agents (ESA) industry, offering a comprehensive overview of market trends, competitive dynamics, and future growth prospects. The study covers the period from 2019 to 2033, with a focus on the estimated year 2025 and a forecast period spanning 2025-2033. The report is crucial for stakeholders including manufacturers, investors, and healthcare professionals seeking a deep understanding of this vital segment of the pharmaceutical market. The global ESA market is projected to reach xx Million by 2033, demonstrating significant growth potential.
Erythropoietin Stimulating Agents Industry Market Composition & Trends
This section delves into the intricate structure of the ESA market, examining market concentration, innovation drivers, regulatory landscapes, substitute products, end-user profiles, and mergers & acquisitions (M&A) activities. The report analyzes market share distribution among key players, revealing the competitive intensity and market leadership dynamics. Several factors influence the market. For example, the increasing prevalence of chronic kidney disease and cancer fuels demand, yet stringent regulatory approvals and the emergence of biosimilars pose challenges.
- Market Concentration: The ESA market exhibits a moderately concentrated structure, with a few large multinational pharmaceutical companies holding significant market share. The exact market share distribution will be detailed within the full report, including data on the top 5 players.
- Innovation Catalysts: Ongoing research into novel ESA formulations, including long-acting and targeted delivery systems, is driving innovation.
- Regulatory Landscape: Stringent regulatory pathways and biosimilar approvals significantly impact market access and pricing strategies. Variations in regulatory approvals across different geographies are also analyzed.
- Substitute Products: The emergence of alternative treatments for anemia, including iron supplementation and other hematological agents, poses competitive pressure.
- End-User Profiles: The primary end-users are hospitals, clinics, and dialysis centers. The report provides a detailed segmentation based on end-user type and associated market size.
- M&A Activities: The report details recent M&A activities within the ESA market, including deal values (xx Million) and their impact on market dynamics. Specific examples of significant M&A transactions will be discussed in detail.
Erythropoietin Stimulating Agents Industry Industry Evolution
This section offers a comprehensive overview of the ESA market's historical evolution (2019-2024), current state (2025), and projected future (2025-2033). The analysis encompasses market growth trajectories, technological advancements, and shifting consumer demands. Data-driven insights on growth rates and adoption metrics reveal the dynamic nature of the market. The rise of biosimilars has significantly influenced pricing and market competition, while technological innovations such as novel delivery systems are reshaping the landscape. The report quantifies the impact of these trends, presenting detailed projections for market growth across different segments. The specific growth rates and adoption metrics will be presented in the complete report.
Leading Regions, Countries, or Segments in Erythropoietin Stimulating Agents Industry
This section identifies the leading regions, countries, and segments within the ESA market. It uses a detailed analysis of market drivers for each segment including Type (Epoetin Alfa, Epoetin Beta, Darbepoetin Alfa, Other Types) and Application (Cancer, Renal Disorders, Anti-retroviral Treatment, Neural Diseases, Other Applications).
- Key Drivers (Examples):
- Investment Trends: Significant investments in R&D are driving innovation in specific regions.
- Regulatory Support: Favorable regulatory environments in certain countries are accelerating market growth.
- Dominance Factors (In-depth analysis): This section explains the factors contributing to the leading position of specific regions or segments, considering factors such as disease prevalence, healthcare infrastructure, and market access policies.
Erythropoietin Stimulating Agents Industry Product Innovations
Recent product innovations in the ESA market include advancements in long-acting formulations and improved delivery systems. These innovations aim to enhance efficacy, reduce injection frequency, and improve patient compliance. Specific examples of novel ESA products and their unique selling propositions will be highlighted in the full report, including details on performance metrics such as efficacy and safety profiles.
Propelling Factors for Erythropoietin Stimulating Agents Industry Growth
Several factors are driving growth in the ESA market. Increasing prevalence of chronic kidney disease and cancer are key contributors. Technological advancements in ESA formulations, such as long-acting versions, improve patient compliance and treatment outcomes. Furthermore, supportive regulatory policies in certain regions are boosting market expansion.
Obstacles in the Erythropoietin Stimulating Agents Industry Market
Despite the positive growth drivers, the ESA market faces challenges. Stringent regulatory approvals, coupled with the entry of biosimilars, create pricing pressure and impact market profitability. Supply chain disruptions and intense competition among manufacturers also pose significant obstacles to sustainable growth. The report quantifies the impact of these challenges on market growth and provides strategies for mitigation.
Future Opportunities in Erythropoietin Stimulating Agents Industry
Future opportunities lie in expanding into emerging markets with high disease prevalence and unmet needs. Developing novel ESA formulations with improved efficacy and safety profiles, coupled with advancements in targeted drug delivery, offer further avenues for growth. Exploring new therapeutic applications for ESA beyond traditional indications represents significant potential.
Major Players in the Erythropoietin Stimulating Agents Industry Ecosystem
- Celltrion Inc
- Probiomed S A de C V
- Amgen Inc
- F Hoffmann-La Roche Ltd
- LG Lifesciences Ltd
- Johnson and Johnson
- Nanogen Pharmaceutical Biotechnology
- Ranbaxy Laboratories Ltd
- Teva Pharmaceutical Industries Ltd
- Panacea Biotec Ltd
- Novartis AG(Sandoz)
- Sun Pharmaceutical Industries Ltd
- BioSidus
- Biocon Limited
- Lupin Pharma
- Thermo Fisher Scientific
- Dr Reddy's Laboratories Ltd
- Celon Laboratories Pvt Ltd
- Intas Pharmaceuticals Ltd
- Pfizer Inc
Key Developments in Erythropoietin Stimulating Agents Industry Industry
- [Year/Month]: [Specific development, e.g., Launch of a new ESA formulation by Company X] – Impact on market dynamics [brief description]
- [Year/Month]: [Specific development, e.g., Approval of a biosimilar ESA by regulatory body Y] – Impact on market dynamics [brief description]
- [Continue with additional bullet points, each detailing a key development and its impact]
Strategic Erythropoietin Stimulating Agents Industry Market Forecast
The ESA market is poised for continued growth driven by increasing disease prevalence, technological advancements, and expansion into emerging markets. The forecast period (2025-2033) projects significant market expansion, with opportunities for innovation and market leadership. The report provides detailed market forecasts by segment and region, along with key success factors for industry players.
Erythropoietin Stimulating Agents Industry Segmentation
-
1. Type
- 1.1. Epoetin Alfa
- 1.2. Epoetin Beta
- 1.3. Darbepoetin Alfa
- 1.4. Other Types
-
2. Application
- 2.1. Cancer
- 2.2. Renal Disorders
- 2.3. Anti-retroviral Treatment
- 2.4. Neural Diseases
- 2.5. Other Applications
Erythropoietin Stimulating Agents Industry Segmentation By Geography
-
1. North America
- 1.1. United States
- 2. Canada
- 3. Mexico
-
4. Europe
- 4.1. Germany
- 5. United Kingdom
- 6. France
- 7. Italy
- 8. Spain
- 9. Rest of Europe
-
10. Asia Pacific
- 10.1. China
- 11. Japan
- 12. India
- 13. Australia
- 14. South Korea
- 15. Rest of Asia Pacific
-
16. Middle East and Africa
- 16.1. GCC
- 17. South Africa
- 18. Rest of Middle East and Africa
-
19. South America
- 19.1. Brazil
- 20. Argentina
- 21. Rest of South America
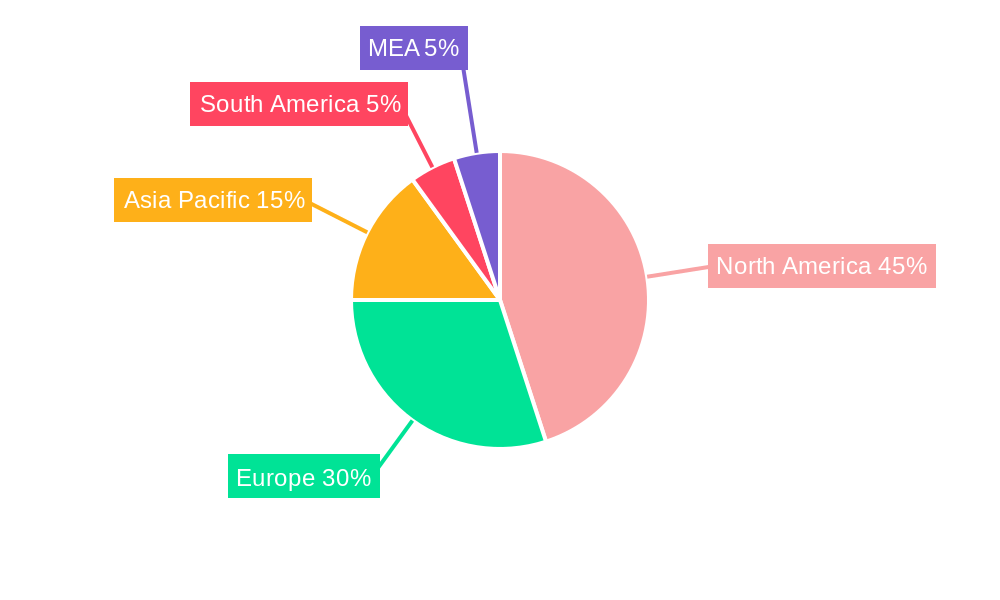
Erythropoietin Stimulating Agents Industry Regional Market Share
Geographic Coverage of Erythropoietin Stimulating Agents Industry
Erythropoietin Stimulating Agents Industry REPORT HIGHLIGHTS
| Aspects | Details |
|---|---|
| Study Period | 2020-2034 |
| Base Year | 2025 |
| Estimated Year | 2026 |
| Forecast Period | 2026-2034 |
| Historical Period | 2020-2025 |
| Growth Rate | CAGR of 12.06% from 2020-2034 |
| Segmentation |
|
Table of Contents
- 1. Introduction
- 1.1. Research Scope
- 1.2. Market Segmentation
- 1.3. Research Methodology
- 1.4. Definitions and Assumptions
- 2. Executive Summary
- 2.1. Introduction
- 3. Market Dynamics
- 3.1. Introduction
- 3.2. Market Drivers
- 3.2.1 Increasing Disease Burden of Anemia; Rising Applications in HIV Infections and End-stage Renal Disorder; Risks of Thrombosis
- 3.2.2 during Surgeries
- 3.2.3 and Pure Red Cell Aplasia
- 3.3. Market Restrains
- 3.3.1. Stringent Regulatory Guidelines; Adverse Side Effects
- 3.4. Market Trends
- 3.4.1. Cancer Application Expected to Dominate the Market Over the Forecast Period
- 4. Market Factor Analysis
- 4.1. Porters Five Forces
- 4.2. Supply/Value Chain
- 4.3. PESTEL analysis
- 4.4. Market Entropy
- 4.5. Patent/Trademark Analysis
- 5. Global Erythropoietin Stimulating Agents Industry Analysis, Insights and Forecast, 2020-2032
- 5.1. Market Analysis, Insights and Forecast - by Type
- 5.1.1. Epoetin Alfa
- 5.1.2. Epoetin Beta
- 5.1.3. Darbepoetin Alfa
- 5.1.4. Other Types
- 5.2. Market Analysis, Insights and Forecast - by Application
- 5.2.1. Cancer
- 5.2.2. Renal Disorders
- 5.2.3. Anti-retroviral Treatment
- 5.2.4. Neural Diseases
- 5.2.5. Other Applications
- 5.3. Market Analysis, Insights and Forecast - by Region
- 5.3.1. North America
- 5.3.2. Canada
- 5.3.3. Mexico
- 5.3.4. Europe
- 5.3.5. United Kingdom
- 5.3.6. France
- 5.3.7. Italy
- 5.3.8. Spain
- 5.3.9. Rest of Europe
- 5.3.10. Asia Pacific
- 5.3.11. Japan
- 5.3.12. India
- 5.3.13. Australia
- 5.3.14. South Korea
- 5.3.15. Rest of Asia Pacific
- 5.3.16. Middle East and Africa
- 5.3.17. South Africa
- 5.3.18. Rest of Middle East and Africa
- 5.3.19. South America
- 5.3.20. Argentina
- 5.3.21. Rest of South America
- 5.1. Market Analysis, Insights and Forecast - by Type
- 6. North America Erythropoietin Stimulating Agents Industry Analysis, Insights and Forecast, 2020-2032
- 6.1. Market Analysis, Insights and Forecast - by Type
- 6.1.1. Epoetin Alfa
- 6.1.2. Epoetin Beta
- 6.1.3. Darbepoetin Alfa
- 6.1.4. Other Types
- 6.2. Market Analysis, Insights and Forecast - by Application
- 6.2.1. Cancer
- 6.2.2. Renal Disorders
- 6.2.3. Anti-retroviral Treatment
- 6.2.4. Neural Diseases
- 6.2.5. Other Applications
- 6.1. Market Analysis, Insights and Forecast - by Type
- 7. Canada Erythropoietin Stimulating Agents Industry Analysis, Insights and Forecast, 2020-2032
- 7.1. Market Analysis, Insights and Forecast - by Type
- 7.1.1. Epoetin Alfa
- 7.1.2. Epoetin Beta
- 7.1.3. Darbepoetin Alfa
- 7.1.4. Other Types
- 7.2. Market Analysis, Insights and Forecast - by Application
- 7.2.1. Cancer
- 7.2.2. Renal Disorders
- 7.2.3. Anti-retroviral Treatment
- 7.2.4. Neural Diseases
- 7.2.5. Other Applications
- 7.1. Market Analysis, Insights and Forecast - by Type
- 8. Mexico Erythropoietin Stimulating Agents Industry Analysis, Insights and Forecast, 2020-2032
- 8.1. Market Analysis, Insights and Forecast - by Type
- 8.1.1. Epoetin Alfa
- 8.1.2. Epoetin Beta
- 8.1.3. Darbepoetin Alfa
- 8.1.4. Other Types
- 8.2. Market Analysis, Insights and Forecast - by Application
- 8.2.1. Cancer
- 8.2.2. Renal Disorders
- 8.2.3. Anti-retroviral Treatment
- 8.2.4. Neural Diseases
- 8.2.5. Other Applications
- 8.1. Market Analysis, Insights and Forecast - by Type
- 9. Europe Erythropoietin Stimulating Agents Industry Analysis, Insights and Forecast, 2020-2032
- 9.1. Market Analysis, Insights and Forecast - by Type
- 9.1.1. Epoetin Alfa
- 9.1.2. Epoetin Beta
- 9.1.3. Darbepoetin Alfa
- 9.1.4. Other Types
- 9.2. Market Analysis, Insights and Forecast - by Application
- 9.2.1. Cancer
- 9.2.2. Renal Disorders
- 9.2.3. Anti-retroviral Treatment
- 9.2.4. Neural Diseases
- 9.2.5. Other Applications
- 9.1. Market Analysis, Insights and Forecast - by Type
- 10. United Kingdom Erythropoietin Stimulating Agents Industry Analysis, Insights and Forecast, 2020-2032
- 10.1. Market Analysis, Insights and Forecast - by Type
- 10.1.1. Epoetin Alfa
- 10.1.2. Epoetin Beta
- 10.1.3. Darbepoetin Alfa
- 10.1.4. Other Types
- 10.2. Market Analysis, Insights and Forecast - by Application
- 10.2.1. Cancer
- 10.2.2. Renal Disorders
- 10.2.3. Anti-retroviral Treatment
- 10.2.4. Neural Diseases
- 10.2.5. Other Applications
- 10.1. Market Analysis, Insights and Forecast - by Type
- 11. France Erythropoietin Stimulating Agents Industry Analysis, Insights and Forecast, 2020-2032
- 11.1. Market Analysis, Insights and Forecast - by Type
- 11.1.1. Epoetin Alfa
- 11.1.2. Epoetin Beta
- 11.1.3. Darbepoetin Alfa
- 11.1.4. Other Types
- 11.2. Market Analysis, Insights and Forecast - by Application
- 11.2.1. Cancer
- 11.2.2. Renal Disorders
- 11.2.3. Anti-retroviral Treatment
- 11.2.4. Neural Diseases
- 11.2.5. Other Applications
- 11.1. Market Analysis, Insights and Forecast - by Type
- 12. Italy Erythropoietin Stimulating Agents Industry Analysis, Insights and Forecast, 2020-2032
- 12.1. Market Analysis, Insights and Forecast - by Type
- 12.1.1. Epoetin Alfa
- 12.1.2. Epoetin Beta
- 12.1.3. Darbepoetin Alfa
- 12.1.4. Other Types
- 12.2. Market Analysis, Insights and Forecast - by Application
- 12.2.1. Cancer
- 12.2.2. Renal Disorders
- 12.2.3. Anti-retroviral Treatment
- 12.2.4. Neural Diseases
- 12.2.5. Other Applications
- 12.1. Market Analysis, Insights and Forecast - by Type
- 13. Spain Erythropoietin Stimulating Agents Industry Analysis, Insights and Forecast, 2020-2032
- 13.1. Market Analysis, Insights and Forecast - by Type
- 13.1.1. Epoetin Alfa
- 13.1.2. Epoetin Beta
- 13.1.3. Darbepoetin Alfa
- 13.1.4. Other Types
- 13.2. Market Analysis, Insights and Forecast - by Application
- 13.2.1. Cancer
- 13.2.2. Renal Disorders
- 13.2.3. Anti-retroviral Treatment
- 13.2.4. Neural Diseases
- 13.2.5. Other Applications
- 13.1. Market Analysis, Insights and Forecast - by Type
- 14. Rest of Europe Erythropoietin Stimulating Agents Industry Analysis, Insights and Forecast, 2020-2032
- 14.1. Market Analysis, Insights and Forecast - by Type
- 14.1.1. Epoetin Alfa
- 14.1.2. Epoetin Beta
- 14.1.3. Darbepoetin Alfa
- 14.1.4. Other Types
- 14.2. Market Analysis, Insights and Forecast - by Application
- 14.2.1. Cancer
- 14.2.2. Renal Disorders
- 14.2.3. Anti-retroviral Treatment
- 14.2.4. Neural Diseases
- 14.2.5. Other Applications
- 14.1. Market Analysis, Insights and Forecast - by Type
- 15. Asia Pacific Erythropoietin Stimulating Agents Industry Analysis, Insights and Forecast, 2020-2032
- 15.1. Market Analysis, Insights and Forecast - by Type
- 15.1.1. Epoetin Alfa
- 15.1.2. Epoetin Beta
- 15.1.3. Darbepoetin Alfa
- 15.1.4. Other Types
- 15.2. Market Analysis, Insights and Forecast - by Application
- 15.2.1. Cancer
- 15.2.2. Renal Disorders
- 15.2.3. Anti-retroviral Treatment
- 15.2.4. Neural Diseases
- 15.2.5. Other Applications
- 15.1. Market Analysis, Insights and Forecast - by Type
- 16. Japan Erythropoietin Stimulating Agents Industry Analysis, Insights and Forecast, 2020-2032
- 16.1. Market Analysis, Insights and Forecast - by Type
- 16.1.1. Epoetin Alfa
- 16.1.2. Epoetin Beta
- 16.1.3. Darbepoetin Alfa
- 16.1.4. Other Types
- 16.2. Market Analysis, Insights and Forecast - by Application
- 16.2.1. Cancer
- 16.2.2. Renal Disorders
- 16.2.3. Anti-retroviral Treatment
- 16.2.4. Neural Diseases
- 16.2.5. Other Applications
- 16.1. Market Analysis, Insights and Forecast - by Type
- 17. India Erythropoietin Stimulating Agents Industry Analysis, Insights and Forecast, 2020-2032
- 17.1. Market Analysis, Insights and Forecast - by Type
- 17.1.1. Epoetin Alfa
- 17.1.2. Epoetin Beta
- 17.1.3. Darbepoetin Alfa
- 17.1.4. Other Types
- 17.2. Market Analysis, Insights and Forecast - by Application
- 17.2.1. Cancer
- 17.2.2. Renal Disorders
- 17.2.3. Anti-retroviral Treatment
- 17.2.4. Neural Diseases
- 17.2.5. Other Applications
- 17.1. Market Analysis, Insights and Forecast - by Type
- 18. Australia Erythropoietin Stimulating Agents Industry Analysis, Insights and Forecast, 2020-2032
- 18.1. Market Analysis, Insights and Forecast - by Type
- 18.1.1. Epoetin Alfa
- 18.1.2. Epoetin Beta
- 18.1.3. Darbepoetin Alfa
- 18.1.4. Other Types
- 18.2. Market Analysis, Insights and Forecast - by Application
- 18.2.1. Cancer
- 18.2.2. Renal Disorders
- 18.2.3. Anti-retroviral Treatment
- 18.2.4. Neural Diseases
- 18.2.5. Other Applications
- 18.1. Market Analysis, Insights and Forecast - by Type
- 19. South Korea Erythropoietin Stimulating Agents Industry Analysis, Insights and Forecast, 2020-2032
- 19.1. Market Analysis, Insights and Forecast - by Type
- 19.1.1. Epoetin Alfa
- 19.1.2. Epoetin Beta
- 19.1.3. Darbepoetin Alfa
- 19.1.4. Other Types
- 19.2. Market Analysis, Insights and Forecast - by Application
- 19.2.1. Cancer
- 19.2.2. Renal Disorders
- 19.2.3. Anti-retroviral Treatment
- 19.2.4. Neural Diseases
- 19.2.5. Other Applications
- 19.1. Market Analysis, Insights and Forecast - by Type
- 20. Rest of Asia Pacific Erythropoietin Stimulating Agents Industry Analysis, Insights and Forecast, 2020-2032
- 20.1. Market Analysis, Insights and Forecast - by Type
- 20.1.1. Epoetin Alfa
- 20.1.2. Epoetin Beta
- 20.1.3. Darbepoetin Alfa
- 20.1.4. Other Types
- 20.2. Market Analysis, Insights and Forecast - by Application
- 20.2.1. Cancer
- 20.2.2. Renal Disorders
- 20.2.3. Anti-retroviral Treatment
- 20.2.4. Neural Diseases
- 20.2.5. Other Applications
- 20.1. Market Analysis, Insights and Forecast - by Type
- 21. Middle East and Africa Erythropoietin Stimulating Agents Industry Analysis, Insights and Forecast, 2020-2032
- 21.1. Market Analysis, Insights and Forecast - by Type
- 21.1.1. Epoetin Alfa
- 21.1.2. Epoetin Beta
- 21.1.3. Darbepoetin Alfa
- 21.1.4. Other Types
- 21.2. Market Analysis, Insights and Forecast - by Application
- 21.2.1. Cancer
- 21.2.2. Renal Disorders
- 21.2.3. Anti-retroviral Treatment
- 21.2.4. Neural Diseases
- 21.2.5. Other Applications
- 21.1. Market Analysis, Insights and Forecast - by Type
- 22. South Africa Erythropoietin Stimulating Agents Industry Analysis, Insights and Forecast, 2020-2032
- 22.1. Market Analysis, Insights and Forecast - by Type
- 22.1.1. Epoetin Alfa
- 22.1.2. Epoetin Beta
- 22.1.3. Darbepoetin Alfa
- 22.1.4. Other Types
- 22.2. Market Analysis, Insights and Forecast - by Application
- 22.2.1. Cancer
- 22.2.2. Renal Disorders
- 22.2.3. Anti-retroviral Treatment
- 22.2.4. Neural Diseases
- 22.2.5. Other Applications
- 22.1. Market Analysis, Insights and Forecast - by Type
- 23. Rest of Middle East and Africa Erythropoietin Stimulating Agents Industry Analysis, Insights and Forecast, 2020-2032
- 23.1. Market Analysis, Insights and Forecast - by Type
- 23.1.1. Epoetin Alfa
- 23.1.2. Epoetin Beta
- 23.1.3. Darbepoetin Alfa
- 23.1.4. Other Types
- 23.2. Market Analysis, Insights and Forecast - by Application
- 23.2.1. Cancer
- 23.2.2. Renal Disorders
- 23.2.3. Anti-retroviral Treatment
- 23.2.4. Neural Diseases
- 23.2.5. Other Applications
- 23.1. Market Analysis, Insights and Forecast - by Type
- 24. South America Erythropoietin Stimulating Agents Industry Analysis, Insights and Forecast, 2020-2032
- 24.1. Market Analysis, Insights and Forecast - by Type
- 24.1.1. Epoetin Alfa
- 24.1.2. Epoetin Beta
- 24.1.3. Darbepoetin Alfa
- 24.1.4. Other Types
- 24.2. Market Analysis, Insights and Forecast - by Application
- 24.2.1. Cancer
- 24.2.2. Renal Disorders
- 24.2.3. Anti-retroviral Treatment
- 24.2.4. Neural Diseases
- 24.2.5. Other Applications
- 24.1. Market Analysis, Insights and Forecast - by Type
- 25. Argentina Erythropoietin Stimulating Agents Industry Analysis, Insights and Forecast, 2020-2032
- 25.1. Market Analysis, Insights and Forecast - by Type
- 25.1.1. Epoetin Alfa
- 25.1.2. Epoetin Beta
- 25.1.3. Darbepoetin Alfa
- 25.1.4. Other Types
- 25.2. Market Analysis, Insights and Forecast - by Application
- 25.2.1. Cancer
- 25.2.2. Renal Disorders
- 25.2.3. Anti-retroviral Treatment
- 25.2.4. Neural Diseases
- 25.2.5. Other Applications
- 25.1. Market Analysis, Insights and Forecast - by Type
- 26. Rest of South America Erythropoietin Stimulating Agents Industry Analysis, Insights and Forecast, 2020-2032
- 26.1. Market Analysis, Insights and Forecast - by Type
- 26.1.1. Epoetin Alfa
- 26.1.2. Epoetin Beta
- 26.1.3. Darbepoetin Alfa
- 26.1.4. Other Types
- 26.2. Market Analysis, Insights and Forecast - by Application
- 26.2.1. Cancer
- 26.2.2. Renal Disorders
- 26.2.3. Anti-retroviral Treatment
- 26.2.4. Neural Diseases
- 26.2.5. Other Applications
- 26.1. Market Analysis, Insights and Forecast - by Type
- 27. Competitive Analysis
- 27.1. Global Market Share Analysis 2025
- 27.2. Company Profiles
- 27.2.1 Celltrion Inc
- 27.2.1.1. Overview
- 27.2.1.2. Products
- 27.2.1.3. SWOT Analysis
- 27.2.1.4. Recent Developments
- 27.2.1.5. Financials (Based on Availability)
- 27.2.2 Probiomed S A de C V
- 27.2.2.1. Overview
- 27.2.2.2. Products
- 27.2.2.3. SWOT Analysis
- 27.2.2.4. Recent Developments
- 27.2.2.5. Financials (Based on Availability)
- 27.2.3 Amgen Inc
- 27.2.3.1. Overview
- 27.2.3.2. Products
- 27.2.3.3. SWOT Analysis
- 27.2.3.4. Recent Developments
- 27.2.3.5. Financials (Based on Availability)
- 27.2.4 F Hoffmann-La Roche Ltd
- 27.2.4.1. Overview
- 27.2.4.2. Products
- 27.2.4.3. SWOT Analysis
- 27.2.4.4. Recent Developments
- 27.2.4.5. Financials (Based on Availability)
- 27.2.5 LG Lifesciences Ltd
- 27.2.5.1. Overview
- 27.2.5.2. Products
- 27.2.5.3. SWOT Analysis
- 27.2.5.4. Recent Developments
- 27.2.5.5. Financials (Based on Availability)
- 27.2.6 Johnson and Johnson
- 27.2.6.1. Overview
- 27.2.6.2. Products
- 27.2.6.3. SWOT Analysis
- 27.2.6.4. Recent Developments
- 27.2.6.5. Financials (Based on Availability)
- 27.2.7 Nanogen Pharmaceutical Biotechnology
- 27.2.7.1. Overview
- 27.2.7.2. Products
- 27.2.7.3. SWOT Analysis
- 27.2.7.4. Recent Developments
- 27.2.7.5. Financials (Based on Availability)
- 27.2.8 Ranbaxy Laboratories Ltd
- 27.2.8.1. Overview
- 27.2.8.2. Products
- 27.2.8.3. SWOT Analysis
- 27.2.8.4. Recent Developments
- 27.2.8.5. Financials (Based on Availability)
- 27.2.9 Teva Pharmaceutical Industries Ltd
- 27.2.9.1. Overview
- 27.2.9.2. Products
- 27.2.9.3. SWOT Analysis
- 27.2.9.4. Recent Developments
- 27.2.9.5. Financials (Based on Availability)
- 27.2.10 Panacea Biotec Ltd
- 27.2.10.1. Overview
- 27.2.10.2. Products
- 27.2.10.3. SWOT Analysis
- 27.2.10.4. Recent Developments
- 27.2.10.5. Financials (Based on Availability)
- 27.2.11 Novartis AG(Sandoz)
- 27.2.11.1. Overview
- 27.2.11.2. Products
- 27.2.11.3. SWOT Analysis
- 27.2.11.4. Recent Developments
- 27.2.11.5. Financials (Based on Availability)
- 27.2.12 Sun Pharmaceutical Industries Ltd
- 27.2.12.1. Overview
- 27.2.12.2. Products
- 27.2.12.3. SWOT Analysis
- 27.2.12.4. Recent Developments
- 27.2.12.5. Financials (Based on Availability)
- 27.2.13 BioSidus
- 27.2.13.1. Overview
- 27.2.13.2. Products
- 27.2.13.3. SWOT Analysis
- 27.2.13.4. Recent Developments
- 27.2.13.5. Financials (Based on Availability)
- 27.2.14 Biocon Limited
- 27.2.14.1. Overview
- 27.2.14.2. Products
- 27.2.14.3. SWOT Analysis
- 27.2.14.4. Recent Developments
- 27.2.14.5. Financials (Based on Availability)
- 27.2.15 Lupin Pharma
- 27.2.15.1. Overview
- 27.2.15.2. Products
- 27.2.15.3. SWOT Analysis
- 27.2.15.4. Recent Developments
- 27.2.15.5. Financials (Based on Availability)
- 27.2.16 Thermo Fisher Scientific
- 27.2.16.1. Overview
- 27.2.16.2. Products
- 27.2.16.3. SWOT Analysis
- 27.2.16.4. Recent Developments
- 27.2.16.5. Financials (Based on Availability)
- 27.2.17 Dr Reddy's Laboratories Ltd
- 27.2.17.1. Overview
- 27.2.17.2. Products
- 27.2.17.3. SWOT Analysis
- 27.2.17.4. Recent Developments
- 27.2.17.5. Financials (Based on Availability)
- 27.2.18 Celon Laboratories Pvt Ltd
- 27.2.18.1. Overview
- 27.2.18.2. Products
- 27.2.18.3. SWOT Analysis
- 27.2.18.4. Recent Developments
- 27.2.18.5. Financials (Based on Availability)
- 27.2.19 Intas Pharmaceuticals Ltd
- 27.2.19.1. Overview
- 27.2.19.2. Products
- 27.2.19.3. SWOT Analysis
- 27.2.19.4. Recent Developments
- 27.2.19.5. Financials (Based on Availability)
- 27.2.20 Pfizer Inc
- 27.2.20.1. Overview
- 27.2.20.2. Products
- 27.2.20.3. SWOT Analysis
- 27.2.20.4. Recent Developments
- 27.2.20.5. Financials (Based on Availability)
- 27.2.1 Celltrion Inc
List of Figures
- Figure 1: Global Erythropoietin Stimulating Agents Industry Revenue Breakdown (billion, %) by Region 2025 & 2033
- Figure 2: Global Erythropoietin Stimulating Agents Industry Volume Breakdown (K Unit, %) by Region 2025 & 2033
- Figure 3: North America Erythropoietin Stimulating Agents Industry Revenue (billion), by Type 2025 & 2033
- Figure 4: North America Erythropoietin Stimulating Agents Industry Volume (K Unit), by Type 2025 & 2033
- Figure 5: North America Erythropoietin Stimulating Agents Industry Revenue Share (%), by Type 2025 & 2033
- Figure 6: North America Erythropoietin Stimulating Agents Industry Volume Share (%), by Type 2025 & 2033
- Figure 7: North America Erythropoietin Stimulating Agents Industry Revenue (billion), by Application 2025 & 2033
- Figure 8: North America Erythropoietin Stimulating Agents Industry Volume (K Unit), by Application 2025 & 2033
- Figure 9: North America Erythropoietin Stimulating Agents Industry Revenue Share (%), by Application 2025 & 2033
- Figure 10: North America Erythropoietin Stimulating Agents Industry Volume Share (%), by Application 2025 & 2033
- Figure 11: North America Erythropoietin Stimulating Agents Industry Revenue (billion), by Country 2025 & 2033
- Figure 12: North America Erythropoietin Stimulating Agents Industry Volume (K Unit), by Country 2025 & 2033
- Figure 13: North America Erythropoietin Stimulating Agents Industry Revenue Share (%), by Country 2025 & 2033
- Figure 14: North America Erythropoietin Stimulating Agents Industry Volume Share (%), by Country 2025 & 2033
- Figure 15: Canada Erythropoietin Stimulating Agents Industry Revenue (billion), by Type 2025 & 2033
- Figure 16: Canada Erythropoietin Stimulating Agents Industry Volume (K Unit), by Type 2025 & 2033
- Figure 17: Canada Erythropoietin Stimulating Agents Industry Revenue Share (%), by Type 2025 & 2033
- Figure 18: Canada Erythropoietin Stimulating Agents Industry Volume Share (%), by Type 2025 & 2033
- Figure 19: Canada Erythropoietin Stimulating Agents Industry Revenue (billion), by Application 2025 & 2033
- Figure 20: Canada Erythropoietin Stimulating Agents Industry Volume (K Unit), by Application 2025 & 2033
- Figure 21: Canada Erythropoietin Stimulating Agents Industry Revenue Share (%), by Application 2025 & 2033
- Figure 22: Canada Erythropoietin Stimulating Agents Industry Volume Share (%), by Application 2025 & 2033
- Figure 23: Canada Erythropoietin Stimulating Agents Industry Revenue (billion), by Country 2025 & 2033
- Figure 24: Canada Erythropoietin Stimulating Agents Industry Volume (K Unit), by Country 2025 & 2033
- Figure 25: Canada Erythropoietin Stimulating Agents Industry Revenue Share (%), by Country 2025 & 2033
- Figure 26: Canada Erythropoietin Stimulating Agents Industry Volume Share (%), by Country 2025 & 2033
- Figure 27: Mexico Erythropoietin Stimulating Agents Industry Revenue (billion), by Type 2025 & 2033
- Figure 28: Mexico Erythropoietin Stimulating Agents Industry Volume (K Unit), by Type 2025 & 2033
- Figure 29: Mexico Erythropoietin Stimulating Agents Industry Revenue Share (%), by Type 2025 & 2033
- Figure 30: Mexico Erythropoietin Stimulating Agents Industry Volume Share (%), by Type 2025 & 2033
- Figure 31: Mexico Erythropoietin Stimulating Agents Industry Revenue (billion), by Application 2025 & 2033
- Figure 32: Mexico Erythropoietin Stimulating Agents Industry Volume (K Unit), by Application 2025 & 2033
- Figure 33: Mexico Erythropoietin Stimulating Agents Industry Revenue Share (%), by Application 2025 & 2033
- Figure 34: Mexico Erythropoietin Stimulating Agents Industry Volume Share (%), by Application 2025 & 2033
- Figure 35: Mexico Erythropoietin Stimulating Agents Industry Revenue (billion), by Country 2025 & 2033
- Figure 36: Mexico Erythropoietin Stimulating Agents Industry Volume (K Unit), by Country 2025 & 2033
- Figure 37: Mexico Erythropoietin Stimulating Agents Industry Revenue Share (%), by Country 2025 & 2033
- Figure 38: Mexico Erythropoietin Stimulating Agents Industry Volume Share (%), by Country 2025 & 2033
- Figure 39: Europe Erythropoietin Stimulating Agents Industry Revenue (billion), by Type 2025 & 2033
- Figure 40: Europe Erythropoietin Stimulating Agents Industry Volume (K Unit), by Type 2025 & 2033
- Figure 41: Europe Erythropoietin Stimulating Agents Industry Revenue Share (%), by Type 2025 & 2033
- Figure 42: Europe Erythropoietin Stimulating Agents Industry Volume Share (%), by Type 2025 & 2033
- Figure 43: Europe Erythropoietin Stimulating Agents Industry Revenue (billion), by Application 2025 & 2033
- Figure 44: Europe Erythropoietin Stimulating Agents Industry Volume (K Unit), by Application 2025 & 2033
- Figure 45: Europe Erythropoietin Stimulating Agents Industry Revenue Share (%), by Application 2025 & 2033
- Figure 46: Europe Erythropoietin Stimulating Agents Industry Volume Share (%), by Application 2025 & 2033
- Figure 47: Europe Erythropoietin Stimulating Agents Industry Revenue (billion), by Country 2025 & 2033
- Figure 48: Europe Erythropoietin Stimulating Agents Industry Volume (K Unit), by Country 2025 & 2033
- Figure 49: Europe Erythropoietin Stimulating Agents Industry Revenue Share (%), by Country 2025 & 2033
- Figure 50: Europe Erythropoietin Stimulating Agents Industry Volume Share (%), by Country 2025 & 2033
- Figure 51: United Kingdom Erythropoietin Stimulating Agents Industry Revenue (billion), by Type 2025 & 2033
- Figure 52: United Kingdom Erythropoietin Stimulating Agents Industry Volume (K Unit), by Type 2025 & 2033
- Figure 53: United Kingdom Erythropoietin Stimulating Agents Industry Revenue Share (%), by Type 2025 & 2033
- Figure 54: United Kingdom Erythropoietin Stimulating Agents Industry Volume Share (%), by Type 2025 & 2033
- Figure 55: United Kingdom Erythropoietin Stimulating Agents Industry Revenue (billion), by Application 2025 & 2033
- Figure 56: United Kingdom Erythropoietin Stimulating Agents Industry Volume (K Unit), by Application 2025 & 2033
- Figure 57: United Kingdom Erythropoietin Stimulating Agents Industry Revenue Share (%), by Application 2025 & 2033
- Figure 58: United Kingdom Erythropoietin Stimulating Agents Industry Volume Share (%), by Application 2025 & 2033
- Figure 59: United Kingdom Erythropoietin Stimulating Agents Industry Revenue (billion), by Country 2025 & 2033
- Figure 60: United Kingdom Erythropoietin Stimulating Agents Industry Volume (K Unit), by Country 2025 & 2033
- Figure 61: United Kingdom Erythropoietin Stimulating Agents Industry Revenue Share (%), by Country 2025 & 2033
- Figure 62: United Kingdom Erythropoietin Stimulating Agents Industry Volume Share (%), by Country 2025 & 2033
- Figure 63: France Erythropoietin Stimulating Agents Industry Revenue (billion), by Type 2025 & 2033
- Figure 64: France Erythropoietin Stimulating Agents Industry Volume (K Unit), by Type 2025 & 2033
- Figure 65: France Erythropoietin Stimulating Agents Industry Revenue Share (%), by Type 2025 & 2033
- Figure 66: France Erythropoietin Stimulating Agents Industry Volume Share (%), by Type 2025 & 2033
- Figure 67: France Erythropoietin Stimulating Agents Industry Revenue (billion), by Application 2025 & 2033
- Figure 68: France Erythropoietin Stimulating Agents Industry Volume (K Unit), by Application 2025 & 2033
- Figure 69: France Erythropoietin Stimulating Agents Industry Revenue Share (%), by Application 2025 & 2033
- Figure 70: France Erythropoietin Stimulating Agents Industry Volume Share (%), by Application 2025 & 2033
- Figure 71: France Erythropoietin Stimulating Agents Industry Revenue (billion), by Country 2025 & 2033
- Figure 72: France Erythropoietin Stimulating Agents Industry Volume (K Unit), by Country 2025 & 2033
- Figure 73: France Erythropoietin Stimulating Agents Industry Revenue Share (%), by Country 2025 & 2033
- Figure 74: France Erythropoietin Stimulating Agents Industry Volume Share (%), by Country 2025 & 2033
- Figure 75: Italy Erythropoietin Stimulating Agents Industry Revenue (billion), by Type 2025 & 2033
- Figure 76: Italy Erythropoietin Stimulating Agents Industry Volume (K Unit), by Type 2025 & 2033
- Figure 77: Italy Erythropoietin Stimulating Agents Industry Revenue Share (%), by Type 2025 & 2033
- Figure 78: Italy Erythropoietin Stimulating Agents Industry Volume Share (%), by Type 2025 & 2033
- Figure 79: Italy Erythropoietin Stimulating Agents Industry Revenue (billion), by Application 2025 & 2033
- Figure 80: Italy Erythropoietin Stimulating Agents Industry Volume (K Unit), by Application 2025 & 2033
- Figure 81: Italy Erythropoietin Stimulating Agents Industry Revenue Share (%), by Application 2025 & 2033
- Figure 82: Italy Erythropoietin Stimulating Agents Industry Volume Share (%), by Application 2025 & 2033
- Figure 83: Italy Erythropoietin Stimulating Agents Industry Revenue (billion), by Country 2025 & 2033
- Figure 84: Italy Erythropoietin Stimulating Agents Industry Volume (K Unit), by Country 2025 & 2033
- Figure 85: Italy Erythropoietin Stimulating Agents Industry Revenue Share (%), by Country 2025 & 2033
- Figure 86: Italy Erythropoietin Stimulating Agents Industry Volume Share (%), by Country 2025 & 2033
- Figure 87: Spain Erythropoietin Stimulating Agents Industry Revenue (billion), by Type 2025 & 2033
- Figure 88: Spain Erythropoietin Stimulating Agents Industry Volume (K Unit), by Type 2025 & 2033
- Figure 89: Spain Erythropoietin Stimulating Agents Industry Revenue Share (%), by Type 2025 & 2033
- Figure 90: Spain Erythropoietin Stimulating Agents Industry Volume Share (%), by Type 2025 & 2033
- Figure 91: Spain Erythropoietin Stimulating Agents Industry Revenue (billion), by Application 2025 & 2033
- Figure 92: Spain Erythropoietin Stimulating Agents Industry Volume (K Unit), by Application 2025 & 2033
- Figure 93: Spain Erythropoietin Stimulating Agents Industry Revenue Share (%), by Application 2025 & 2033
- Figure 94: Spain Erythropoietin Stimulating Agents Industry Volume Share (%), by Application 2025 & 2033
- Figure 95: Spain Erythropoietin Stimulating Agents Industry Revenue (billion), by Country 2025 & 2033
- Figure 96: Spain Erythropoietin Stimulating Agents Industry Volume (K Unit), by Country 2025 & 2033
- Figure 97: Spain Erythropoietin Stimulating Agents Industry Revenue Share (%), by Country 2025 & 2033
- Figure 98: Spain Erythropoietin Stimulating Agents Industry Volume Share (%), by Country 2025 & 2033
- Figure 99: Rest of Europe Erythropoietin Stimulating Agents Industry Revenue (billion), by Type 2025 & 2033
- Figure 100: Rest of Europe Erythropoietin Stimulating Agents Industry Volume (K Unit), by Type 2025 & 2033
- Figure 101: Rest of Europe Erythropoietin Stimulating Agents Industry Revenue Share (%), by Type 2025 & 2033
- Figure 102: Rest of Europe Erythropoietin Stimulating Agents Industry Volume Share (%), by Type 2025 & 2033
- Figure 103: Rest of Europe Erythropoietin Stimulating Agents Industry Revenue (billion), by Application 2025 & 2033
- Figure 104: Rest of Europe Erythropoietin Stimulating Agents Industry Volume (K Unit), by Application 2025 & 2033
- Figure 105: Rest of Europe Erythropoietin Stimulating Agents Industry Revenue Share (%), by Application 2025 & 2033
- Figure 106: Rest of Europe Erythropoietin Stimulating Agents Industry Volume Share (%), by Application 2025 & 2033
- Figure 107: Rest of Europe Erythropoietin Stimulating Agents Industry Revenue (billion), by Country 2025 & 2033
- Figure 108: Rest of Europe Erythropoietin Stimulating Agents Industry Volume (K Unit), by Country 2025 & 2033
- Figure 109: Rest of Europe Erythropoietin Stimulating Agents Industry Revenue Share (%), by Country 2025 & 2033
- Figure 110: Rest of Europe Erythropoietin Stimulating Agents Industry Volume Share (%), by Country 2025 & 2033
- Figure 111: Asia Pacific Erythropoietin Stimulating Agents Industry Revenue (billion), by Type 2025 & 2033
- Figure 112: Asia Pacific Erythropoietin Stimulating Agents Industry Volume (K Unit), by Type 2025 & 2033
- Figure 113: Asia Pacific Erythropoietin Stimulating Agents Industry Revenue Share (%), by Type 2025 & 2033
- Figure 114: Asia Pacific Erythropoietin Stimulating Agents Industry Volume Share (%), by Type 2025 & 2033
- Figure 115: Asia Pacific Erythropoietin Stimulating Agents Industry Revenue (billion), by Application 2025 & 2033
- Figure 116: Asia Pacific Erythropoietin Stimulating Agents Industry Volume (K Unit), by Application 2025 & 2033
- Figure 117: Asia Pacific Erythropoietin Stimulating Agents Industry Revenue Share (%), by Application 2025 & 2033
- Figure 118: Asia Pacific Erythropoietin Stimulating Agents Industry Volume Share (%), by Application 2025 & 2033
- Figure 119: Asia Pacific Erythropoietin Stimulating Agents Industry Revenue (billion), by Country 2025 & 2033
- Figure 120: Asia Pacific Erythropoietin Stimulating Agents Industry Volume (K Unit), by Country 2025 & 2033
- Figure 121: Asia Pacific Erythropoietin Stimulating Agents Industry Revenue Share (%), by Country 2025 & 2033
- Figure 122: Asia Pacific Erythropoietin Stimulating Agents Industry Volume Share (%), by Country 2025 & 2033
- Figure 123: Japan Erythropoietin Stimulating Agents Industry Revenue (billion), by Type 2025 & 2033
- Figure 124: Japan Erythropoietin Stimulating Agents Industry Volume (K Unit), by Type 2025 & 2033
- Figure 125: Japan Erythropoietin Stimulating Agents Industry Revenue Share (%), by Type 2025 & 2033
- Figure 126: Japan Erythropoietin Stimulating Agents Industry Volume Share (%), by Type 2025 & 2033
- Figure 127: Japan Erythropoietin Stimulating Agents Industry Revenue (billion), by Application 2025 & 2033
- Figure 128: Japan Erythropoietin Stimulating Agents Industry Volume (K Unit), by Application 2025 & 2033
- Figure 129: Japan Erythropoietin Stimulating Agents Industry Revenue Share (%), by Application 2025 & 2033
- Figure 130: Japan Erythropoietin Stimulating Agents Industry Volume Share (%), by Application 2025 & 2033
- Figure 131: Japan Erythropoietin Stimulating Agents Industry Revenue (billion), by Country 2025 & 2033
- Figure 132: Japan Erythropoietin Stimulating Agents Industry Volume (K Unit), by Country 2025 & 2033
- Figure 133: Japan Erythropoietin Stimulating Agents Industry Revenue Share (%), by Country 2025 & 2033
- Figure 134: Japan Erythropoietin Stimulating Agents Industry Volume Share (%), by Country 2025 & 2033
- Figure 135: India Erythropoietin Stimulating Agents Industry Revenue (billion), by Type 2025 & 2033
- Figure 136: India Erythropoietin Stimulating Agents Industry Volume (K Unit), by Type 2025 & 2033
- Figure 137: India Erythropoietin Stimulating Agents Industry Revenue Share (%), by Type 2025 & 2033
- Figure 138: India Erythropoietin Stimulating Agents Industry Volume Share (%), by Type 2025 & 2033
- Figure 139: India Erythropoietin Stimulating Agents Industry Revenue (billion), by Application 2025 & 2033
- Figure 140: India Erythropoietin Stimulating Agents Industry Volume (K Unit), by Application 2025 & 2033
- Figure 141: India Erythropoietin Stimulating Agents Industry Revenue Share (%), by Application 2025 & 2033
- Figure 142: India Erythropoietin Stimulating Agents Industry Volume Share (%), by Application 2025 & 2033
- Figure 143: India Erythropoietin Stimulating Agents Industry Revenue (billion), by Country 2025 & 2033
- Figure 144: India Erythropoietin Stimulating Agents Industry Volume (K Unit), by Country 2025 & 2033
- Figure 145: India Erythropoietin Stimulating Agents Industry Revenue Share (%), by Country 2025 & 2033
- Figure 146: India Erythropoietin Stimulating Agents Industry Volume Share (%), by Country 2025 & 2033
- Figure 147: Australia Erythropoietin Stimulating Agents Industry Revenue (billion), by Type 2025 & 2033
- Figure 148: Australia Erythropoietin Stimulating Agents Industry Volume (K Unit), by Type 2025 & 2033
- Figure 149: Australia Erythropoietin Stimulating Agents Industry Revenue Share (%), by Type 2025 & 2033
- Figure 150: Australia Erythropoietin Stimulating Agents Industry Volume Share (%), by Type 2025 & 2033
- Figure 151: Australia Erythropoietin Stimulating Agents Industry Revenue (billion), by Application 2025 & 2033
- Figure 152: Australia Erythropoietin Stimulating Agents Industry Volume (K Unit), by Application 2025 & 2033
- Figure 153: Australia Erythropoietin Stimulating Agents Industry Revenue Share (%), by Application 2025 & 2033
- Figure 154: Australia Erythropoietin Stimulating Agents Industry Volume Share (%), by Application 2025 & 2033
- Figure 155: Australia Erythropoietin Stimulating Agents Industry Revenue (billion), by Country 2025 & 2033
- Figure 156: Australia Erythropoietin Stimulating Agents Industry Volume (K Unit), by Country 2025 & 2033
- Figure 157: Australia Erythropoietin Stimulating Agents Industry Revenue Share (%), by Country 2025 & 2033
- Figure 158: Australia Erythropoietin Stimulating Agents Industry Volume Share (%), by Country 2025 & 2033
- Figure 159: South Korea Erythropoietin Stimulating Agents Industry Revenue (billion), by Type 2025 & 2033
- Figure 160: South Korea Erythropoietin Stimulating Agents Industry Volume (K Unit), by Type 2025 & 2033
- Figure 161: South Korea Erythropoietin Stimulating Agents Industry Revenue Share (%), by Type 2025 & 2033
- Figure 162: South Korea Erythropoietin Stimulating Agents Industry Volume Share (%), by Type 2025 & 2033
- Figure 163: South Korea Erythropoietin Stimulating Agents Industry Revenue (billion), by Application 2025 & 2033
- Figure 164: South Korea Erythropoietin Stimulating Agents Industry Volume (K Unit), by Application 2025 & 2033
- Figure 165: South Korea Erythropoietin Stimulating Agents Industry Revenue Share (%), by Application 2025 & 2033
- Figure 166: South Korea Erythropoietin Stimulating Agents Industry Volume Share (%), by Application 2025 & 2033
- Figure 167: South Korea Erythropoietin Stimulating Agents Industry Revenue (billion), by Country 2025 & 2033
- Figure 168: South Korea Erythropoietin Stimulating Agents Industry Volume (K Unit), by Country 2025 & 2033
- Figure 169: South Korea Erythropoietin Stimulating Agents Industry Revenue Share (%), by Country 2025 & 2033
- Figure 170: South Korea Erythropoietin Stimulating Agents Industry Volume Share (%), by Country 2025 & 2033
- Figure 171: Rest of Asia Pacific Erythropoietin Stimulating Agents Industry Revenue (billion), by Type 2025 & 2033
- Figure 172: Rest of Asia Pacific Erythropoietin Stimulating Agents Industry Volume (K Unit), by Type 2025 & 2033
- Figure 173: Rest of Asia Pacific Erythropoietin Stimulating Agents Industry Revenue Share (%), by Type 2025 & 2033
- Figure 174: Rest of Asia Pacific Erythropoietin Stimulating Agents Industry Volume Share (%), by Type 2025 & 2033
- Figure 175: Rest of Asia Pacific Erythropoietin Stimulating Agents Industry Revenue (billion), by Application 2025 & 2033
- Figure 176: Rest of Asia Pacific Erythropoietin Stimulating Agents Industry Volume (K Unit), by Application 2025 & 2033
- Figure 177: Rest of Asia Pacific Erythropoietin Stimulating Agents Industry Revenue Share (%), by Application 2025 & 2033
- Figure 178: Rest of Asia Pacific Erythropoietin Stimulating Agents Industry Volume Share (%), by Application 2025 & 2033
- Figure 179: Rest of Asia Pacific Erythropoietin Stimulating Agents Industry Revenue (billion), by Country 2025 & 2033
- Figure 180: Rest of Asia Pacific Erythropoietin Stimulating Agents Industry Volume (K Unit), by Country 2025 & 2033
- Figure 181: Rest of Asia Pacific Erythropoietin Stimulating Agents Industry Revenue Share (%), by Country 2025 & 2033
- Figure 182: Rest of Asia Pacific Erythropoietin Stimulating Agents Industry Volume Share (%), by Country 2025 & 2033
- Figure 183: Middle East and Africa Erythropoietin Stimulating Agents Industry Revenue (billion), by Type 2025 & 2033
- Figure 184: Middle East and Africa Erythropoietin Stimulating Agents Industry Volume (K Unit), by Type 2025 & 2033
- Figure 185: Middle East and Africa Erythropoietin Stimulating Agents Industry Revenue Share (%), by Type 2025 & 2033
- Figure 186: Middle East and Africa Erythropoietin Stimulating Agents Industry Volume Share (%), by Type 2025 & 2033
- Figure 187: Middle East and Africa Erythropoietin Stimulating Agents Industry Revenue (billion), by Application 2025 & 2033
- Figure 188: Middle East and Africa Erythropoietin Stimulating Agents Industry Volume (K Unit), by Application 2025 & 2033
- Figure 189: Middle East and Africa Erythropoietin Stimulating Agents Industry Revenue Share (%), by Application 2025 & 2033
- Figure 190: Middle East and Africa Erythropoietin Stimulating Agents Industry Volume Share (%), by Application 2025 & 2033
- Figure 191: Middle East and Africa Erythropoietin Stimulating Agents Industry Revenue (billion), by Country 2025 & 2033
- Figure 192: Middle East and Africa Erythropoietin Stimulating Agents Industry Volume (K Unit), by Country 2025 & 2033
- Figure 193: Middle East and Africa Erythropoietin Stimulating Agents Industry Revenue Share (%), by Country 2025 & 2033
- Figure 194: Middle East and Africa Erythropoietin Stimulating Agents Industry Volume Share (%), by Country 2025 & 2033
- Figure 195: South Africa Erythropoietin Stimulating Agents Industry Revenue (billion), by Type 2025 & 2033
- Figure 196: South Africa Erythropoietin Stimulating Agents Industry Volume (K Unit), by Type 2025 & 2033
- Figure 197: South Africa Erythropoietin Stimulating Agents Industry Revenue Share (%), by Type 2025 & 2033
- Figure 198: South Africa Erythropoietin Stimulating Agents Industry Volume Share (%), by Type 2025 & 2033
- Figure 199: South Africa Erythropoietin Stimulating Agents Industry Revenue (billion), by Application 2025 & 2033
- Figure 200: South Africa Erythropoietin Stimulating Agents Industry Volume (K Unit), by Application 2025 & 2033
- Figure 201: South Africa Erythropoietin Stimulating Agents Industry Revenue Share (%), by Application 2025 & 2033
- Figure 202: South Africa Erythropoietin Stimulating Agents Industry Volume Share (%), by Application 2025 & 2033
- Figure 203: South Africa Erythropoietin Stimulating Agents Industry Revenue (billion), by Country 2025 & 2033
- Figure 204: South Africa Erythropoietin Stimulating Agents Industry Volume (K Unit), by Country 2025 & 2033
- Figure 205: South Africa Erythropoietin Stimulating Agents Industry Revenue Share (%), by Country 2025 & 2033
- Figure 206: South Africa Erythropoietin Stimulating Agents Industry Volume Share (%), by Country 2025 & 2033
- Figure 207: Rest of Middle East and Africa Erythropoietin Stimulating Agents Industry Revenue (billion), by Type 2025 & 2033
- Figure 208: Rest of Middle East and Africa Erythropoietin Stimulating Agents Industry Volume (K Unit), by Type 2025 & 2033
- Figure 209: Rest of Middle East and Africa Erythropoietin Stimulating Agents Industry Revenue Share (%), by Type 2025 & 2033
- Figure 210: Rest of Middle East and Africa Erythropoietin Stimulating Agents Industry Volume Share (%), by Type 2025 & 2033
- Figure 211: Rest of Middle East and Africa Erythropoietin Stimulating Agents Industry Revenue (billion), by Application 2025 & 2033
- Figure 212: Rest of Middle East and Africa Erythropoietin Stimulating Agents Industry Volume (K Unit), by Application 2025 & 2033
- Figure 213: Rest of Middle East and Africa Erythropoietin Stimulating Agents Industry Revenue Share (%), by Application 2025 & 2033
- Figure 214: Rest of Middle East and Africa Erythropoietin Stimulating Agents Industry Volume Share (%), by Application 2025 & 2033
- Figure 215: Rest of Middle East and Africa Erythropoietin Stimulating Agents Industry Revenue (billion), by Country 2025 & 2033
- Figure 216: Rest of Middle East and Africa Erythropoietin Stimulating Agents Industry Volume (K Unit), by Country 2025 & 2033
- Figure 217: Rest of Middle East and Africa Erythropoietin Stimulating Agents Industry Revenue Share (%), by Country 2025 & 2033
- Figure 218: Rest of Middle East and Africa Erythropoietin Stimulating Agents Industry Volume Share (%), by Country 2025 & 2033
- Figure 219: South America Erythropoietin Stimulating Agents Industry Revenue (billion), by Type 2025 & 2033
- Figure 220: South America Erythropoietin Stimulating Agents Industry Volume (K Unit), by Type 2025 & 2033
- Figure 221: South America Erythropoietin Stimulating Agents Industry Revenue Share (%), by Type 2025 & 2033
- Figure 222: South America Erythropoietin Stimulating Agents Industry Volume Share (%), by Type 2025 & 2033
- Figure 223: South America Erythropoietin Stimulating Agents Industry Revenue (billion), by Application 2025 & 2033
- Figure 224: South America Erythropoietin Stimulating Agents Industry Volume (K Unit), by Application 2025 & 2033
- Figure 225: South America Erythropoietin Stimulating Agents Industry Revenue Share (%), by Application 2025 & 2033
- Figure 226: South America Erythropoietin Stimulating Agents Industry Volume Share (%), by Application 2025 & 2033
- Figure 227: South America Erythropoietin Stimulating Agents Industry Revenue (billion), by Country 2025 & 2033
- Figure 228: South America Erythropoietin Stimulating Agents Industry Volume (K Unit), by Country 2025 & 2033
- Figure 229: South America Erythropoietin Stimulating Agents Industry Revenue Share (%), by Country 2025 & 2033
- Figure 230: South America Erythropoietin Stimulating Agents Industry Volume Share (%), by Country 2025 & 2033
- Figure 231: Argentina Erythropoietin Stimulating Agents Industry Revenue (billion), by Type 2025 & 2033
- Figure 232: Argentina Erythropoietin Stimulating Agents Industry Volume (K Unit), by Type 2025 & 2033
- Figure 233: Argentina Erythropoietin Stimulating Agents Industry Revenue Share (%), by Type 2025 & 2033
- Figure 234: Argentina Erythropoietin Stimulating Agents Industry Volume Share (%), by Type 2025 & 2033
- Figure 235: Argentina Erythropoietin Stimulating Agents Industry Revenue (billion), by Application 2025 & 2033
- Figure 236: Argentina Erythropoietin Stimulating Agents Industry Volume (K Unit), by Application 2025 & 2033
- Figure 237: Argentina Erythropoietin Stimulating Agents Industry Revenue Share (%), by Application 2025 & 2033
- Figure 238: Argentina Erythropoietin Stimulating Agents Industry Volume Share (%), by Application 2025 & 2033
- Figure 239: Argentina Erythropoietin Stimulating Agents Industry Revenue (billion), by Country 2025 & 2033
- Figure 240: Argentina Erythropoietin Stimulating Agents Industry Volume (K Unit), by Country 2025 & 2033
- Figure 241: Argentina Erythropoietin Stimulating Agents Industry Revenue Share (%), by Country 2025 & 2033
- Figure 242: Argentina Erythropoietin Stimulating Agents Industry Volume Share (%), by Country 2025 & 2033
- Figure 243: Rest of South America Erythropoietin Stimulating Agents Industry Revenue (billion), by Type 2025 & 2033
- Figure 244: Rest of South America Erythropoietin Stimulating Agents Industry Volume (K Unit), by Type 2025 & 2033
- Figure 245: Rest of South America Erythropoietin Stimulating Agents Industry Revenue Share (%), by Type 2025 & 2033
- Figure 246: Rest of South America Erythropoietin Stimulating Agents Industry Volume Share (%), by Type 2025 & 2033
- Figure 247: Rest of South America Erythropoietin Stimulating Agents Industry Revenue (billion), by Application 2025 & 2033
- Figure 248: Rest of South America Erythropoietin Stimulating Agents Industry Volume (K Unit), by Application 2025 & 2033
- Figure 249: Rest of South America Erythropoietin Stimulating Agents Industry Revenue Share (%), by Application 2025 & 2033
- Figure 250: Rest of South America Erythropoietin Stimulating Agents Industry Volume Share (%), by Application 2025 & 2033
- Figure 251: Rest of South America Erythropoietin Stimulating Agents Industry Revenue (billion), by Country 2025 & 2033
- Figure 252: Rest of South America Erythropoietin Stimulating Agents Industry Volume (K Unit), by Country 2025 & 2033
- Figure 253: Rest of South America Erythropoietin Stimulating Agents Industry Revenue Share (%), by Country 2025 & 2033
- Figure 254: Rest of South America Erythropoietin Stimulating Agents Industry Volume Share (%), by Country 2025 & 2033
List of Tables
- Table 1: Global Erythropoietin Stimulating Agents Industry Revenue billion Forecast, by Type 2020 & 2033
- Table 2: Global Erythropoietin Stimulating Agents Industry Volume K Unit Forecast, by Type 2020 & 2033
- Table 3: Global Erythropoietin Stimulating Agents Industry Revenue billion Forecast, by Application 2020 & 2033
- Table 4: Global Erythropoietin Stimulating Agents Industry Volume K Unit Forecast, by Application 2020 & 2033
- Table 5: Global Erythropoietin Stimulating Agents Industry Revenue billion Forecast, by Region 2020 & 2033
- Table 6: Global Erythropoietin Stimulating Agents Industry Volume K Unit Forecast, by Region 2020 & 2033
- Table 7: Global Erythropoietin Stimulating Agents Industry Revenue billion Forecast, by Type 2020 & 2033
- Table 8: Global Erythropoietin Stimulating Agents Industry Volume K Unit Forecast, by Type 2020 & 2033
- Table 9: Global Erythropoietin Stimulating Agents Industry Revenue billion Forecast, by Application 2020 & 2033
- Table 10: Global Erythropoietin Stimulating Agents Industry Volume K Unit Forecast, by Application 2020 & 2033
- Table 11: Global Erythropoietin Stimulating Agents Industry Revenue billion Forecast, by Country 2020 & 2033
- Table 12: Global Erythropoietin Stimulating Agents Industry Volume K Unit Forecast, by Country 2020 & 2033
- Table 13: United States Erythropoietin Stimulating Agents Industry Revenue (billion) Forecast, by Application 2020 & 2033
- Table 14: United States Erythropoietin Stimulating Agents Industry Volume (K Unit) Forecast, by Application 2020 & 2033
- Table 15: Global Erythropoietin Stimulating Agents Industry Revenue billion Forecast, by Type 2020 & 2033
- Table 16: Global Erythropoietin Stimulating Agents Industry Volume K Unit Forecast, by Type 2020 & 2033
- Table 17: Global Erythropoietin Stimulating Agents Industry Revenue billion Forecast, by Application 2020 & 2033
- Table 18: Global Erythropoietin Stimulating Agents Industry Volume K Unit Forecast, by Application 2020 & 2033
- Table 19: Global Erythropoietin Stimulating Agents Industry Revenue billion Forecast, by Country 2020 & 2033
- Table 20: Global Erythropoietin Stimulating Agents Industry Volume K Unit Forecast, by Country 2020 & 2033
- Table 21: Global Erythropoietin Stimulating Agents Industry Revenue billion Forecast, by Type 2020 & 2033
- Table 22: Global Erythropoietin Stimulating Agents Industry Volume K Unit Forecast, by Type 2020 & 2033
- Table 23: Global Erythropoietin Stimulating Agents Industry Revenue billion Forecast, by Application 2020 & 2033
- Table 24: Global Erythropoietin Stimulating Agents Industry Volume K Unit Forecast, by Application 2020 & 2033
- Table 25: Global Erythropoietin Stimulating Agents Industry Revenue billion Forecast, by Country 2020 & 2033
- Table 26: Global Erythropoietin Stimulating Agents Industry Volume K Unit Forecast, by Country 2020 & 2033
- Table 27: Global Erythropoietin Stimulating Agents Industry Revenue billion Forecast, by Type 2020 & 2033
- Table 28: Global Erythropoietin Stimulating Agents Industry Volume K Unit Forecast, by Type 2020 & 2033
- Table 29: Global Erythropoietin Stimulating Agents Industry Revenue billion Forecast, by Application 2020 & 2033
- Table 30: Global Erythropoietin Stimulating Agents Industry Volume K Unit Forecast, by Application 2020 & 2033
- Table 31: Global Erythropoietin Stimulating Agents Industry Revenue billion Forecast, by Country 2020 & 2033
- Table 32: Global Erythropoietin Stimulating Agents Industry Volume K Unit Forecast, by Country 2020 & 2033
- Table 33: Germany Erythropoietin Stimulating Agents Industry Revenue (billion) Forecast, by Application 2020 & 2033
- Table 34: Germany Erythropoietin Stimulating Agents Industry Volume (K Unit) Forecast, by Application 2020 & 2033
- Table 35: Global Erythropoietin Stimulating Agents Industry Revenue billion Forecast, by Type 2020 & 2033
- Table 36: Global Erythropoietin Stimulating Agents Industry Volume K Unit Forecast, by Type 2020 & 2033
- Table 37: Global Erythropoietin Stimulating Agents Industry Revenue billion Forecast, by Application 2020 & 2033
- Table 38: Global Erythropoietin Stimulating Agents Industry Volume K Unit Forecast, by Application 2020 & 2033
- Table 39: Global Erythropoietin Stimulating Agents Industry Revenue billion Forecast, by Country 2020 & 2033
- Table 40: Global Erythropoietin Stimulating Agents Industry Volume K Unit Forecast, by Country 2020 & 2033
- Table 41: Global Erythropoietin Stimulating Agents Industry Revenue billion Forecast, by Type 2020 & 2033
- Table 42: Global Erythropoietin Stimulating Agents Industry Volume K Unit Forecast, by Type 2020 & 2033
- Table 43: Global Erythropoietin Stimulating Agents Industry Revenue billion Forecast, by Application 2020 & 2033
- Table 44: Global Erythropoietin Stimulating Agents Industry Volume K Unit Forecast, by Application 2020 & 2033
- Table 45: Global Erythropoietin Stimulating Agents Industry Revenue billion Forecast, by Country 2020 & 2033
- Table 46: Global Erythropoietin Stimulating Agents Industry Volume K Unit Forecast, by Country 2020 & 2033
- Table 47: Global Erythropoietin Stimulating Agents Industry Revenue billion Forecast, by Type 2020 & 2033
- Table 48: Global Erythropoietin Stimulating Agents Industry Volume K Unit Forecast, by Type 2020 & 2033
- Table 49: Global Erythropoietin Stimulating Agents Industry Revenue billion Forecast, by Application 2020 & 2033
- Table 50: Global Erythropoietin Stimulating Agents Industry Volume K Unit Forecast, by Application 2020 & 2033
- Table 51: Global Erythropoietin Stimulating Agents Industry Revenue billion Forecast, by Country 2020 & 2033
- Table 52: Global Erythropoietin Stimulating Agents Industry Volume K Unit Forecast, by Country 2020 & 2033
- Table 53: Global Erythropoietin Stimulating Agents Industry Revenue billion Forecast, by Type 2020 & 2033
- Table 54: Global Erythropoietin Stimulating Agents Industry Volume K Unit Forecast, by Type 2020 & 2033
- Table 55: Global Erythropoietin Stimulating Agents Industry Revenue billion Forecast, by Application 2020 & 2033
- Table 56: Global Erythropoietin Stimulating Agents Industry Volume K Unit Forecast, by Application 2020 & 2033
- Table 57: Global Erythropoietin Stimulating Agents Industry Revenue billion Forecast, by Country 2020 & 2033
- Table 58: Global Erythropoietin Stimulating Agents Industry Volume K Unit Forecast, by Country 2020 & 2033
- Table 59: Global Erythropoietin Stimulating Agents Industry Revenue billion Forecast, by Type 2020 & 2033
- Table 60: Global Erythropoietin Stimulating Agents Industry Volume K Unit Forecast, by Type 2020 & 2033
- Table 61: Global Erythropoietin Stimulating Agents Industry Revenue billion Forecast, by Application 2020 & 2033
- Table 62: Global Erythropoietin Stimulating Agents Industry Volume K Unit Forecast, by Application 2020 & 2033
- Table 63: Global Erythropoietin Stimulating Agents Industry Revenue billion Forecast, by Country 2020 & 2033
- Table 64: Global Erythropoietin Stimulating Agents Industry Volume K Unit Forecast, by Country 2020 & 2033
- Table 65: Global Erythropoietin Stimulating Agents Industry Revenue billion Forecast, by Type 2020 & 2033
- Table 66: Global Erythropoietin Stimulating Agents Industry Volume K Unit Forecast, by Type 2020 & 2033
- Table 67: Global Erythropoietin Stimulating Agents Industry Revenue billion Forecast, by Application 2020 & 2033
- Table 68: Global Erythropoietin Stimulating Agents Industry Volume K Unit Forecast, by Application 2020 & 2033
- Table 69: Global Erythropoietin Stimulating Agents Industry Revenue billion Forecast, by Country 2020 & 2033
- Table 70: Global Erythropoietin Stimulating Agents Industry Volume K Unit Forecast, by Country 2020 & 2033
- Table 71: China Erythropoietin Stimulating Agents Industry Revenue (billion) Forecast, by Application 2020 & 2033
- Table 72: China Erythropoietin Stimulating Agents Industry Volume (K Unit) Forecast, by Application 2020 & 2033
- Table 73: Global Erythropoietin Stimulating Agents Industry Revenue billion Forecast, by Type 2020 & 2033
- Table 74: Global Erythropoietin Stimulating Agents Industry Volume K Unit Forecast, by Type 2020 & 2033
- Table 75: Global Erythropoietin Stimulating Agents Industry Revenue billion Forecast, by Application 2020 & 2033
- Table 76: Global Erythropoietin Stimulating Agents Industry Volume K Unit Forecast, by Application 2020 & 2033
- Table 77: Global Erythropoietin Stimulating Agents Industry Revenue billion Forecast, by Country 2020 & 2033
- Table 78: Global Erythropoietin Stimulating Agents Industry Volume K Unit Forecast, by Country 2020 & 2033
- Table 79: Global Erythropoietin Stimulating Agents Industry Revenue billion Forecast, by Type 2020 & 2033
- Table 80: Global Erythropoietin Stimulating Agents Industry Volume K Unit Forecast, by Type 2020 & 2033
- Table 81: Global Erythropoietin Stimulating Agents Industry Revenue billion Forecast, by Application 2020 & 2033
- Table 82: Global Erythropoietin Stimulating Agents Industry Volume K Unit Forecast, by Application 2020 & 2033
- Table 83: Global Erythropoietin Stimulating Agents Industry Revenue billion Forecast, by Country 2020 & 2033
- Table 84: Global Erythropoietin Stimulating Agents Industry Volume K Unit Forecast, by Country 2020 & 2033
- Table 85: Global Erythropoietin Stimulating Agents Industry Revenue billion Forecast, by Type 2020 & 2033
- Table 86: Global Erythropoietin Stimulating Agents Industry Volume K Unit Forecast, by Type 2020 & 2033
- Table 87: Global Erythropoietin Stimulating Agents Industry Revenue billion Forecast, by Application 2020 & 2033
- Table 88: Global Erythropoietin Stimulating Agents Industry Volume K Unit Forecast, by Application 2020 & 2033
- Table 89: Global Erythropoietin Stimulating Agents Industry Revenue billion Forecast, by Country 2020 & 2033
- Table 90: Global Erythropoietin Stimulating Agents Industry Volume K Unit Forecast, by Country 2020 & 2033
- Table 91: Global Erythropoietin Stimulating Agents Industry Revenue billion Forecast, by Type 2020 & 2033
- Table 92: Global Erythropoietin Stimulating Agents Industry Volume K Unit Forecast, by Type 2020 & 2033
- Table 93: Global Erythropoietin Stimulating Agents Industry Revenue billion Forecast, by Application 2020 & 2033
- Table 94: Global Erythropoietin Stimulating Agents Industry Volume K Unit Forecast, by Application 2020 & 2033
- Table 95: Global Erythropoietin Stimulating Agents Industry Revenue billion Forecast, by Country 2020 & 2033
- Table 96: Global Erythropoietin Stimulating Agents Industry Volume K Unit Forecast, by Country 2020 & 2033
- Table 97: Global Erythropoietin Stimulating Agents Industry Revenue billion Forecast, by Type 2020 & 2033
- Table 98: Global Erythropoietin Stimulating Agents Industry Volume K Unit Forecast, by Type 2020 & 2033
- Table 99: Global Erythropoietin Stimulating Agents Industry Revenue billion Forecast, by Application 2020 & 2033
- Table 100: Global Erythropoietin Stimulating Agents Industry Volume K Unit Forecast, by Application 2020 & 2033
- Table 101: Global Erythropoietin Stimulating Agents Industry Revenue billion Forecast, by Country 2020 & 2033
- Table 102: Global Erythropoietin Stimulating Agents Industry Volume K Unit Forecast, by Country 2020 & 2033
- Table 103: Global Erythropoietin Stimulating Agents Industry Revenue billion Forecast, by Type 2020 & 2033
- Table 104: Global Erythropoietin Stimulating Agents Industry Volume K Unit Forecast, by Type 2020 & 2033
- Table 105: Global Erythropoietin Stimulating Agents Industry Revenue billion Forecast, by Application 2020 & 2033
- Table 106: Global Erythropoietin Stimulating Agents Industry Volume K Unit Forecast, by Application 2020 & 2033
- Table 107: Global Erythropoietin Stimulating Agents Industry Revenue billion Forecast, by Country 2020 & 2033
- Table 108: Global Erythropoietin Stimulating Agents Industry Volume K Unit Forecast, by Country 2020 & 2033
- Table 109: GCC Erythropoietin Stimulating Agents Industry Revenue (billion) Forecast, by Application 2020 & 2033
- Table 110: GCC Erythropoietin Stimulating Agents Industry Volume (K Unit) Forecast, by Application 2020 & 2033
- Table 111: Global Erythropoietin Stimulating Agents Industry Revenue billion Forecast, by Type 2020 & 2033
- Table 112: Global Erythropoietin Stimulating Agents Industry Volume K Unit Forecast, by Type 2020 & 2033
- Table 113: Global Erythropoietin Stimulating Agents Industry Revenue billion Forecast, by Application 2020 & 2033
- Table 114: Global Erythropoietin Stimulating Agents Industry Volume K Unit Forecast, by Application 2020 & 2033
- Table 115: Global Erythropoietin Stimulating Agents Industry Revenue billion Forecast, by Country 2020 & 2033
- Table 116: Global Erythropoietin Stimulating Agents Industry Volume K Unit Forecast, by Country 2020 & 2033
- Table 117: Global Erythropoietin Stimulating Agents Industry Revenue billion Forecast, by Type 2020 & 2033
- Table 118: Global Erythropoietin Stimulating Agents Industry Volume K Unit Forecast, by Type 2020 & 2033
- Table 119: Global Erythropoietin Stimulating Agents Industry Revenue billion Forecast, by Application 2020 & 2033
- Table 120: Global Erythropoietin Stimulating Agents Industry Volume K Unit Forecast, by Application 2020 & 2033
- Table 121: Global Erythropoietin Stimulating Agents Industry Revenue billion Forecast, by Country 2020 & 2033
- Table 122: Global Erythropoietin Stimulating Agents Industry Volume K Unit Forecast, by Country 2020 & 2033
- Table 123: Global Erythropoietin Stimulating Agents Industry Revenue billion Forecast, by Type 2020 & 2033
- Table 124: Global Erythropoietin Stimulating Agents Industry Volume K Unit Forecast, by Type 2020 & 2033
- Table 125: Global Erythropoietin Stimulating Agents Industry Revenue billion Forecast, by Application 2020 & 2033
- Table 126: Global Erythropoietin Stimulating Agents Industry Volume K Unit Forecast, by Application 2020 & 2033
- Table 127: Global Erythropoietin Stimulating Agents Industry Revenue billion Forecast, by Country 2020 & 2033
- Table 128: Global Erythropoietin Stimulating Agents Industry Volume K Unit Forecast, by Country 2020 & 2033
- Table 129: Brazil Erythropoietin Stimulating Agents Industry Revenue (billion) Forecast, by Application 2020 & 2033
- Table 130: Brazil Erythropoietin Stimulating Agents Industry Volume (K Unit) Forecast, by Application 2020 & 2033
- Table 131: Global Erythropoietin Stimulating Agents Industry Revenue billion Forecast, by Type 2020 & 2033
- Table 132: Global Erythropoietin Stimulating Agents Industry Volume K Unit Forecast, by Type 2020 & 2033
- Table 133: Global Erythropoietin Stimulating Agents Industry Revenue billion Forecast, by Application 2020 & 2033
- Table 134: Global Erythropoietin Stimulating Agents Industry Volume K Unit Forecast, by Application 2020 & 2033
- Table 135: Global Erythropoietin Stimulating Agents Industry Revenue billion Forecast, by Country 2020 & 2033
- Table 136: Global Erythropoietin Stimulating Agents Industry Volume K Unit Forecast, by Country 2020 & 2033
- Table 137: Global Erythropoietin Stimulating Agents Industry Revenue billion Forecast, by Type 2020 & 2033
- Table 138: Global Erythropoietin Stimulating Agents Industry Volume K Unit Forecast, by Type 2020 & 2033
- Table 139: Global Erythropoietin Stimulating Agents Industry Revenue billion Forecast, by Application 2020 & 2033
- Table 140: Global Erythropoietin Stimulating Agents Industry Volume K Unit Forecast, by Application 2020 & 2033
- Table 141: Global Erythropoietin Stimulating Agents Industry Revenue billion Forecast, by Country 2020 & 2033
- Table 142: Global Erythropoietin Stimulating Agents Industry Volume K Unit Forecast, by Country 2020 & 2033
Frequently Asked Questions
1. What is the projected Compound Annual Growth Rate (CAGR) of the Erythropoietin Stimulating Agents Industry?
The projected CAGR is approximately 12.06%.
2. Which companies are prominent players in the Erythropoietin Stimulating Agents Industry?
Key companies in the market include Celltrion Inc, Probiomed S A de C V, Amgen Inc, F Hoffmann-La Roche Ltd, LG Lifesciences Ltd, Johnson and Johnson, Nanogen Pharmaceutical Biotechnology, Ranbaxy Laboratories Ltd, Teva Pharmaceutical Industries Ltd, Panacea Biotec Ltd, Novartis AG(Sandoz), Sun Pharmaceutical Industries Ltd, BioSidus, Biocon Limited, Lupin Pharma, Thermo Fisher Scientific, Dr Reddy's Laboratories Ltd, Celon Laboratories Pvt Ltd, Intas Pharmaceuticals Ltd, Pfizer Inc.
3. What are the main segments of the Erythropoietin Stimulating Agents Industry?
The market segments include Type, Application.
4. Can you provide details about the market size?
The market size is estimated to be USD 10.55 billion as of 2022.
5. What are some drivers contributing to market growth?
Increasing Disease Burden of Anemia; Rising Applications in HIV Infections and End-stage Renal Disorder; Risks of Thrombosis. during Surgeries. and Pure Red Cell Aplasia.
6. What are the notable trends driving market growth?
Cancer Application Expected to Dominate the Market Over the Forecast Period.
7. Are there any restraints impacting market growth?
Stringent Regulatory Guidelines; Adverse Side Effects.
8. Can you provide examples of recent developments in the market?
N/A
9. What pricing options are available for accessing the report?
Pricing options include single-user, multi-user, and enterprise licenses priced at USD 4750, USD 5250, and USD 8750 respectively.
10. Is the market size provided in terms of value or volume?
The market size is provided in terms of value, measured in billion and volume, measured in K Unit.
11. Are there any specific market keywords associated with the report?
Yes, the market keyword associated with the report is "Erythropoietin Stimulating Agents Industry," which aids in identifying and referencing the specific market segment covered.
12. How do I determine which pricing option suits my needs best?
The pricing options vary based on user requirements and access needs. Individual users may opt for single-user licenses, while businesses requiring broader access may choose multi-user or enterprise licenses for cost-effective access to the report.
13. Are there any additional resources or data provided in the Erythropoietin Stimulating Agents Industry report?
While the report offers comprehensive insights, it's advisable to review the specific contents or supplementary materials provided to ascertain if additional resources or data are available.
14. How can I stay updated on further developments or reports in the Erythropoietin Stimulating Agents Industry?
To stay informed about further developments, trends, and reports in the Erythropoietin Stimulating Agents Industry, consider subscribing to industry newsletters, following relevant companies and organizations, or regularly checking reputable industry news sources and publications.
Methodology
Step 1 - Identification of Relevant Samples Size from Population Database


Step 2 - Approaches for Defining Global Market Size (Value, Volume* & Price*)

Note*: In applicable scenarios
Step 3 - Data Sources
Primary Research
- Web Analytics
- Survey Reports
- Research Institute
- Latest Research Reports
- Opinion Leaders
Secondary Research
- Annual Reports
- White Paper
- Latest Press Release
- Industry Association
- Paid Database
- Investor Presentations

Step 4 - Data Triangulation
Involves using different sources of information in order to increase the validity of a study
These sources are likely to be stakeholders in a program - participants, other researchers, program staff, other community members, and so on.
Then we put all data in single framework & apply various statistical tools to find out the dynamic on the market.
During the analysis stage, feedback from the stakeholder groups would be compared to determine areas of agreement as well as areas of divergence