

Key Insights
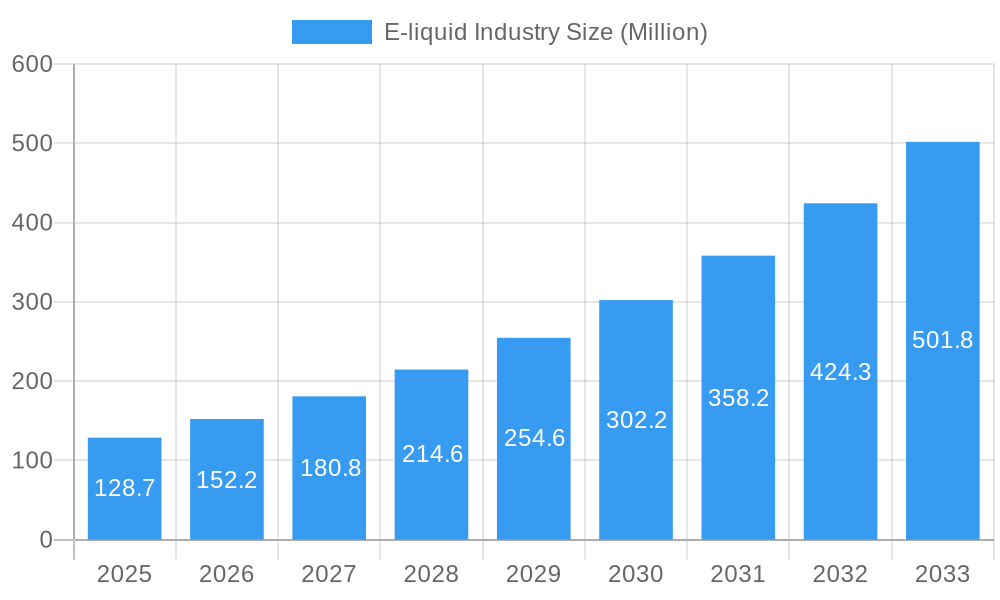
The e-liquid market, valued at $128.70 million in 2025, is projected to experience robust growth, driven by the increasing popularity of vaping and e-cigarettes as alternatives to traditional smoking. The Compound Annual Growth Rate (CAGR) of 18.20% from 2025 to 2033 indicates a significant expansion, fueled by factors such as diverse product offerings (e-cigarette devices and e-liquids), evolving consumer preferences towards customizable vaping experiences, and the expanding distribution channels encompassing both online and offline retail. Technological advancements in e-liquid formulations, including the introduction of innovative flavors and nicotine delivery systems, further contribute to market expansion. However, regulatory uncertainties and evolving public health concerns regarding the long-term effects of vaping pose potential restraints on market growth. The market is segmented by product type (e-cigarette devices and e-liquids) and distribution channel (online and offline), with online channels gaining prominence due to convenience and wider product availability. Key players like RITCHY GROUP, Innokin Technology, and Philip Morris International Inc. are shaping the market through innovation, brand building, and strategic acquisitions. Geographic expansion across North America, Europe, Asia Pacific, South America, and the Middle East & Africa contributes to the overall market dynamism. The diverse range of products, coupled with ongoing innovation and a growing customer base, points towards a sustained trajectory of growth in the coming years. However, responsible marketing practices and stringent adherence to regulatory frameworks are essential to mitigating potential risks and ensuring the sustainable development of this evolving industry.

E-liquid Industry Market Size (In Million)
The significant growth in the e-liquid market is expected to continue, with substantial regional variations. North America and Europe, with established vaping cultures and substantial regulatory frameworks, are anticipated to retain significant market share. However, the Asia Pacific region, particularly China and Southeast Asia, presents a significant growth opportunity due to the expanding consumer base and increasing disposable income. The strategic initiatives of leading companies, focusing on product differentiation, expansion into new markets, and technological innovation, are instrumental in driving market growth. The competitive landscape is characterized by a mix of established players and emerging brands, resulting in intense competition and continuous product innovation. Further market segmentation by flavor profiles (fruit, menthol, tobacco, etc.) and nicotine strength will provide more granular insights into consumer preferences and guide manufacturers in their product development strategies. Ultimately, the e-liquid market’s future trajectory will be significantly influenced by the interplay of consumer demand, technological advancements, and evolving regulatory landscapes.
E-liquid Industry Company Market Share
E-liquid Industry: A Comprehensive Market Report (2019-2033)
This insightful report provides a detailed analysis of the global e-liquid industry, encompassing market trends, leading players, and future growth prospects. With a study period spanning 2019-2033, a base year of 2025, and a forecast period of 2025-2033, this report is an invaluable resource for stakeholders seeking to understand and capitalize on the dynamic opportunities within this rapidly evolving sector. The market is projected to reach xx Million by 2033.
E-liquid Industry Market Composition & Trends
This section offers a comprehensive examination of the e-liquid industry's competitive dynamics. It delves into market concentration, identifies key innovation drivers, analyzes the prevailing regulatory frameworks, assesses the impact of substitute products, profiles diverse end-user demographics, and quantifies merger & acquisition (M&A) activities. We dissect the market share distribution among prominent players, including RITCHY GROUP, Innokin Technology, Philip Morris International Inc, Joyetech Group, Ecigs Solutions Ltd, Intellicig Inc, Aspire, KangerTech, British American Tobacco, and VIP Electronic Cigarettes. The report meticulously quantifies the value of significant M&A deals, providing valuable insights into industry consolidation. Furthermore, it explores the profound influence of evolving regulations on market dynamics and pinpoints the critical innovation catalysts that are propelling product development and market expansion. The analysis also thoughtfully considers the impact of substitute products, such as traditional tobacco, and provides detailed profiles of the key end-users who are driving demand within this dynamic market.
- Market Concentration: The e-liquid market demonstrates a highly competitive structure, with the top five players collectively holding approximately 65% of the market share in 2024. This indicates a substantial presence of leading brands, but also room for agile smaller players to carve out niches.
- Innovation Catalysts: Key innovation drivers include rapid technological advancements in vaping hardware (e.g., improved coil technology, temperature control, longer battery life), the sophisticated development of diverse and appealing flavor profiles, and the evolution of nicotine delivery systems (e.g., salt nicotine, customizable nicotine levels) to enhance user experience and satisfaction.
- Regulatory Landscape: The e-liquid market is significantly shaped by a complex and often fragmented regulatory landscape across different jurisdictions. Varying regulations concerning ingredient disclosure, marketing restrictions, product standards, and age verification profoundly influence market access, growth potential, and consumer trust.
- Substitute Products: Traditional combustible cigarettes remain the primary substitute product, posing a significant competitive challenge. Other nicotine delivery systems, such as nicotine pouches and heated tobacco products, also represent emerging substitutes that could impact the e-liquid market's share.
- End-User Profiles: The primary end-users are adult smokers seeking effective harm reduction alternatives to traditional cigarettes, attracted by perceived health benefits and a wider range of flavors. A growing segment of younger adult consumers, however, is experimenting with vaping products, presenting both opportunities and regulatory challenges for the industry.
- M&A Activity: The past five years have witnessed a significant surge in M&A activity, driven by market consolidation and the desire of larger entities to acquire innovative technologies and expand their market reach. Total deal values have reached approximately USD 5 Billion, reflecting strategic investments and acquisitions within the sector.
E-liquid Industry Industry Evolution
This section provides a comprehensive analysis of the e-liquid industry's growth trajectory, technological progress, and evolving consumer preferences from 2019 to 2024. We examine market growth rates, adoption metrics, and technological advancements shaping the industry. The analysis includes detailed data points on market growth rates, adoption trends, technological breakthroughs (e.g., advancements in e-liquid formulations, battery technology, and device design), and evolving consumer preferences and demographics.
Leading Regions, Countries, or Segments in E-liquid Industry
This section identifies the foremost regions, countries, and market segments within the global e-liquid industry. We conduct a detailed analysis of the leading segments by product type, categorizing them into E-cigarette Devices and E-liquid Devices, and by distribution channel, distinguishing between Offline Channels and Online Channels. Key drivers behind the dominance of these segments are thoroughly examined, considering influential factors such as investment trends, supportive regulatory environments, and established market access.
- Dominant Region: North America currently holds the largest market share, largely due to its high consumer adoption rates of vaping products as an alternative to smoking, coupled with a comparatively more established, though evolving, regulatory environment that has facilitated market entry for many brands.
- Dominant Country: The United States accounts for a substantial portion of the global e-liquid market. This dominance is driven by a large and diverse consumer base actively seeking smoking alternatives, alongside well-developed and extensive retail and online distribution networks that ensure widespread product availability.
- Dominant Segment (Product Type): E-cigarette Devices (including pod systems, mods, and disposables) enjoy a larger market share. This is primarily attributed to wider consumer preference for all-in-one solutions, higher market penetration of reusable and disposable vaping hardware, and the continuous introduction of innovative device features.
- Dominant Segment (Distribution Channel): The Online Channel is experiencing exceptionally rapid growth. This surge is propelled by increasing consumer convenience, direct-to-consumer marketing strategies that foster brand loyalty, and the ability of online retailers to offer a wider selection of products and competitive pricing, circumventing some traditional retail barriers.
E-liquid Industry Product Innovations
This section highlights recent innovations in e-liquid products, including advancements in flavor technology, nicotine delivery systems, and device design. We examine unique selling propositions and technological advancements that are shaping consumer preferences and market competition. This includes innovations in disposable devices, pod systems, and advanced e-liquids with improved formulations and flavors. The focus is on how these innovations are impacting user experience, safety, and market share.
Propelling Factors for E-liquid Industry Growth
This section illuminates the core factors fueling the expansion of the e-liquid industry. We undertake a thorough analysis of technological advancements, economic influences such as disposable income levels and consumer spending patterns, and the dynamic evolution of regulatory landscapes. Specifically, we examine how the legalization or deregulation of e-cigarettes in certain regions directly impacts market accessibility and contributes to overall market expansion.
Obstacles in the E-liquid Industry Market
This section outlines the primary challenges and restraints affecting the e-liquid industry. We examine regulatory hurdles, supply chain disruptions (e.g., shortages of raw materials or manufacturing capacity constraints), and intense competition among various e-liquid manufacturers impacting market growth. We quantify the impacts of these obstacles with specific data points, if available.
Future Opportunities in E-liquid Industry
This section identifies emerging opportunities within the e-liquid market, such as expanding into new geographic markets, developing innovative product offerings (e.g., heated tobacco products or advanced nicotine delivery systems), and catering to evolving consumer preferences. This exploration focuses on identifying the potential for growth and how industry stakeholders can capitalize on emerging trends.
Major Players in the E-liquid Industry Ecosystem
- RITCHY GROUP
- Innokin Technology
- Philip Morris International Inc
- Joyetech Group
- Ecigs Solutions Ltd
- Intellicig Inc
- Aspire
- KangerTech
- British American Tobacco
- VIP Electronic Cigarettes
Key Developments in E-liquid Industry Industry
- April 2022: RELX International's success in Egypt highlights expanding global markets.
- November 2019: Dubai's legalization of e-cigarette trading signifies growing acceptance in the Middle East.
- September 2019: Dubai's new regulations for electronic cigarettes establish clearer standards and health warnings.
Strategic E-liquid Industry Market Forecast
This section provides a concise overview of the pivotal growth drivers and the anticipated market potential for the e-liquid industry over the comprehensive forecast period spanning from 2025 to 2033. It meticulously highlights emerging opportunities and forecasts the trajectory of market expansion, while also prudently considering potential risks and inherent uncertainties. The analysis underscores the robust long-term growth potential of the e-liquid market, taking into account the continuous evolution of consumer preferences, ongoing technological breakthroughs, and the dynamic nature of global regulatory environments.
E-liquid Industry Segmentation
-
1. Product Type
- 1.1. E-cigarette Devices
- 1.2. E-liquid Devices
-
2. Distribution Channel
- 2.1. Offline Channel
- 2.2. Online Channel
-
3. Geography
- 3.1. South Africa
- 3.2. Nigeria
- 3.3. Kenya
- 3.4. Ghana
- 3.5. United Arab Emirates
- 3.6. Egypt
- 3.7. Rest of Middle East & Africa
E-liquid Industry Segmentation By Geography
- 1. South Africa
- 2. Nigeria
- 3. Kenya
- 4. Ghana
- 5. United Arab Emirates
- 6. Egypt
- 7. Rest of Middle East

E-liquid Industry Regional Market Share
Geographic Coverage of E-liquid Industry
E-liquid Industry REPORT HIGHLIGHTS
| Aspects | Details |
|---|---|
| Study Period | 2020-2034 |
| Base Year | 2025 |
| Estimated Year | 2026 |
| Forecast Period | 2026-2034 |
| Historical Period | 2020-2025 |
| Growth Rate | CAGR of 18.20% from 2020-2034 |
| Segmentation |
|
Table of Contents
- 1. Introduction
- 1.1. Research Scope
- 1.2. Market Segmentation
- 1.3. Research Objective
- 1.4. Definitions and Assumptions
- 2. Executive Summary
- 2.1. Market Snapshot
- 3. Market Dynamics
- 3.1. Market Drivers
- 3.2. Market Restrains
- 3.3. Market Trends
- 3.4. Market Opportunities
- 4. Market Factor Analysis
- 4.1. Porters Five Forces
- 4.1.1. Bargaining Power of Suppliers
- 4.1.2. Bargaining Power of Buyers
- 4.1.3. Threat of New Entrants
- 4.1.4. Threat of Substitutes
- 4.1.5. Competitive Rivalry
- 4.2. PESTEL analysis
- 4.3. BCG Analysis
- 4.3.1. Stars (High Growth, High Market Share)
- 4.3.2. Cash Cows (Low Growth, High Market Share)
- 4.3.3. Question Mark (High Growth, Low Market Share)
- 4.3.4. Dogs (Low Growth, Low Market Share)
- 4.4. Ansoff Matrix Analysis
- 4.5. Supply Chain Analysis
- 4.6. Regulatory Landscape
- 4.7. Current Market Potential and Opportunity Assessment (TAM–SAM–SOM Framework)
- 4.8. DMV Analyst Note
- 4.1. Porters Five Forces
- 5. Market Analysis, Insights and Forecast 2021-2033
- 5.1. Market Analysis, Insights and Forecast - by Product Type
- 5.1.1. E-cigarette Devices
- 5.1.2. E-liquid Devices
- 5.2. Market Analysis, Insights and Forecast - by Distribution Channel
- 5.2.1. Offline Channel
- 5.2.2. Online Channel
- 5.3. Market Analysis, Insights and Forecast - by Geography
- 5.3.1. South Africa
- 5.3.2. Nigeria
- 5.3.3. Kenya
- 5.3.4. Ghana
- 5.3.5. United Arab Emirates
- 5.3.6. Egypt
- 5.3.7. Rest of Middle East & Africa
- 5.4. Market Analysis, Insights and Forecast - by Region
- 5.4.1. South Africa
- 5.4.2. Nigeria
- 5.4.3. Kenya
- 5.4.4. Ghana
- 5.4.5. United Arab Emirates
- 5.4.6. Egypt
- 5.4.7. Rest of Middle East
- 5.1. Market Analysis, Insights and Forecast - by Product Type
- 6. Global E-liquid Industry Analysis, Insights and Forecast, 2021-2033
- 6.1. Market Analysis, Insights and Forecast - by Product Type
- 6.1.1. E-cigarette Devices
- 6.1.2. E-liquid Devices
- 6.2. Market Analysis, Insights and Forecast - by Distribution Channel
- 6.2.1. Offline Channel
- 6.2.2. Online Channel
- 6.3. Market Analysis, Insights and Forecast - by Geography
- 6.3.1. South Africa
- 6.3.2. Nigeria
- 6.3.3. Kenya
- 6.3.4. Ghana
- 6.3.5. United Arab Emirates
- 6.3.6. Egypt
- 6.3.7. Rest of Middle East & Africa
- 6.1. Market Analysis, Insights and Forecast - by Product Type
- 7. South Africa E-liquid Industry Analysis, Insights and Forecast, 2020-2032
- 7.1. Market Analysis, Insights and Forecast - by Product Type
- 7.1.1. E-cigarette Devices
- 7.1.2. E-liquid Devices
- 7.2. Market Analysis, Insights and Forecast - by Distribution Channel
- 7.2.1. Offline Channel
- 7.2.2. Online Channel
- 7.3. Market Analysis, Insights and Forecast - by Geography
- 7.3.1. South Africa
- 7.3.2. Nigeria
- 7.3.3. Kenya
- 7.3.4. Ghana
- 7.3.5. United Arab Emirates
- 7.3.6. Egypt
- 7.3.7. Rest of Middle East & Africa
- 7.1. Market Analysis, Insights and Forecast - by Product Type
- 8. Nigeria E-liquid Industry Analysis, Insights and Forecast, 2020-2032
- 8.1. Market Analysis, Insights and Forecast - by Product Type
- 8.1.1. E-cigarette Devices
- 8.1.2. E-liquid Devices
- 8.2. Market Analysis, Insights and Forecast - by Distribution Channel
- 8.2.1. Offline Channel
- 8.2.2. Online Channel
- 8.3. Market Analysis, Insights and Forecast - by Geography
- 8.3.1. South Africa
- 8.3.2. Nigeria
- 8.3.3. Kenya
- 8.3.4. Ghana
- 8.3.5. United Arab Emirates
- 8.3.6. Egypt
- 8.3.7. Rest of Middle East & Africa
- 8.1. Market Analysis, Insights and Forecast - by Product Type
- 9. Kenya E-liquid Industry Analysis, Insights and Forecast, 2020-2032
- 9.1. Market Analysis, Insights and Forecast - by Product Type
- 9.1.1. E-cigarette Devices
- 9.1.2. E-liquid Devices
- 9.2. Market Analysis, Insights and Forecast - by Distribution Channel
- 9.2.1. Offline Channel
- 9.2.2. Online Channel
- 9.3. Market Analysis, Insights and Forecast - by Geography
- 9.3.1. South Africa
- 9.3.2. Nigeria
- 9.3.3. Kenya
- 9.3.4. Ghana
- 9.3.5. United Arab Emirates
- 9.3.6. Egypt
- 9.3.7. Rest of Middle East & Africa
- 9.1. Market Analysis, Insights and Forecast - by Product Type
- 10. Ghana E-liquid Industry Analysis, Insights and Forecast, 2020-2032
- 10.1. Market Analysis, Insights and Forecast - by Product Type
- 10.1.1. E-cigarette Devices
- 10.1.2. E-liquid Devices
- 10.2. Market Analysis, Insights and Forecast - by Distribution Channel
- 10.2.1. Offline Channel
- 10.2.2. Online Channel
- 10.3. Market Analysis, Insights and Forecast - by Geography
- 10.3.1. South Africa
- 10.3.2. Nigeria
- 10.3.3. Kenya
- 10.3.4. Ghana
- 10.3.5. United Arab Emirates
- 10.3.6. Egypt
- 10.3.7. Rest of Middle East & Africa
- 10.1. Market Analysis, Insights and Forecast - by Product Type
- 11. United Arab Emirates E-liquid Industry Analysis, Insights and Forecast, 2020-2032
- 11.1. Market Analysis, Insights and Forecast - by Product Type
- 11.1.1. E-cigarette Devices
- 11.1.2. E-liquid Devices
- 11.2. Market Analysis, Insights and Forecast - by Distribution Channel
- 11.2.1. Offline Channel
- 11.2.2. Online Channel
- 11.3. Market Analysis, Insights and Forecast - by Geography
- 11.3.1. South Africa
- 11.3.2. Nigeria
- 11.3.3. Kenya
- 11.3.4. Ghana
- 11.3.5. United Arab Emirates
- 11.3.6. Egypt
- 11.3.7. Rest of Middle East & Africa
- 11.1. Market Analysis, Insights and Forecast - by Product Type
- 12. Egypt E-liquid Industry Analysis, Insights and Forecast, 2020-2032
- 12.1. Market Analysis, Insights and Forecast - by Product Type
- 12.1.1. E-cigarette Devices
- 12.1.2. E-liquid Devices
- 12.2. Market Analysis, Insights and Forecast - by Distribution Channel
- 12.2.1. Offline Channel
- 12.2.2. Online Channel
- 12.3. Market Analysis, Insights and Forecast - by Geography
- 12.3.1. South Africa
- 12.3.2. Nigeria
- 12.3.3. Kenya
- 12.3.4. Ghana
- 12.3.5. United Arab Emirates
- 12.3.6. Egypt
- 12.3.7. Rest of Middle East & Africa
- 12.1. Market Analysis, Insights and Forecast - by Product Type
- 13. Rest of Middle East E-liquid Industry Analysis, Insights and Forecast, 2020-2032
- 13.1. Market Analysis, Insights and Forecast - by Product Type
- 13.1.1. E-cigarette Devices
- 13.1.2. E-liquid Devices
- 13.2. Market Analysis, Insights and Forecast - by Distribution Channel
- 13.2.1. Offline Channel
- 13.2.2. Online Channel
- 13.3. Market Analysis, Insights and Forecast - by Geography
- 13.3.1. South Africa
- 13.3.2. Nigeria
- 13.3.3. Kenya
- 13.3.4. Ghana
- 13.3.5. United Arab Emirates
- 13.3.6. Egypt
- 13.3.7. Rest of Middle East & Africa
- 13.1. Market Analysis, Insights and Forecast - by Product Type
- 14. Competitive Analysis
- 14.1. Company Profiles
- 14.1.1 RITCHY GROUP
- 14.1.1.1. Company Overview
- 14.1.1.2. Products
- 14.1.1.3. Company Financials
- 14.1.1.4. SWOT Analysis
- 14.1.2 Innokin Technology
- 14.1.2.1. Company Overview
- 14.1.2.2. Products
- 14.1.2.3. Company Financials
- 14.1.2.4. SWOT Analysis
- 14.1.3 Philip Morris International Inc
- 14.1.3.1. Company Overview
- 14.1.3.2. Products
- 14.1.3.3. Company Financials
- 14.1.3.4. SWOT Analysis
- 14.1.4 Joyetech Group
- 14.1.4.1. Company Overview
- 14.1.4.2. Products
- 14.1.4.3. Company Financials
- 14.1.4.4. SWOT Analysis
- 14.1.5 Ecigs Solutions Ltd
- 14.1.5.1. Company Overview
- 14.1.5.2. Products
- 14.1.5.3. Company Financials
- 14.1.5.4. SWOT Analysis
- 14.1.6 Intellicig Inc
- 14.1.6.1. Company Overview
- 14.1.6.2. Products
- 14.1.6.3. Company Financials
- 14.1.6.4. SWOT Analysis
- 14.1.7 Aspire
- 14.1.7.1. Company Overview
- 14.1.7.2. Products
- 14.1.7.3. Company Financials
- 14.1.7.4. SWOT Analysis
- 14.1.8 KangerTech
- 14.1.8.1. Company Overview
- 14.1.8.2. Products
- 14.1.8.3. Company Financials
- 14.1.8.4. SWOT Analysis
- 14.1.9 British American Tobacco
- 14.1.9.1. Company Overview
- 14.1.9.2. Products
- 14.1.9.3. Company Financials
- 14.1.9.4. SWOT Analysis
- 14.1.10 VIP Electronic Cigarettes
- 14.1.10.1. Company Overview
- 14.1.10.2. Products
- 14.1.10.3. Company Financials
- 14.1.10.4. SWOT Analysis
- 14.1.1 RITCHY GROUP
- 14.2. Market Entropy
- 14.2.1 Company's Key Areas Served
- 14.2.2 Recent Developments
- 14.3. Company Market Share Analysis 2025
- 14.3.1 Top 5 Companies Market Share Analysis
- 14.3.2 Top 3 Companies Market Share Analysis
- 14.4. List of Potential Customers
- 15. Research Methodology
List of Figures
- Figure 1: Global E-liquid Industry Revenue Breakdown (Million, %) by Region 2025 & 2033
- Figure 2: South Africa E-liquid Industry Revenue (Million), by Product Type 2025 & 2033
- Figure 3: South Africa E-liquid Industry Revenue Share (%), by Product Type 2025 & 2033
- Figure 4: South Africa E-liquid Industry Revenue (Million), by Distribution Channel 2025 & 2033
- Figure 5: South Africa E-liquid Industry Revenue Share (%), by Distribution Channel 2025 & 2033
- Figure 6: South Africa E-liquid Industry Revenue (Million), by Geography 2025 & 2033
- Figure 7: South Africa E-liquid Industry Revenue Share (%), by Geography 2025 & 2033
- Figure 8: South Africa E-liquid Industry Revenue (Million), by Country 2025 & 2033
- Figure 9: South Africa E-liquid Industry Revenue Share (%), by Country 2025 & 2033
- Figure 10: Nigeria E-liquid Industry Revenue (Million), by Product Type 2025 & 2033
- Figure 11: Nigeria E-liquid Industry Revenue Share (%), by Product Type 2025 & 2033
- Figure 12: Nigeria E-liquid Industry Revenue (Million), by Distribution Channel 2025 & 2033
- Figure 13: Nigeria E-liquid Industry Revenue Share (%), by Distribution Channel 2025 & 2033
- Figure 14: Nigeria E-liquid Industry Revenue (Million), by Geography 2025 & 2033
- Figure 15: Nigeria E-liquid Industry Revenue Share (%), by Geography 2025 & 2033
- Figure 16: Nigeria E-liquid Industry Revenue (Million), by Country 2025 & 2033
- Figure 17: Nigeria E-liquid Industry Revenue Share (%), by Country 2025 & 2033
- Figure 18: Kenya E-liquid Industry Revenue (Million), by Product Type 2025 & 2033
- Figure 19: Kenya E-liquid Industry Revenue Share (%), by Product Type 2025 & 2033
- Figure 20: Kenya E-liquid Industry Revenue (Million), by Distribution Channel 2025 & 2033
- Figure 21: Kenya E-liquid Industry Revenue Share (%), by Distribution Channel 2025 & 2033
- Figure 22: Kenya E-liquid Industry Revenue (Million), by Geography 2025 & 2033
- Figure 23: Kenya E-liquid Industry Revenue Share (%), by Geography 2025 & 2033
- Figure 24: Kenya E-liquid Industry Revenue (Million), by Country 2025 & 2033
- Figure 25: Kenya E-liquid Industry Revenue Share (%), by Country 2025 & 2033
- Figure 26: Ghana E-liquid Industry Revenue (Million), by Product Type 2025 & 2033
- Figure 27: Ghana E-liquid Industry Revenue Share (%), by Product Type 2025 & 2033
- Figure 28: Ghana E-liquid Industry Revenue (Million), by Distribution Channel 2025 & 2033
- Figure 29: Ghana E-liquid Industry Revenue Share (%), by Distribution Channel 2025 & 2033
- Figure 30: Ghana E-liquid Industry Revenue (Million), by Geography 2025 & 2033
- Figure 31: Ghana E-liquid Industry Revenue Share (%), by Geography 2025 & 2033
- Figure 32: Ghana E-liquid Industry Revenue (Million), by Country 2025 & 2033
- Figure 33: Ghana E-liquid Industry Revenue Share (%), by Country 2025 & 2033
- Figure 34: United Arab Emirates E-liquid Industry Revenue (Million), by Product Type 2025 & 2033
- Figure 35: United Arab Emirates E-liquid Industry Revenue Share (%), by Product Type 2025 & 2033
- Figure 36: United Arab Emirates E-liquid Industry Revenue (Million), by Distribution Channel 2025 & 2033
- Figure 37: United Arab Emirates E-liquid Industry Revenue Share (%), by Distribution Channel 2025 & 2033
- Figure 38: United Arab Emirates E-liquid Industry Revenue (Million), by Geography 2025 & 2033
- Figure 39: United Arab Emirates E-liquid Industry Revenue Share (%), by Geography 2025 & 2033
- Figure 40: United Arab Emirates E-liquid Industry Revenue (Million), by Country 2025 & 2033
- Figure 41: United Arab Emirates E-liquid Industry Revenue Share (%), by Country 2025 & 2033
- Figure 42: Egypt E-liquid Industry Revenue (Million), by Product Type 2025 & 2033
- Figure 43: Egypt E-liquid Industry Revenue Share (%), by Product Type 2025 & 2033
- Figure 44: Egypt E-liquid Industry Revenue (Million), by Distribution Channel 2025 & 2033
- Figure 45: Egypt E-liquid Industry Revenue Share (%), by Distribution Channel 2025 & 2033
- Figure 46: Egypt E-liquid Industry Revenue (Million), by Geography 2025 & 2033
- Figure 47: Egypt E-liquid Industry Revenue Share (%), by Geography 2025 & 2033
- Figure 48: Egypt E-liquid Industry Revenue (Million), by Country 2025 & 2033
- Figure 49: Egypt E-liquid Industry Revenue Share (%), by Country 2025 & 2033
- Figure 50: Rest of Middle East E-liquid Industry Revenue (Million), by Product Type 2025 & 2033
- Figure 51: Rest of Middle East E-liquid Industry Revenue Share (%), by Product Type 2025 & 2033
- Figure 52: Rest of Middle East E-liquid Industry Revenue (Million), by Distribution Channel 2025 & 2033
- Figure 53: Rest of Middle East E-liquid Industry Revenue Share (%), by Distribution Channel 2025 & 2033
- Figure 54: Rest of Middle East E-liquid Industry Revenue (Million), by Geography 2025 & 2033
- Figure 55: Rest of Middle East E-liquid Industry Revenue Share (%), by Geography 2025 & 2033
- Figure 56: Rest of Middle East E-liquid Industry Revenue (Million), by Country 2025 & 2033
- Figure 57: Rest of Middle East E-liquid Industry Revenue Share (%), by Country 2025 & 2033
List of Tables
- Table 1: Global E-liquid Industry Revenue Million Forecast, by Product Type 2020 & 2033
- Table 2: Global E-liquid Industry Revenue Million Forecast, by Distribution Channel 2020 & 2033
- Table 3: Global E-liquid Industry Revenue Million Forecast, by Geography 2020 & 2033
- Table 4: Global E-liquid Industry Revenue Million Forecast, by Region 2020 & 2033
- Table 5: Global E-liquid Industry Revenue Million Forecast, by Product Type 2020 & 2033
- Table 6: Global E-liquid Industry Revenue Million Forecast, by Distribution Channel 2020 & 2033
- Table 7: Global E-liquid Industry Revenue Million Forecast, by Geography 2020 & 2033
- Table 8: Global E-liquid Industry Revenue Million Forecast, by Country 2020 & 2033
- Table 9: Global E-liquid Industry Revenue Million Forecast, by Product Type 2020 & 2033
- Table 10: Global E-liquid Industry Revenue Million Forecast, by Distribution Channel 2020 & 2033
- Table 11: Global E-liquid Industry Revenue Million Forecast, by Geography 2020 & 2033
- Table 12: Global E-liquid Industry Revenue Million Forecast, by Country 2020 & 2033
- Table 13: Global E-liquid Industry Revenue Million Forecast, by Product Type 2020 & 2033
- Table 14: Global E-liquid Industry Revenue Million Forecast, by Distribution Channel 2020 & 2033
- Table 15: Global E-liquid Industry Revenue Million Forecast, by Geography 2020 & 2033
- Table 16: Global E-liquid Industry Revenue Million Forecast, by Country 2020 & 2033
- Table 17: Global E-liquid Industry Revenue Million Forecast, by Product Type 2020 & 2033
- Table 18: Global E-liquid Industry Revenue Million Forecast, by Distribution Channel 2020 & 2033
- Table 19: Global E-liquid Industry Revenue Million Forecast, by Geography 2020 & 2033
- Table 20: Global E-liquid Industry Revenue Million Forecast, by Country 2020 & 2033
- Table 21: Global E-liquid Industry Revenue Million Forecast, by Product Type 2020 & 2033
- Table 22: Global E-liquid Industry Revenue Million Forecast, by Distribution Channel 2020 & 2033
- Table 23: Global E-liquid Industry Revenue Million Forecast, by Geography 2020 & 2033
- Table 24: Global E-liquid Industry Revenue Million Forecast, by Country 2020 & 2033
- Table 25: Global E-liquid Industry Revenue Million Forecast, by Product Type 2020 & 2033
- Table 26: Global E-liquid Industry Revenue Million Forecast, by Distribution Channel 2020 & 2033
- Table 27: Global E-liquid Industry Revenue Million Forecast, by Geography 2020 & 2033
- Table 28: Global E-liquid Industry Revenue Million Forecast, by Country 2020 & 2033
- Table 29: Global E-liquid Industry Revenue Million Forecast, by Product Type 2020 & 2033
- Table 30: Global E-liquid Industry Revenue Million Forecast, by Distribution Channel 2020 & 2033
- Table 31: Global E-liquid Industry Revenue Million Forecast, by Geography 2020 & 2033
- Table 32: Global E-liquid Industry Revenue Million Forecast, by Country 2020 & 2033
Frequently Asked Questions
1. What is the projected Compound Annual Growth Rate (CAGR) of the E-liquid Industry?
The projected CAGR is approximately 18.20%.
2. Which companies are prominent players in the E-liquid Industry?
Key companies in the market include RITCHY GROUP, Innokin Technology, Philip Morris International Inc, Joyetech Group, Ecigs Solutions Ltd, Intellicig Inc, Aspire, KangerTech, British American Tobacco, VIP Electronic Cigarettes.
3. What are the main segments of the E-liquid Industry?
The market segments include Product Type, Distribution Channel, Geography.
4. Can you provide details about the market size?
The market size is estimated to be USD 128.70 Million as of 2022.
5. What are some drivers contributing to market growth?
Aggressive Social Media Marketing; Lower-risk Factor Associated with the Use of E-Cigarettes Compared to Conventional/Combustible Cigarettes.
6. What are the notable trends driving market growth?
Penetration of E-cigarettes in Organized Retail.
7. Are there any restraints impacting market growth?
Government Initiatives to Ban Disposable E-Cigarettes.
8. Can you provide examples of recent developments in the market?
In April 2022, RELX International, a multinational electronic cigarettes company, lauds the recent decision by Egyptian authorities to allow the legal import and commercialization of e-cigarette products in the country. The lifting of the ban highlights the Egyptian authorities' progressive approach to e-cigarettes. It sets the stage for creating a regulated market rich with business opportunities by serving the demand for easily accessible, quality products by legal age (adult) consumers across the country.
9. What pricing options are available for accessing the report?
Pricing options include single-user, multi-user, and enterprise licenses priced at USD 4750, USD 5250, and USD 8750 respectively.
10. Is the market size provided in terms of value or volume?
The market size is provided in terms of value, measured in Million.
11. Are there any specific market keywords associated with the report?
Yes, the market keyword associated with the report is "E-liquid Industry," which aids in identifying and referencing the specific market segment covered.
12. How do I determine which pricing option suits my needs best?
The pricing options vary based on user requirements and access needs. Individual users may opt for single-user licenses, while businesses requiring broader access may choose multi-user or enterprise licenses for cost-effective access to the report.
13. Are there any additional resources or data provided in the E-liquid Industry report?
While the report offers comprehensive insights, it's advisable to review the specific contents or supplementary materials provided to ascertain if additional resources or data are available.
14. How can I stay updated on further developments or reports in the E-liquid Industry?
To stay informed about further developments, trends, and reports in the E-liquid Industry, consider subscribing to industry newsletters, following relevant companies and organizations, or regularly checking reputable industry news sources and publications.
Methodology
Step 1 - Identification of Relevant Samples Size from Population Database


Step 2 - Approaches for Defining Global Market Size (Value, Volume* & Price*)

Note*: In applicable scenarios
Step 3 - Data Sources
Primary Research
- Web Analytics
- Survey Reports
- Research Institute
- Latest Research Reports
- Opinion Leaders
Secondary Research
- Annual Reports
- White Paper
- Latest Press Release
- Industry Association
- Paid Database
- Investor Presentations

Step 4 - Data Triangulation
Involves using different sources of information in order to increase the validity of a study
These sources are likely to be stakeholders in a program - participants, other researchers, program staff, other community members, and so on.
Then we put all data in single framework & apply various statistical tools to find out the dynamic on the market.
During the analysis stage, feedback from the stakeholder groups would be compared to determine areas of agreement as well as areas of divergence