

Key Insights
The global cosmetic jars packaging market is projected for significant expansion, reaching an estimated 57.55 billion by 2025. This growth trajectory is underpinned by a robust Compound Annual Growth Rate (CAGR) of 4.82%. The primary drivers include the escalating demand for premium cosmetic products and a strong consumer preference for sustainable packaging alternatives. The burgeoning popularity of high-end skincare lines, in particular, necessitates sophisticated and visually appealing packaging solutions. Concurrently, heightened environmental consciousness among consumers is compelling manufacturers to adopt eco-friendly materials such as recycled glass and biodegradable plastics, fostering innovation in packaging technology. This shift is further amplified by supportive government regulations promoting sustainable business practices. Key industry leaders are actively investing in research and development to offer lightweight and highly recyclable packaging options, addressing the evolving needs of the market.
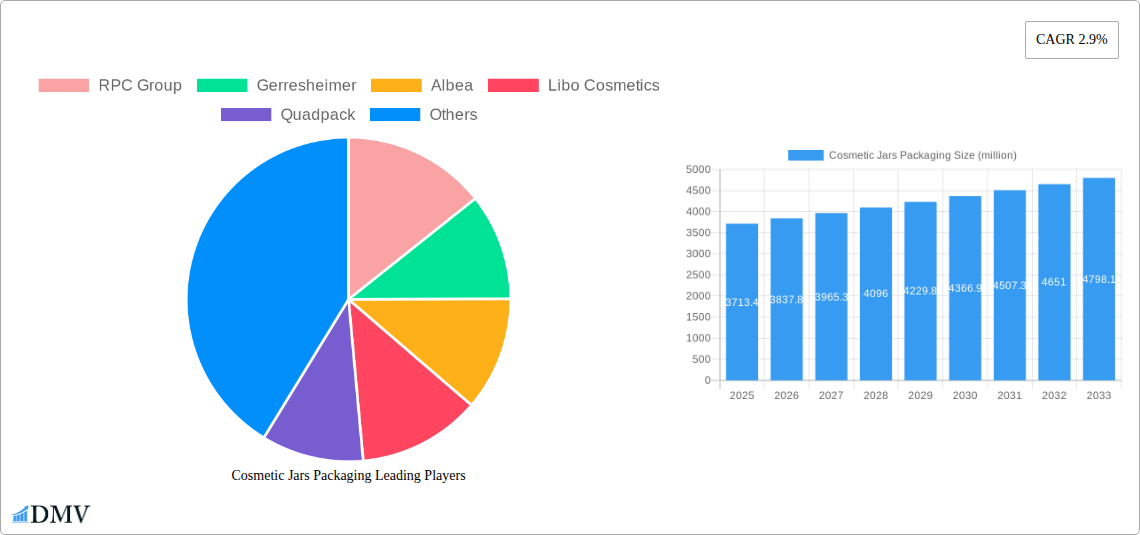
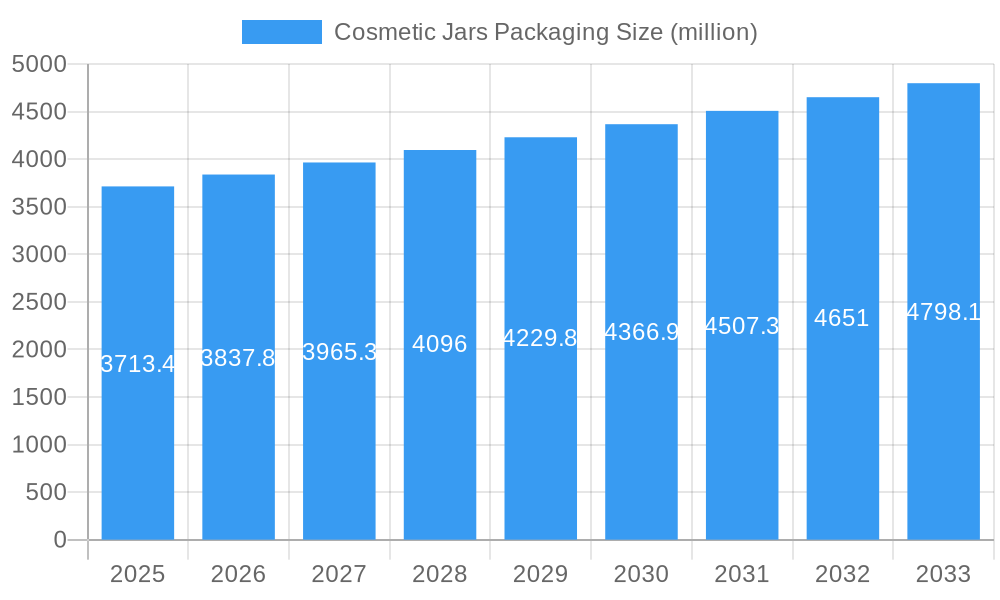
Cosmetic Jars Packaging Market Size (In Billion)
The competitive environment features a dynamic interplay between established global corporations and agile regional specialists. While larger entities leverage economies of scale and extensive distribution channels, smaller players excel in delivering specialized solutions and bespoke designs tailored to precise client requirements. Future market expansion will hinge on the industry's capacity for innovation and adaptability to shifting consumer expectations and regulatory frameworks. Embracing cutting-edge technologies like smart packaging and optimizing supply chain efficiencies will be crucial for cost reduction and minimizing environmental impact. Strategic market penetration into emerging economies with rising cosmetic consumption, alongside targeted partnerships and mergers, will significantly influence market dynamics throughout the forecast period.
Cosmetic Jars Packaging Company Market Share
Cosmetic Jars Packaging Market: A Comprehensive Report (2019-2033)
This insightful report delivers a comprehensive analysis of the global cosmetic jars packaging market, projecting a multi-million dollar valuation by 2033. Covering the historical period (2019-2024), base year (2025), and forecast period (2025-2033), this study provides stakeholders with actionable intelligence to navigate this dynamic market. Key players like RPC Group, Gerresheimer, Albea, Libo Cosmetics, and others are profiled, revealing market share distributions and strategic moves. The report meticulously examines industry trends, technological advancements, and regulatory impacts, offering a granular view of market segmentation and regional dominance.
Cosmetic Jars Packaging Market Composition & Trends
The global cosmetic jars packaging market, valued at $XX million in 2025, exhibits a moderately consolidated structure. RPC Group, Gerresheimer, and Albea collectively hold approximately XX% of the market share in 2025, indicating significant influence. Market concentration is further shaped by the ongoing mergers and acquisitions (M&A) activity, with deals valued at over $XX million in the past five years. Innovation, driven by sustainable material usage (e.g., recycled plastics, bio-based polymers) and enhanced barrier properties, is a crucial trend. Stringent regulatory landscapes, particularly concerning material safety and recyclability, are continuously evolving, pushing companies towards compliance and sustainable solutions. Substitute products, such as flexible pouches and tubes, pose a competitive challenge, particularly for specific applications. The end-user profile is diverse, including major cosmetic brands, small-to-medium enterprises (SMEs), and private label manufacturers.
- Market Share (2025): RPC Group (XX%), Gerresheimer (XX%), Albea (XX%), Others (XX%)
- M&A Activity (2020-2024): Total deal value exceeding $XX million.
- Key Innovation Areas: Sustainable materials, improved barrier properties, customized designs.
- Regulatory Focus: Material safety, recyclability, and labeling compliance.
Cosmetic Jars Packaging Industry Evolution
The cosmetic jars packaging market has experienced robust growth, expanding at a CAGR of XX% during 2019-2024. This growth trajectory is primarily fueled by the escalating demand for cosmetics and personal care products globally, coupled with the rising preference for premium and aesthetically pleasing packaging. Technological advancements, like the introduction of lightweight yet durable materials and sophisticated decoration techniques (e.g., 3D printing, advanced screen printing), have significantly impacted the market. Consumer preferences have shifted toward sustainable and ethically sourced materials, driving the adoption of eco-friendly packaging solutions. The increasing demand for customized and personalized packaging further enhances market dynamism. This trend is reflected in the growing adoption of innovative packaging features, such as tamper-evident seals and airless dispensers, increasing at a rate of XX% annually.
Leading Regions, Countries, or Segments in Cosmetic Jars Packaging
The North American region dominates the global cosmetic jars packaging market, accounting for approximately XX% of the total revenue in 2025. This dominance is attributed to several factors:
- High Cosmetic Consumption: North America exhibits one of the highest per capita consumption rates for cosmetic products globally.
- Strong Regulatory Framework: A well-defined regulatory framework ensures compliance and consumer safety, fostering market stability.
- Significant Investments in R&D: Substantial investments in research and development drive innovation within the packaging industry.
- Presence of Key Players: The region houses a large number of major cosmetic brands and packaging manufacturers, creating a robust ecosystem.
Europe also holds a substantial market share, driven by similar factors, albeit with a stronger emphasis on sustainable packaging regulations. Asia Pacific, while currently smaller, is experiencing rapid growth, fueled by a burgeoning middle class and increasing disposable income.
Cosmetic Jars Packaging Product Innovations
Recent innovations in cosmetic jar packaging focus on enhancing both aesthetics and functionality. Lightweight, yet robust materials, improved barrier properties to maintain product freshness and quality, and customizable designs tailored to specific brands or product lines are key advancements. The integration of smart packaging technologies, such as QR codes for enhanced product information and authentication, is also gaining traction. These innovations aim to deliver a premium consumer experience and bolster brand loyalty, while simultaneously addressing sustainability concerns.
Propelling Factors for Cosmetic Jars Packaging Growth
Several factors contribute to the growth of the cosmetic jars packaging market. Technological advancements, such as the development of sustainable materials and advanced decoration techniques, are key drivers. The expanding global cosmetics industry, particularly in emerging markets, provides significant growth opportunities. Favorable regulatory environments encouraging sustainability initiatives further accelerate market expansion. Economic factors like rising disposable incomes in developing countries and growing consumer spending on beauty and personal care products are also crucial growth drivers.
Obstacles in the Cosmetic Jars Packaging Market
The market faces challenges including increasing raw material costs, leading to higher production expenses, and fluctuating oil prices impacting the cost of plastic resins. Supply chain disruptions caused by geopolitical instability and unforeseen events have negatively impacted production timelines and increased costs. Intense competition among established and emerging players necessitates continuous innovation and cost optimization strategies. Stringent environmental regulations and the growing demand for sustainable packaging solutions also pose challenges for manufacturers.
Future Opportunities in Cosmetic Jars Packaging
Emerging opportunities lie in the growth of the personalized cosmetics market, driving demand for customized packaging solutions. The adoption of innovative materials, such as biodegradable and compostable options, presents a significant opportunity for sustainable growth. Expanding into new markets, especially in developing economies with rising demand for cosmetic products, offers promising potential. Furthermore, integrating smart packaging technologies for improved product traceability and consumer engagement is poised for significant expansion.
Major Players in the Cosmetic Jars Packaging Ecosystem
- RPC Group
- Gerresheimer
- Albea
- Libo Cosmetics
- Quadpack
- HCP Packaging
- Masterchem
- Raepak
- Akey Group
- Bonex
Key Developments in Cosmetic Jars Packaging Industry
- 2023 Q3: Albea launched a new range of sustainable cosmetic jars made from recycled PET.
- 2022 Q4: RPC Group acquired a smaller packaging company, expanding its product portfolio.
- 2021 Q2: Gerresheimer introduced a new line of airless jars, enhancing product preservation.
- (Further developments to be added based on available data)
Strategic Cosmetic Jars Packaging Market Forecast
The cosmetic jars packaging market is poised for sustained growth driven by continuous innovation in sustainable materials, increasing demand for customized packaging, and the expansion into new markets. The predicted growth rate for the forecast period (2025-2033) is expected to exceed XX%, reaching a market value of $XX million by 2033. This growth will be driven by a combination of factors, including increasing consumer spending on beauty and personal care products and the ongoing trend towards environmentally friendly packaging solutions. The market's future hinges on the ability of companies to adapt to evolving consumer preferences and regulatory landscapes.
Cosmetic Jars Packaging Segmentation
-
1. Application
- 1.1. Skin Care
- 1.2. Hair Care
- 1.3. Makeup
- 1.4. Nail Care
- 1.5. Others
-
2. Types
- 2.1. Plastic
- 2.2. Metal
- 2.3. Wood
- 2.4. Glass
Cosmetic Jars Packaging Segmentation By Geography
-
1. North America
- 1.1. United States
- 1.2. Canada
- 1.3. Mexico
-
2. South America
- 2.1. Brazil
- 2.2. Argentina
- 2.3. Rest of South America
-
3. Europe
- 3.1. United Kingdom
- 3.2. Germany
- 3.3. France
- 3.4. Italy
- 3.5. Spain
- 3.6. Russia
- 3.7. Benelux
- 3.8. Nordics
- 3.9. Rest of Europe
-
4. Middle East & Africa
- 4.1. Turkey
- 4.2. Israel
- 4.3. GCC
- 4.4. North Africa
- 4.5. South Africa
- 4.6. Rest of Middle East & Africa
-
5. Asia Pacific
- 5.1. China
- 5.2. India
- 5.3. Japan
- 5.4. South Korea
- 5.5. ASEAN
- 5.6. Oceania
- 5.7. Rest of Asia Pacific
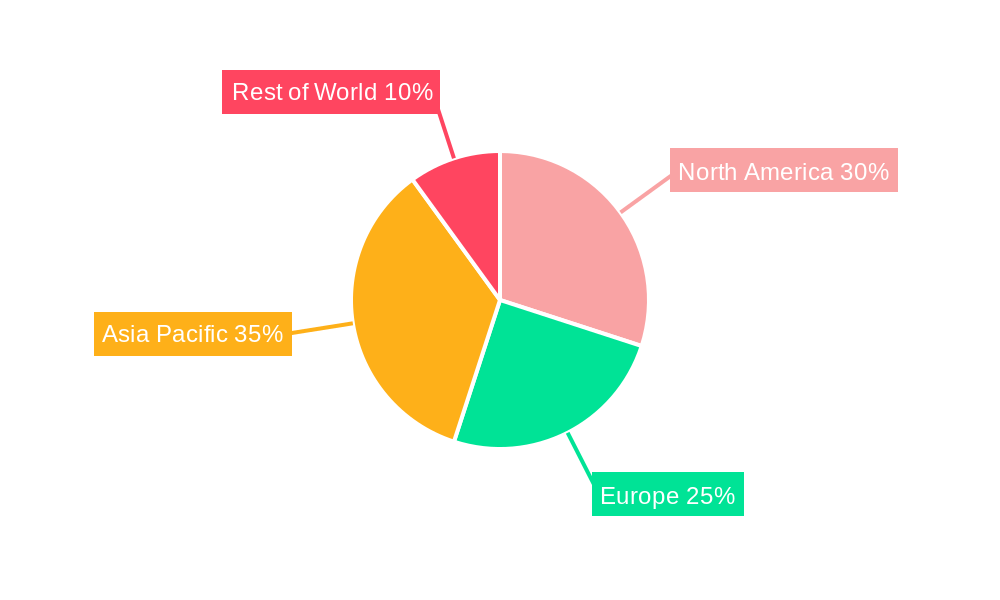
Cosmetic Jars Packaging Regional Market Share
Geographic Coverage of Cosmetic Jars Packaging
Cosmetic Jars Packaging REPORT HIGHLIGHTS
| Aspects | Details |
|---|---|
| Study Period | 2020-2034 |
| Base Year | 2025 |
| Estimated Year | 2026 |
| Forecast Period | 2026-2034 |
| Historical Period | 2020-2025 |
| Growth Rate | CAGR of 4.82% from 2020-2034 |
| Segmentation |
|
Table of Contents
- 1. Introduction
- 1.1. Research Scope
- 1.2. Market Segmentation
- 1.3. Research Methodology
- 1.4. Definitions and Assumptions
- 2. Executive Summary
- 2.1. Introduction
- 3. Market Dynamics
- 3.1. Introduction
- 3.2. Market Drivers
- 3.3. Market Restrains
- 3.4. Market Trends
- 4. Market Factor Analysis
- 4.1. Porters Five Forces
- 4.2. Supply/Value Chain
- 4.3. PESTEL analysis
- 4.4. Market Entropy
- 4.5. Patent/Trademark Analysis
- 5. Global Cosmetic Jars Packaging Analysis, Insights and Forecast, 2020-2032
- 5.1. Market Analysis, Insights and Forecast - by Application
- 5.1.1. Skin Care
- 5.1.2. Hair Care
- 5.1.3. Makeup
- 5.1.4. Nail Care
- 5.1.5. Others
- 5.2. Market Analysis, Insights and Forecast - by Types
- 5.2.1. Plastic
- 5.2.2. Metal
- 5.2.3. Wood
- 5.2.4. Glass
- 5.3. Market Analysis, Insights and Forecast - by Region
- 5.3.1. North America
- 5.3.2. South America
- 5.3.3. Europe
- 5.3.4. Middle East & Africa
- 5.3.5. Asia Pacific
- 5.1. Market Analysis, Insights and Forecast - by Application
- 6. North America Cosmetic Jars Packaging Analysis, Insights and Forecast, 2020-2032
- 6.1. Market Analysis, Insights and Forecast - by Application
- 6.1.1. Skin Care
- 6.1.2. Hair Care
- 6.1.3. Makeup
- 6.1.4. Nail Care
- 6.1.5. Others
- 6.2. Market Analysis, Insights and Forecast - by Types
- 6.2.1. Plastic
- 6.2.2. Metal
- 6.2.3. Wood
- 6.2.4. Glass
- 6.1. Market Analysis, Insights and Forecast - by Application
- 7. South America Cosmetic Jars Packaging Analysis, Insights and Forecast, 2020-2032
- 7.1. Market Analysis, Insights and Forecast - by Application
- 7.1.1. Skin Care
- 7.1.2. Hair Care
- 7.1.3. Makeup
- 7.1.4. Nail Care
- 7.1.5. Others
- 7.2. Market Analysis, Insights and Forecast - by Types
- 7.2.1. Plastic
- 7.2.2. Metal
- 7.2.3. Wood
- 7.2.4. Glass
- 7.1. Market Analysis, Insights and Forecast - by Application
- 8. Europe Cosmetic Jars Packaging Analysis, Insights and Forecast, 2020-2032
- 8.1. Market Analysis, Insights and Forecast - by Application
- 8.1.1. Skin Care
- 8.1.2. Hair Care
- 8.1.3. Makeup
- 8.1.4. Nail Care
- 8.1.5. Others
- 8.2. Market Analysis, Insights and Forecast - by Types
- 8.2.1. Plastic
- 8.2.2. Metal
- 8.2.3. Wood
- 8.2.4. Glass
- 8.1. Market Analysis, Insights and Forecast - by Application
- 9. Middle East & Africa Cosmetic Jars Packaging Analysis, Insights and Forecast, 2020-2032
- 9.1. Market Analysis, Insights and Forecast - by Application
- 9.1.1. Skin Care
- 9.1.2. Hair Care
- 9.1.3. Makeup
- 9.1.4. Nail Care
- 9.1.5. Others
- 9.2. Market Analysis, Insights and Forecast - by Types
- 9.2.1. Plastic
- 9.2.2. Metal
- 9.2.3. Wood
- 9.2.4. Glass
- 9.1. Market Analysis, Insights and Forecast - by Application
- 10. Asia Pacific Cosmetic Jars Packaging Analysis, Insights and Forecast, 2020-2032
- 10.1. Market Analysis, Insights and Forecast - by Application
- 10.1.1. Skin Care
- 10.1.2. Hair Care
- 10.1.3. Makeup
- 10.1.4. Nail Care
- 10.1.5. Others
- 10.2. Market Analysis, Insights and Forecast - by Types
- 10.2.1. Plastic
- 10.2.2. Metal
- 10.2.3. Wood
- 10.2.4. Glass
- 10.1. Market Analysis, Insights and Forecast - by Application
- 11. Competitive Analysis
- 11.1. Global Market Share Analysis 2025
- 11.2. Company Profiles
- 11.2.1 RPC Group
- 11.2.1.1. Overview
- 11.2.1.2. Products
- 11.2.1.3. SWOT Analysis
- 11.2.1.4. Recent Developments
- 11.2.1.5. Financials (Based on Availability)
- 11.2.2 Gerresheimer
- 11.2.2.1. Overview
- 11.2.2.2. Products
- 11.2.2.3. SWOT Analysis
- 11.2.2.4. Recent Developments
- 11.2.2.5. Financials (Based on Availability)
- 11.2.3 Albea
- 11.2.3.1. Overview
- 11.2.3.2. Products
- 11.2.3.3. SWOT Analysis
- 11.2.3.4. Recent Developments
- 11.2.3.5. Financials (Based on Availability)
- 11.2.4 Libo Cosmetics
- 11.2.4.1. Overview
- 11.2.4.2. Products
- 11.2.4.3. SWOT Analysis
- 11.2.4.4. Recent Developments
- 11.2.4.5. Financials (Based on Availability)
- 11.2.5 Quadpack
- 11.2.5.1. Overview
- 11.2.5.2. Products
- 11.2.5.3. SWOT Analysis
- 11.2.5.4. Recent Developments
- 11.2.5.5. Financials (Based on Availability)
- 11.2.6 HCP Packaging
- 11.2.6.1. Overview
- 11.2.6.2. Products
- 11.2.6.3. SWOT Analysis
- 11.2.6.4. Recent Developments
- 11.2.6.5. Financials (Based on Availability)
- 11.2.7 Masterchem
- 11.2.7.1. Overview
- 11.2.7.2. Products
- 11.2.7.3. SWOT Analysis
- 11.2.7.4. Recent Developments
- 11.2.7.5. Financials (Based on Availability)
- 11.2.8 Raepak
- 11.2.8.1. Overview
- 11.2.8.2. Products
- 11.2.8.3. SWOT Analysis
- 11.2.8.4. Recent Developments
- 11.2.8.5. Financials (Based on Availability)
- 11.2.9 Akey Group
- 11.2.9.1. Overview
- 11.2.9.2. Products
- 11.2.9.3. SWOT Analysis
- 11.2.9.4. Recent Developments
- 11.2.9.5. Financials (Based on Availability)
- 11.2.10 Bonex
- 11.2.10.1. Overview
- 11.2.10.2. Products
- 11.2.10.3. SWOT Analysis
- 11.2.10.4. Recent Developments
- 11.2.10.5. Financials (Based on Availability)
- 11.2.1 RPC Group
List of Figures
- Figure 1: Global Cosmetic Jars Packaging Revenue Breakdown (billion, %) by Region 2025 & 2033
- Figure 2: North America Cosmetic Jars Packaging Revenue (billion), by Application 2025 & 2033
- Figure 3: North America Cosmetic Jars Packaging Revenue Share (%), by Application 2025 & 2033
- Figure 4: North America Cosmetic Jars Packaging Revenue (billion), by Types 2025 & 2033
- Figure 5: North America Cosmetic Jars Packaging Revenue Share (%), by Types 2025 & 2033
- Figure 6: North America Cosmetic Jars Packaging Revenue (billion), by Country 2025 & 2033
- Figure 7: North America Cosmetic Jars Packaging Revenue Share (%), by Country 2025 & 2033
- Figure 8: South America Cosmetic Jars Packaging Revenue (billion), by Application 2025 & 2033
- Figure 9: South America Cosmetic Jars Packaging Revenue Share (%), by Application 2025 & 2033
- Figure 10: South America Cosmetic Jars Packaging Revenue (billion), by Types 2025 & 2033
- Figure 11: South America Cosmetic Jars Packaging Revenue Share (%), by Types 2025 & 2033
- Figure 12: South America Cosmetic Jars Packaging Revenue (billion), by Country 2025 & 2033
- Figure 13: South America Cosmetic Jars Packaging Revenue Share (%), by Country 2025 & 2033
- Figure 14: Europe Cosmetic Jars Packaging Revenue (billion), by Application 2025 & 2033
- Figure 15: Europe Cosmetic Jars Packaging Revenue Share (%), by Application 2025 & 2033
- Figure 16: Europe Cosmetic Jars Packaging Revenue (billion), by Types 2025 & 2033
- Figure 17: Europe Cosmetic Jars Packaging Revenue Share (%), by Types 2025 & 2033
- Figure 18: Europe Cosmetic Jars Packaging Revenue (billion), by Country 2025 & 2033
- Figure 19: Europe Cosmetic Jars Packaging Revenue Share (%), by Country 2025 & 2033
- Figure 20: Middle East & Africa Cosmetic Jars Packaging Revenue (billion), by Application 2025 & 2033
- Figure 21: Middle East & Africa Cosmetic Jars Packaging Revenue Share (%), by Application 2025 & 2033
- Figure 22: Middle East & Africa Cosmetic Jars Packaging Revenue (billion), by Types 2025 & 2033
- Figure 23: Middle East & Africa Cosmetic Jars Packaging Revenue Share (%), by Types 2025 & 2033
- Figure 24: Middle East & Africa Cosmetic Jars Packaging Revenue (billion), by Country 2025 & 2033
- Figure 25: Middle East & Africa Cosmetic Jars Packaging Revenue Share (%), by Country 2025 & 2033
- Figure 26: Asia Pacific Cosmetic Jars Packaging Revenue (billion), by Application 2025 & 2033
- Figure 27: Asia Pacific Cosmetic Jars Packaging Revenue Share (%), by Application 2025 & 2033
- Figure 28: Asia Pacific Cosmetic Jars Packaging Revenue (billion), by Types 2025 & 2033
- Figure 29: Asia Pacific Cosmetic Jars Packaging Revenue Share (%), by Types 2025 & 2033
- Figure 30: Asia Pacific Cosmetic Jars Packaging Revenue (billion), by Country 2025 & 2033
- Figure 31: Asia Pacific Cosmetic Jars Packaging Revenue Share (%), by Country 2025 & 2033
List of Tables
- Table 1: Global Cosmetic Jars Packaging Revenue billion Forecast, by Application 2020 & 2033
- Table 2: Global Cosmetic Jars Packaging Revenue billion Forecast, by Types 2020 & 2033
- Table 3: Global Cosmetic Jars Packaging Revenue billion Forecast, by Region 2020 & 2033
- Table 4: Global Cosmetic Jars Packaging Revenue billion Forecast, by Application 2020 & 2033
- Table 5: Global Cosmetic Jars Packaging Revenue billion Forecast, by Types 2020 & 2033
- Table 6: Global Cosmetic Jars Packaging Revenue billion Forecast, by Country 2020 & 2033
- Table 7: United States Cosmetic Jars Packaging Revenue (billion) Forecast, by Application 2020 & 2033
- Table 8: Canada Cosmetic Jars Packaging Revenue (billion) Forecast, by Application 2020 & 2033
- Table 9: Mexico Cosmetic Jars Packaging Revenue (billion) Forecast, by Application 2020 & 2033
- Table 10: Global Cosmetic Jars Packaging Revenue billion Forecast, by Application 2020 & 2033
- Table 11: Global Cosmetic Jars Packaging Revenue billion Forecast, by Types 2020 & 2033
- Table 12: Global Cosmetic Jars Packaging Revenue billion Forecast, by Country 2020 & 2033
- Table 13: Brazil Cosmetic Jars Packaging Revenue (billion) Forecast, by Application 2020 & 2033
- Table 14: Argentina Cosmetic Jars Packaging Revenue (billion) Forecast, by Application 2020 & 2033
- Table 15: Rest of South America Cosmetic Jars Packaging Revenue (billion) Forecast, by Application 2020 & 2033
- Table 16: Global Cosmetic Jars Packaging Revenue billion Forecast, by Application 2020 & 2033
- Table 17: Global Cosmetic Jars Packaging Revenue billion Forecast, by Types 2020 & 2033
- Table 18: Global Cosmetic Jars Packaging Revenue billion Forecast, by Country 2020 & 2033
- Table 19: United Kingdom Cosmetic Jars Packaging Revenue (billion) Forecast, by Application 2020 & 2033
- Table 20: Germany Cosmetic Jars Packaging Revenue (billion) Forecast, by Application 2020 & 2033
- Table 21: France Cosmetic Jars Packaging Revenue (billion) Forecast, by Application 2020 & 2033
- Table 22: Italy Cosmetic Jars Packaging Revenue (billion) Forecast, by Application 2020 & 2033
- Table 23: Spain Cosmetic Jars Packaging Revenue (billion) Forecast, by Application 2020 & 2033
- Table 24: Russia Cosmetic Jars Packaging Revenue (billion) Forecast, by Application 2020 & 2033
- Table 25: Benelux Cosmetic Jars Packaging Revenue (billion) Forecast, by Application 2020 & 2033
- Table 26: Nordics Cosmetic Jars Packaging Revenue (billion) Forecast, by Application 2020 & 2033
- Table 27: Rest of Europe Cosmetic Jars Packaging Revenue (billion) Forecast, by Application 2020 & 2033
- Table 28: Global Cosmetic Jars Packaging Revenue billion Forecast, by Application 2020 & 2033
- Table 29: Global Cosmetic Jars Packaging Revenue billion Forecast, by Types 2020 & 2033
- Table 30: Global Cosmetic Jars Packaging Revenue billion Forecast, by Country 2020 & 2033
- Table 31: Turkey Cosmetic Jars Packaging Revenue (billion) Forecast, by Application 2020 & 2033
- Table 32: Israel Cosmetic Jars Packaging Revenue (billion) Forecast, by Application 2020 & 2033
- Table 33: GCC Cosmetic Jars Packaging Revenue (billion) Forecast, by Application 2020 & 2033
- Table 34: North Africa Cosmetic Jars Packaging Revenue (billion) Forecast, by Application 2020 & 2033
- Table 35: South Africa Cosmetic Jars Packaging Revenue (billion) Forecast, by Application 2020 & 2033
- Table 36: Rest of Middle East & Africa Cosmetic Jars Packaging Revenue (billion) Forecast, by Application 2020 & 2033
- Table 37: Global Cosmetic Jars Packaging Revenue billion Forecast, by Application 2020 & 2033
- Table 38: Global Cosmetic Jars Packaging Revenue billion Forecast, by Types 2020 & 2033
- Table 39: Global Cosmetic Jars Packaging Revenue billion Forecast, by Country 2020 & 2033
- Table 40: China Cosmetic Jars Packaging Revenue (billion) Forecast, by Application 2020 & 2033
- Table 41: India Cosmetic Jars Packaging Revenue (billion) Forecast, by Application 2020 & 2033
- Table 42: Japan Cosmetic Jars Packaging Revenue (billion) Forecast, by Application 2020 & 2033
- Table 43: South Korea Cosmetic Jars Packaging Revenue (billion) Forecast, by Application 2020 & 2033
- Table 44: ASEAN Cosmetic Jars Packaging Revenue (billion) Forecast, by Application 2020 & 2033
- Table 45: Oceania Cosmetic Jars Packaging Revenue (billion) Forecast, by Application 2020 & 2033
- Table 46: Rest of Asia Pacific Cosmetic Jars Packaging Revenue (billion) Forecast, by Application 2020 & 2033
Frequently Asked Questions
1. What is the projected Compound Annual Growth Rate (CAGR) of the Cosmetic Jars Packaging?
The projected CAGR is approximately 4.82%.
2. Which companies are prominent players in the Cosmetic Jars Packaging?
Key companies in the market include RPC Group, Gerresheimer, Albea, Libo Cosmetics, Quadpack, HCP Packaging, Masterchem, Raepak, Akey Group, Bonex.
3. What are the main segments of the Cosmetic Jars Packaging?
The market segments include Application, Types.
4. Can you provide details about the market size?
The market size is estimated to be USD 57.55 billion as of 2022.
5. What are some drivers contributing to market growth?
N/A
6. What are the notable trends driving market growth?
N/A
7. Are there any restraints impacting market growth?
N/A
8. Can you provide examples of recent developments in the market?
N/A
9. What pricing options are available for accessing the report?
Pricing options include single-user, multi-user, and enterprise licenses priced at USD 4900.00, USD 7350.00, and USD 9800.00 respectively.
10. Is the market size provided in terms of value or volume?
The market size is provided in terms of value, measured in billion.
11. Are there any specific market keywords associated with the report?
Yes, the market keyword associated with the report is "Cosmetic Jars Packaging," which aids in identifying and referencing the specific market segment covered.
12. How do I determine which pricing option suits my needs best?
The pricing options vary based on user requirements and access needs. Individual users may opt for single-user licenses, while businesses requiring broader access may choose multi-user or enterprise licenses for cost-effective access to the report.
13. Are there any additional resources or data provided in the Cosmetic Jars Packaging report?
While the report offers comprehensive insights, it's advisable to review the specific contents or supplementary materials provided to ascertain if additional resources or data are available.
14. How can I stay updated on further developments or reports in the Cosmetic Jars Packaging?
To stay informed about further developments, trends, and reports in the Cosmetic Jars Packaging, consider subscribing to industry newsletters, following relevant companies and organizations, or regularly checking reputable industry news sources and publications.
Methodology
Step 1 - Identification of Relevant Samples Size from Population Database


Step 2 - Approaches for Defining Global Market Size (Value, Volume* & Price*)

Note*: In applicable scenarios
Step 3 - Data Sources
Primary Research
- Web Analytics
- Survey Reports
- Research Institute
- Latest Research Reports
- Opinion Leaders
Secondary Research
- Annual Reports
- White Paper
- Latest Press Release
- Industry Association
- Paid Database
- Investor Presentations

Step 4 - Data Triangulation
Involves using different sources of information in order to increase the validity of a study
These sources are likely to be stakeholders in a program - participants, other researchers, program staff, other community members, and so on.
Then we put all data in single framework & apply various statistical tools to find out the dynamic on the market.
During the analysis stage, feedback from the stakeholder groups would be compared to determine areas of agreement as well as areas of divergence