

Key Insights
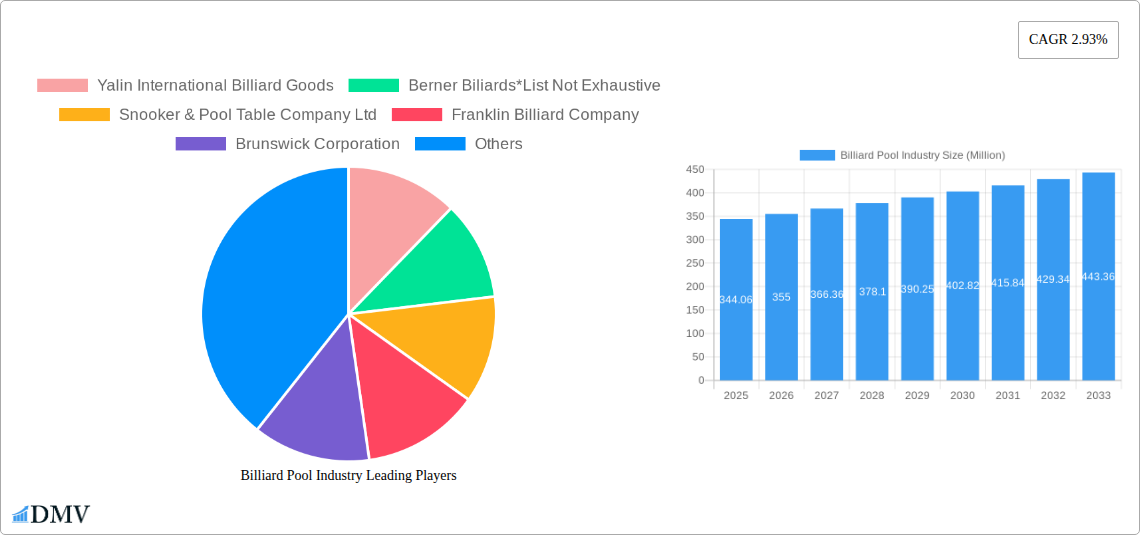
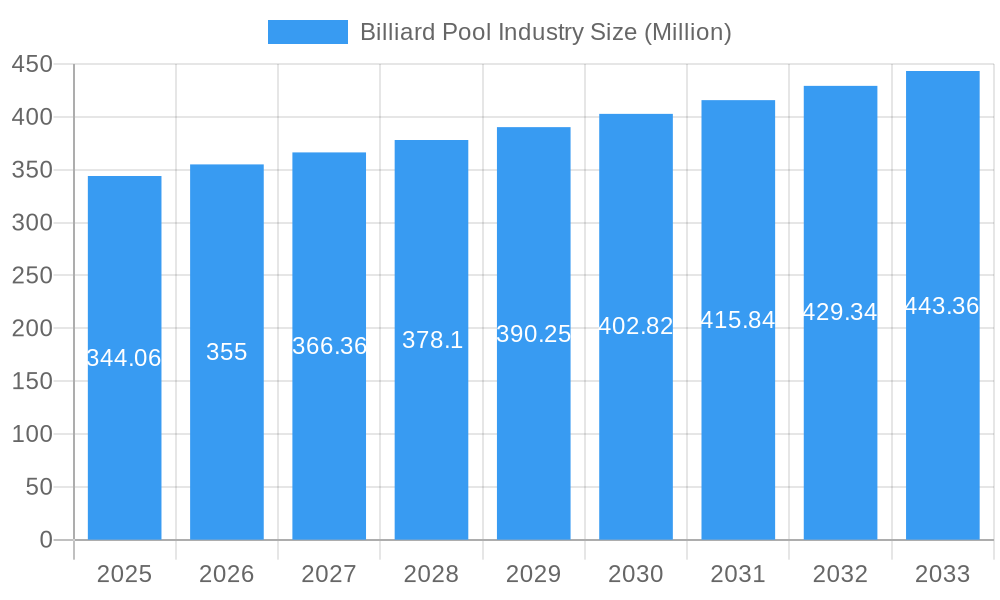
The global billiard and pool industry, currently valued at $344.06 million in 2025, is projected to experience steady growth, with a compound annual growth rate (CAGR) of 2.93% from 2025 to 2033. This growth is fueled by several key factors. Rising disposable incomes in emerging economies are leading to increased participation in recreational activities like billiards, driving demand for tables, cues, and other equipment. The increasing popularity of competitive billiards and pool, both professionally and at amateur levels, further stimulates market expansion. Furthermore, the rise of online retail channels offers greater accessibility to equipment and related products, enhancing market reach and convenience for consumers. While the industry faces potential restraints such as the relatively high initial investment cost for setting up a home game room, innovative product designs, such as space-saving tables and technologically advanced cues, are mitigating this challenge. The segmentation of the market, encompassing various game types (carom, pool, snooker) and equipment categories (tables, balls, cues, and other accessories), provides ample opportunity for niche market players to thrive.
Billiard Pool Industry Market Size (In Million)
The geographical distribution of the market shows a diverse landscape, with North America, Europe, and Asia-Pacific representing significant market shares. Established players like Brunswick Corporation and Yalin International Billiard Goods are leveraging their brand recognition and distribution networks to maintain market dominance, while smaller, specialized companies are catering to growing demand for high-quality, custom-designed equipment. Future growth is likely to be driven by technological advancements in table design, cue technology, and the integration of virtual reality and gaming elements into the billiard experience. Increased sponsorship and media coverage of professional billiard events will also play a key role in expanding the market's overall appeal and driving future growth projections.
Billiard Pool Industry Company Market Share
Billiard Pool Industry Market Report: 2019-2033
This comprehensive report provides a detailed analysis of the Billiard Pool industry, encompassing market size, trends, leading players, and future projections. With a study period spanning 2019-2033, a base year of 2025, and a forecast period of 2025-2033, this report offers invaluable insights for stakeholders seeking to navigate this dynamic market. The global Billiard Pool market is projected to reach xx Million by 2033, exhibiting significant growth potential.
Billiard Pool Industry Market Composition & Trends
This section delves into the competitive landscape of the Billiard Pool industry, analyzing market concentration, innovation drivers, regulatory influences, substitute products, end-user profiles, and merger & acquisition (M&A) activities. The market exhibits a moderately concentrated structure, with key players such as Brunswick Corporation and Yalin International Billiard Goods holding significant market share. However, the presence of numerous smaller players also contributes to competitive dynamics.
- Market Share Distribution (2024): Brunswick Corporation (xx%), Yalin International Billiard Goods (xx%), Others (xx%). (Note: Precise figures require further market research)
- Innovation Catalysts: Technological advancements in table design, cue technology, and smart features are driving innovation. The rise of e-commerce platforms is also impacting distribution and sales strategies.
- Regulatory Landscape: Regulations concerning product safety and manufacturing standards vary across regions and influence market dynamics.
- Substitute Products: Other recreational activities compete for consumer spending, impacting industry growth. The introduction of virtual reality and gaming technologies pose a competitive threat.
- End-User Profiles: The primary end-users include commercial establishments (bars, clubs, hotels), residential customers, and professional players. Understanding diverse end-user preferences is crucial for effective market segmentation.
- M&A Activities: While specific M&A deal values are unavailable, consolidation within the industry is evident, with larger players actively seeking to expand their market reach through acquisitions. The total value of M&A deals during 2019-2024 is estimated to be xx Million.
Billiard Pool Industry Industry Evolution
This section examines the historical and projected growth trajectories of the Billiard Pool industry, highlighting key technological advancements and shifting consumer preferences. The market witnessed a Compound Annual Growth Rate (CAGR) of xx% during the historical period (2019-2024), largely fueled by the growing popularity of pool and snooker as recreational activities. The industry is projected to maintain a robust CAGR of xx% during the forecast period (2025-2033), driven by several factors. Technological advancements have led to the introduction of high-tech tables incorporating features like self-leveling mechanisms and integrated scoring systems, enhancing the gaming experience. The increasing demand for premium and luxury pool tables is also driving market growth. Changes in consumer preferences, including a desire for customized tables and accessories, are shaping product development strategies.
Leading Regions, Countries, or Segments in Billiard Pool Industry
This section identifies the leading regions, countries, and segments within the Billiard Pool industry. Market dominance is influenced by several factors including the level of disposable income, cultural preference for billiards games, and investment trends.
Dominant Segments:
- Type: Pool tables dominate the market due to broader accessibility and popularity compared to carom and snooker.
- Equipment: Pool tables constitute the largest segment, followed by cues and balls. Other equipment, including accessories and lighting, represent a significant, albeit smaller, market share.
- Distribution Channel: Offline retail stores currently account for the majority of sales, but online retail stores are witnessing significant growth.
Key Drivers:
- North America and Europe: Strong historical presence of the Billiard Pool market, substantial disposable income, and established distribution networks drive market dominance in these regions.
- Asia-Pacific: Rapid economic growth and rising disposable incomes in emerging economies within the Asia-Pacific region are driving market expansion. Increased interest in sports and leisure activities contribute to this trend.
- Investment Trends: Investments in infrastructure, such as dedicated billiard halls and game rooms, contribute to market growth.
Billiard Pool Industry Product Innovations
Recent years have witnessed notable innovations in the Billiard Pool industry. High-end manufacturers are introducing tables with advanced features, such as automatic ball return systems, integrated scoring displays, and even gyroscopic self-leveling mechanisms, as exemplified by Bugatti's USD 300,000 pool table launch in May 2021. The introduction of innovative cue designs, materials, and accessories further enhances the gaming experience and caters to diverse player preferences. These technological advancements cater to the increasing consumer demand for enhanced gameplay and sophisticated aesthetics.
Propelling Factors for Billiard Pool Industry Growth
Several factors contribute to the projected growth of the Billiard Pool industry. Technological advancements, such as the incorporation of smart features and improved table designs, enhance the gaming experience and attract new customers. Economic growth, particularly in developing countries, fuels increased discretionary spending on leisure activities. The growing popularity of billiards as a recreational activity further boosts demand. Favorable government regulations and industry support also play a role in fostering market expansion.
Obstacles in the Billiard Pool Industry Market
The Billiard Pool industry faces several challenges. Supply chain disruptions, particularly concerning raw materials and manufacturing, impact production costs and availability. The increasing cost of raw materials, like wood and specialized metals, directly affects product pricing and profitability. Intense competition from other leisure activities and the rise of alternative entertainment options such as video games pose a significant threat. Stricter safety regulations and import/export restrictions in certain regions can increase compliance costs.
Future Opportunities in Billiard Pool Industry
Future opportunities lie in expanding into new markets, particularly in developing economies. Developing innovative products with smart features and enhanced aesthetics will appeal to a broader consumer base. Focus on eco-friendly manufacturing and sustainable materials will resonate with environmentally conscious consumers. Collaborations with gaming companies to develop interactive Billiard Pool experiences can also generate significant growth. Leveraging online retail channels will help expand market reach and access new customer segments.
Major Players in the Billiard Pool Industry Ecosystem
- Yalin International Billiard Goods
- Berner Billiards
- Snooker & Pool Table Company Ltd
- Franklin Billiard Company
- Brunswick Corporation
- H Betti Industries Inc
- Imperial International
- Diamond Billiard Products Inc
- Kaldera Billiards
- Birmingham Billiards Ltd
Key Developments in Billiard Pool Industry Industry
- October 2022: Sawyer Twain launched the Nixon Billiards line, featuring innovative table designs.
- May 2022: FCI Billiards opened a new showroom, expanding its retail presence.
- May 2021: Bugatti launched a luxury USD 300,000 pool table with advanced technology. These developments illustrate the ongoing innovation and expansion within the industry.
Strategic Billiard Pool Industry Market Forecast
The Billiard Pool industry is poised for continued growth, driven by technological advancements, increased disposable incomes, and the rising popularity of billiards as a leisure activity. Expanding into new markets, offering innovative products, and focusing on sustainability will be key to unlocking the industry's full potential. The forecast period promises significant expansion, with the market size expected to grow substantially by 2033.
Billiard Pool Industry Segmentation
-
1. Type
- 1.1. Carom
- 1.2. Pool
- 1.3. Snooker
-
2. Equipment
- 2.1. Table
- 2.2. Ball
- 2.3. Cue
- 2.4. Other Equipment
-
3. Distribution Channel
- 3.1. Offline Retail Stores
- 3.2. Online Retail Stores
Billiard Pool Industry Segmentation By Geography
-
1. North America
- 1.1. United States
- 1.2. Canada
- 1.3. Mexico
- 1.4. Rest of North America
-
2. Europe
- 2.1. Spain
- 2.2. United Kingdom
- 2.3. Germany
- 2.4. France
- 2.5. Italy
- 2.6. Belgium
- 2.7. Rest of Europe
-
3. Asia Pacific
- 3.1. China
- 3.2. Japan
- 3.3. India
- 3.4. Australia
- 3.5. Rest of Asia Pacific
-
4. South America
- 4.1. Brazil
- 4.2. Argentina
- 4.3. Rest of South America
-
5. Middle East and Africa
- 5.1. South Africa
- 5.2. United Arab Emirates
- 5.3. Rest of Middle East and Africa
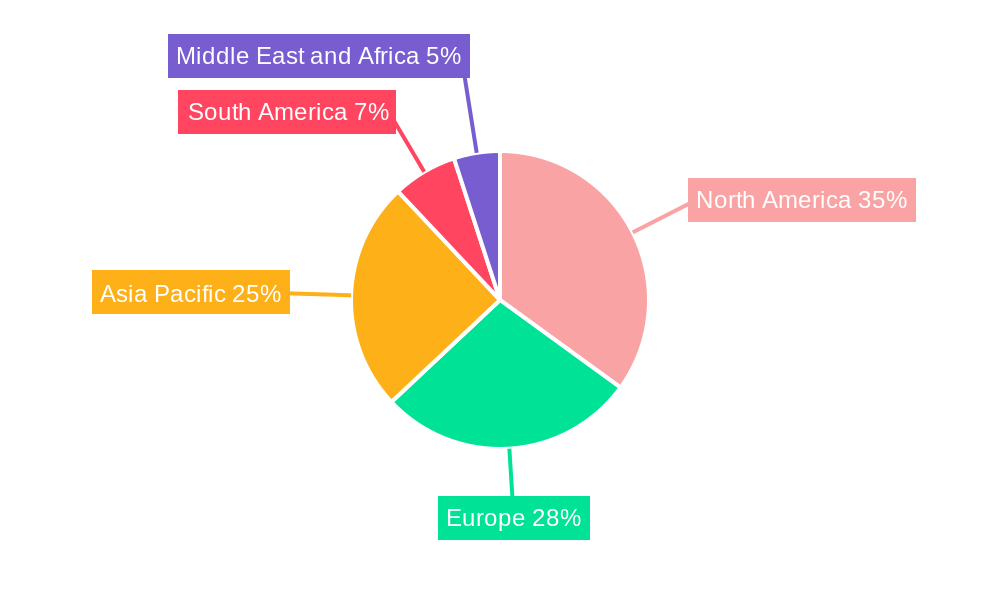
Billiard Pool Industry Regional Market Share
Geographic Coverage of Billiard Pool Industry
Billiard Pool Industry REPORT HIGHLIGHTS
| Aspects | Details |
|---|---|
| Study Period | 2020-2034 |
| Base Year | 2025 |
| Estimated Year | 2026 |
| Forecast Period | 2026-2034 |
| Historical Period | 2020-2025 |
| Growth Rate | CAGR of 2.93% from 2020-2034 |
| Segmentation |
|
Table of Contents
- 1. Introduction
- 1.1. Research Scope
- 1.2. Market Segmentation
- 1.3. Research Objective
- 1.4. Definitions and Assumptions
- 2. Executive Summary
- 2.1. Market Snapshot
- 3. Market Dynamics
- 3.1. Market Drivers
- 3.2. Market Restrains
- 3.3. Market Trends
- 3.4. Market Opportunities
- 4. Market Factor Analysis
- 4.1. Porters Five Forces
- 4.1.1. Bargaining Power of Suppliers
- 4.1.2. Bargaining Power of Buyers
- 4.1.3. Threat of New Entrants
- 4.1.4. Threat of Substitutes
- 4.1.5. Competitive Rivalry
- 4.2. PESTEL analysis
- 4.3. BCG Analysis
- 4.3.1. Stars (High Growth, High Market Share)
- 4.3.2. Cash Cows (Low Growth, High Market Share)
- 4.3.3. Question Mark (High Growth, Low Market Share)
- 4.3.4. Dogs (Low Growth, Low Market Share)
- 4.4. Ansoff Matrix Analysis
- 4.5. Supply Chain Analysis
- 4.6. Regulatory Landscape
- 4.7. Current Market Potential and Opportunity Assessment (TAM–SAM–SOM Framework)
- 4.8. DMV Analyst Note
- 4.1. Porters Five Forces
- 5. Market Analysis, Insights and Forecast 2021-2033
- 5.1. Market Analysis, Insights and Forecast - by Type
- 5.1.1. Carom
- 5.1.2. Pool
- 5.1.3. Snooker
- 5.2. Market Analysis, Insights and Forecast - by Equipment
- 5.2.1. Table
- 5.2.2. Ball
- 5.2.3. Cue
- 5.2.4. Other Equipment
- 5.3. Market Analysis, Insights and Forecast - by Distribution Channel
- 5.3.1. Offline Retail Stores
- 5.3.2. Online Retail Stores
- 5.4. Market Analysis, Insights and Forecast - by Region
- 5.4.1. North America
- 5.4.2. Europe
- 5.4.3. Asia Pacific
- 5.4.4. South America
- 5.4.5. Middle East and Africa
- 5.1. Market Analysis, Insights and Forecast - by Type
- 6. Global Billiard Pool Industry Analysis, Insights and Forecast, 2021-2033
- 6.1. Market Analysis, Insights and Forecast - by Type
- 6.1.1. Carom
- 6.1.2. Pool
- 6.1.3. Snooker
- 6.2. Market Analysis, Insights and Forecast - by Equipment
- 6.2.1. Table
- 6.2.2. Ball
- 6.2.3. Cue
- 6.2.4. Other Equipment
- 6.3. Market Analysis, Insights and Forecast - by Distribution Channel
- 6.3.1. Offline Retail Stores
- 6.3.2. Online Retail Stores
- 6.1. Market Analysis, Insights and Forecast - by Type
- 7. North America Billiard Pool Industry Analysis, Insights and Forecast, 2020-2032
- 7.1. Market Analysis, Insights and Forecast - by Type
- 7.1.1. Carom
- 7.1.2. Pool
- 7.1.3. Snooker
- 7.2. Market Analysis, Insights and Forecast - by Equipment
- 7.2.1. Table
- 7.2.2. Ball
- 7.2.3. Cue
- 7.2.4. Other Equipment
- 7.3. Market Analysis, Insights and Forecast - by Distribution Channel
- 7.3.1. Offline Retail Stores
- 7.3.2. Online Retail Stores
- 7.1. Market Analysis, Insights and Forecast - by Type
- 8. Europe Billiard Pool Industry Analysis, Insights and Forecast, 2020-2032
- 8.1. Market Analysis, Insights and Forecast - by Type
- 8.1.1. Carom
- 8.1.2. Pool
- 8.1.3. Snooker
- 8.2. Market Analysis, Insights and Forecast - by Equipment
- 8.2.1. Table
- 8.2.2. Ball
- 8.2.3. Cue
- 8.2.4. Other Equipment
- 8.3. Market Analysis, Insights and Forecast - by Distribution Channel
- 8.3.1. Offline Retail Stores
- 8.3.2. Online Retail Stores
- 8.1. Market Analysis, Insights and Forecast - by Type
- 9. Asia Pacific Billiard Pool Industry Analysis, Insights and Forecast, 2020-2032
- 9.1. Market Analysis, Insights and Forecast - by Type
- 9.1.1. Carom
- 9.1.2. Pool
- 9.1.3. Snooker
- 9.2. Market Analysis, Insights and Forecast - by Equipment
- 9.2.1. Table
- 9.2.2. Ball
- 9.2.3. Cue
- 9.2.4. Other Equipment
- 9.3. Market Analysis, Insights and Forecast - by Distribution Channel
- 9.3.1. Offline Retail Stores
- 9.3.2. Online Retail Stores
- 9.1. Market Analysis, Insights and Forecast - by Type
- 10. South America Billiard Pool Industry Analysis, Insights and Forecast, 2020-2032
- 10.1. Market Analysis, Insights and Forecast - by Type
- 10.1.1. Carom
- 10.1.2. Pool
- 10.1.3. Snooker
- 10.2. Market Analysis, Insights and Forecast - by Equipment
- 10.2.1. Table
- 10.2.2. Ball
- 10.2.3. Cue
- 10.2.4. Other Equipment
- 10.3. Market Analysis, Insights and Forecast - by Distribution Channel
- 10.3.1. Offline Retail Stores
- 10.3.2. Online Retail Stores
- 10.1. Market Analysis, Insights and Forecast - by Type
- 11. Middle East and Africa Billiard Pool Industry Analysis, Insights and Forecast, 2020-2032
- 11.1. Market Analysis, Insights and Forecast - by Type
- 11.1.1. Carom
- 11.1.2. Pool
- 11.1.3. Snooker
- 11.2. Market Analysis, Insights and Forecast - by Equipment
- 11.2.1. Table
- 11.2.2. Ball
- 11.2.3. Cue
- 11.2.4. Other Equipment
- 11.3. Market Analysis, Insights and Forecast - by Distribution Channel
- 11.3.1. Offline Retail Stores
- 11.3.2. Online Retail Stores
- 11.1. Market Analysis, Insights and Forecast - by Type
- 12. Competitive Analysis
- 12.1. Company Profiles
- 12.1.1 Yalin International Billiard Goods
- 12.1.1.1. Company Overview
- 12.1.1.2. Products
- 12.1.1.3. Company Financials
- 12.1.1.4. SWOT Analysis
- 12.1.2 Berner Biliards*List Not Exhaustive
- 12.1.2.1. Company Overview
- 12.1.2.2. Products
- 12.1.2.3. Company Financials
- 12.1.2.4. SWOT Analysis
- 12.1.3 Snooker & Pool Table Company Ltd
- 12.1.3.1. Company Overview
- 12.1.3.2. Products
- 12.1.3.3. Company Financials
- 12.1.3.4. SWOT Analysis
- 12.1.4 Franklin Billiard Company
- 12.1.4.1. Company Overview
- 12.1.4.2. Products
- 12.1.4.3. Company Financials
- 12.1.4.4. SWOT Analysis
- 12.1.5 Brunswick Corporation
- 12.1.5.1. Company Overview
- 12.1.5.2. Products
- 12.1.5.3. Company Financials
- 12.1.5.4. SWOT Analysis
- 12.1.6 H Betti Industries Inc
- 12.1.6.1. Company Overview
- 12.1.6.2. Products
- 12.1.6.3. Company Financials
- 12.1.6.4. SWOT Analysis
- 12.1.7 Imperial International
- 12.1.7.1. Company Overview
- 12.1.7.2. Products
- 12.1.7.3. Company Financials
- 12.1.7.4. SWOT Analysis
- 12.1.8 Diamond Billiard Products Inc
- 12.1.8.1. Company Overview
- 12.1.8.2. Products
- 12.1.8.3. Company Financials
- 12.1.8.4. SWOT Analysis
- 12.1.9 Kaldera Billiards
- 12.1.9.1. Company Overview
- 12.1.9.2. Products
- 12.1.9.3. Company Financials
- 12.1.9.4. SWOT Analysis
- 12.1.10 Birmingham Billiards Ltd
- 12.1.10.1. Company Overview
- 12.1.10.2. Products
- 12.1.10.3. Company Financials
- 12.1.10.4. SWOT Analysis
- 12.1.1 Yalin International Billiard Goods
- 12.2. Market Entropy
- 12.2.1 Company's Key Areas Served
- 12.2.2 Recent Developments
- 12.3. Company Market Share Analysis 2025
- 12.3.1 Top 5 Companies Market Share Analysis
- 12.3.2 Top 3 Companies Market Share Analysis
- 12.4. List of Potential Customers
- 13. Research Methodology
List of Figures
- Figure 1: Global Billiard Pool Industry Revenue Breakdown (Million, %) by Region 2025 & 2033
- Figure 2: North America Billiard Pool Industry Revenue (Million), by Type 2025 & 2033
- Figure 3: North America Billiard Pool Industry Revenue Share (%), by Type 2025 & 2033
- Figure 4: North America Billiard Pool Industry Revenue (Million), by Equipment 2025 & 2033
- Figure 5: North America Billiard Pool Industry Revenue Share (%), by Equipment 2025 & 2033
- Figure 6: North America Billiard Pool Industry Revenue (Million), by Distribution Channel 2025 & 2033
- Figure 7: North America Billiard Pool Industry Revenue Share (%), by Distribution Channel 2025 & 2033
- Figure 8: North America Billiard Pool Industry Revenue (Million), by Country 2025 & 2033
- Figure 9: North America Billiard Pool Industry Revenue Share (%), by Country 2025 & 2033
- Figure 10: Europe Billiard Pool Industry Revenue (Million), by Type 2025 & 2033
- Figure 11: Europe Billiard Pool Industry Revenue Share (%), by Type 2025 & 2033
- Figure 12: Europe Billiard Pool Industry Revenue (Million), by Equipment 2025 & 2033
- Figure 13: Europe Billiard Pool Industry Revenue Share (%), by Equipment 2025 & 2033
- Figure 14: Europe Billiard Pool Industry Revenue (Million), by Distribution Channel 2025 & 2033
- Figure 15: Europe Billiard Pool Industry Revenue Share (%), by Distribution Channel 2025 & 2033
- Figure 16: Europe Billiard Pool Industry Revenue (Million), by Country 2025 & 2033
- Figure 17: Europe Billiard Pool Industry Revenue Share (%), by Country 2025 & 2033
- Figure 18: Asia Pacific Billiard Pool Industry Revenue (Million), by Type 2025 & 2033
- Figure 19: Asia Pacific Billiard Pool Industry Revenue Share (%), by Type 2025 & 2033
- Figure 20: Asia Pacific Billiard Pool Industry Revenue (Million), by Equipment 2025 & 2033
- Figure 21: Asia Pacific Billiard Pool Industry Revenue Share (%), by Equipment 2025 & 2033
- Figure 22: Asia Pacific Billiard Pool Industry Revenue (Million), by Distribution Channel 2025 & 2033
- Figure 23: Asia Pacific Billiard Pool Industry Revenue Share (%), by Distribution Channel 2025 & 2033
- Figure 24: Asia Pacific Billiard Pool Industry Revenue (Million), by Country 2025 & 2033
- Figure 25: Asia Pacific Billiard Pool Industry Revenue Share (%), by Country 2025 & 2033
- Figure 26: South America Billiard Pool Industry Revenue (Million), by Type 2025 & 2033
- Figure 27: South America Billiard Pool Industry Revenue Share (%), by Type 2025 & 2033
- Figure 28: South America Billiard Pool Industry Revenue (Million), by Equipment 2025 & 2033
- Figure 29: South America Billiard Pool Industry Revenue Share (%), by Equipment 2025 & 2033
- Figure 30: South America Billiard Pool Industry Revenue (Million), by Distribution Channel 2025 & 2033
- Figure 31: South America Billiard Pool Industry Revenue Share (%), by Distribution Channel 2025 & 2033
- Figure 32: South America Billiard Pool Industry Revenue (Million), by Country 2025 & 2033
- Figure 33: South America Billiard Pool Industry Revenue Share (%), by Country 2025 & 2033
- Figure 34: Middle East and Africa Billiard Pool Industry Revenue (Million), by Type 2025 & 2033
- Figure 35: Middle East and Africa Billiard Pool Industry Revenue Share (%), by Type 2025 & 2033
- Figure 36: Middle East and Africa Billiard Pool Industry Revenue (Million), by Equipment 2025 & 2033
- Figure 37: Middle East and Africa Billiard Pool Industry Revenue Share (%), by Equipment 2025 & 2033
- Figure 38: Middle East and Africa Billiard Pool Industry Revenue (Million), by Distribution Channel 2025 & 2033
- Figure 39: Middle East and Africa Billiard Pool Industry Revenue Share (%), by Distribution Channel 2025 & 2033
- Figure 40: Middle East and Africa Billiard Pool Industry Revenue (Million), by Country 2025 & 2033
- Figure 41: Middle East and Africa Billiard Pool Industry Revenue Share (%), by Country 2025 & 2033
List of Tables
- Table 1: Global Billiard Pool Industry Revenue Million Forecast, by Type 2020 & 2033
- Table 2: Global Billiard Pool Industry Revenue Million Forecast, by Equipment 2020 & 2033
- Table 3: Global Billiard Pool Industry Revenue Million Forecast, by Distribution Channel 2020 & 2033
- Table 4: Global Billiard Pool Industry Revenue Million Forecast, by Region 2020 & 2033
- Table 5: Global Billiard Pool Industry Revenue Million Forecast, by Type 2020 & 2033
- Table 6: Global Billiard Pool Industry Revenue Million Forecast, by Equipment 2020 & 2033
- Table 7: Global Billiard Pool Industry Revenue Million Forecast, by Distribution Channel 2020 & 2033
- Table 8: Global Billiard Pool Industry Revenue Million Forecast, by Country 2020 & 2033
- Table 9: United States Billiard Pool Industry Revenue (Million) Forecast, by Application 2020 & 2033
- Table 10: Canada Billiard Pool Industry Revenue (Million) Forecast, by Application 2020 & 2033
- Table 11: Mexico Billiard Pool Industry Revenue (Million) Forecast, by Application 2020 & 2033
- Table 12: Rest of North America Billiard Pool Industry Revenue (Million) Forecast, by Application 2020 & 2033
- Table 13: Global Billiard Pool Industry Revenue Million Forecast, by Type 2020 & 2033
- Table 14: Global Billiard Pool Industry Revenue Million Forecast, by Equipment 2020 & 2033
- Table 15: Global Billiard Pool Industry Revenue Million Forecast, by Distribution Channel 2020 & 2033
- Table 16: Global Billiard Pool Industry Revenue Million Forecast, by Country 2020 & 2033
- Table 17: Spain Billiard Pool Industry Revenue (Million) Forecast, by Application 2020 & 2033
- Table 18: United Kingdom Billiard Pool Industry Revenue (Million) Forecast, by Application 2020 & 2033
- Table 19: Germany Billiard Pool Industry Revenue (Million) Forecast, by Application 2020 & 2033
- Table 20: France Billiard Pool Industry Revenue (Million) Forecast, by Application 2020 & 2033
- Table 21: Italy Billiard Pool Industry Revenue (Million) Forecast, by Application 2020 & 2033
- Table 22: Belgium Billiard Pool Industry Revenue (Million) Forecast, by Application 2020 & 2033
- Table 23: Rest of Europe Billiard Pool Industry Revenue (Million) Forecast, by Application 2020 & 2033
- Table 24: Global Billiard Pool Industry Revenue Million Forecast, by Type 2020 & 2033
- Table 25: Global Billiard Pool Industry Revenue Million Forecast, by Equipment 2020 & 2033
- Table 26: Global Billiard Pool Industry Revenue Million Forecast, by Distribution Channel 2020 & 2033
- Table 27: Global Billiard Pool Industry Revenue Million Forecast, by Country 2020 & 2033
- Table 28: China Billiard Pool Industry Revenue (Million) Forecast, by Application 2020 & 2033
- Table 29: Japan Billiard Pool Industry Revenue (Million) Forecast, by Application 2020 & 2033
- Table 30: India Billiard Pool Industry Revenue (Million) Forecast, by Application 2020 & 2033
- Table 31: Australia Billiard Pool Industry Revenue (Million) Forecast, by Application 2020 & 2033
- Table 32: Rest of Asia Pacific Billiard Pool Industry Revenue (Million) Forecast, by Application 2020 & 2033
- Table 33: Global Billiard Pool Industry Revenue Million Forecast, by Type 2020 & 2033
- Table 34: Global Billiard Pool Industry Revenue Million Forecast, by Equipment 2020 & 2033
- Table 35: Global Billiard Pool Industry Revenue Million Forecast, by Distribution Channel 2020 & 2033
- Table 36: Global Billiard Pool Industry Revenue Million Forecast, by Country 2020 & 2033
- Table 37: Brazil Billiard Pool Industry Revenue (Million) Forecast, by Application 2020 & 2033
- Table 38: Argentina Billiard Pool Industry Revenue (Million) Forecast, by Application 2020 & 2033
- Table 39: Rest of South America Billiard Pool Industry Revenue (Million) Forecast, by Application 2020 & 2033
- Table 40: Global Billiard Pool Industry Revenue Million Forecast, by Type 2020 & 2033
- Table 41: Global Billiard Pool Industry Revenue Million Forecast, by Equipment 2020 & 2033
- Table 42: Global Billiard Pool Industry Revenue Million Forecast, by Distribution Channel 2020 & 2033
- Table 43: Global Billiard Pool Industry Revenue Million Forecast, by Country 2020 & 2033
- Table 44: South Africa Billiard Pool Industry Revenue (Million) Forecast, by Application 2020 & 2033
- Table 45: United Arab Emirates Billiard Pool Industry Revenue (Million) Forecast, by Application 2020 & 2033
- Table 46: Rest of Middle East and Africa Billiard Pool Industry Revenue (Million) Forecast, by Application 2020 & 2033
Frequently Asked Questions
1. What is the projected Compound Annual Growth Rate (CAGR) of the Billiard Pool Industry?
The projected CAGR is approximately 2.93%.
2. Which companies are prominent players in the Billiard Pool Industry?
Key companies in the market include Yalin International Billiard Goods, Berner Biliards*List Not Exhaustive, Snooker & Pool Table Company Ltd, Franklin Billiard Company, Brunswick Corporation, H Betti Industries Inc, Imperial International, Diamond Billiard Products Inc, Kaldera Billiards, Birmingham Billiards Ltd.
3. What are the main segments of the Billiard Pool Industry?
The market segments include Type, Equipment, Distribution Channel.
4. Can you provide details about the market size?
The market size is estimated to be USD 344.06 Million as of 2022.
5. What are some drivers contributing to market growth?
Aggressive Social Media Marketing; Lower-risk Factor Associated with the Use of E-Cigarettes Compared to Conventional/Combustible Cigarettes.
6. What are the notable trends driving market growth?
Increased Sports Participation Propelling the Billiards and Pools Equipment Sales.
7. Are there any restraints impacting market growth?
Government Initiatives to Ban Disposable E-Cigarettes.
8. Can you provide examples of recent developments in the market?
In October 2022, Sawyer Twain launched a new line of Nixon Billiards to the North American market. Featured in the Nixon Billiards line are the Desyn, a mid-century modern table; the prominent Kai table; and the Birdy, a contemporary chic billiards table with a carefully crafted refectory design that stands alone in being the first of its kind with modern tapered rails.
9. What pricing options are available for accessing the report?
Pricing options include single-user, multi-user, and enterprise licenses priced at USD 4750, USD 5250, and USD 8750 respectively.
10. Is the market size provided in terms of value or volume?
The market size is provided in terms of value, measured in Million.
11. Are there any specific market keywords associated with the report?
Yes, the market keyword associated with the report is "Billiard Pool Industry," which aids in identifying and referencing the specific market segment covered.
12. How do I determine which pricing option suits my needs best?
The pricing options vary based on user requirements and access needs. Individual users may opt for single-user licenses, while businesses requiring broader access may choose multi-user or enterprise licenses for cost-effective access to the report.
13. Are there any additional resources or data provided in the Billiard Pool Industry report?
While the report offers comprehensive insights, it's advisable to review the specific contents or supplementary materials provided to ascertain if additional resources or data are available.
14. How can I stay updated on further developments or reports in the Billiard Pool Industry?
To stay informed about further developments, trends, and reports in the Billiard Pool Industry, consider subscribing to industry newsletters, following relevant companies and organizations, or regularly checking reputable industry news sources and publications.
Methodology
Step 1 - Identification of Relevant Samples Size from Population Database


Step 2 - Approaches for Defining Global Market Size (Value, Volume* & Price*)

Note*: In applicable scenarios
Step 3 - Data Sources
Primary Research
- Web Analytics
- Survey Reports
- Research Institute
- Latest Research Reports
- Opinion Leaders
Secondary Research
- Annual Reports
- White Paper
- Latest Press Release
- Industry Association
- Paid Database
- Investor Presentations

Step 4 - Data Triangulation
Involves using different sources of information in order to increase the validity of a study
These sources are likely to be stakeholders in a program - participants, other researchers, program staff, other community members, and so on.
Then we put all data in single framework & apply various statistical tools to find out the dynamic on the market.
During the analysis stage, feedback from the stakeholder groups would be compared to determine areas of agreement as well as areas of divergence