

Key Insights
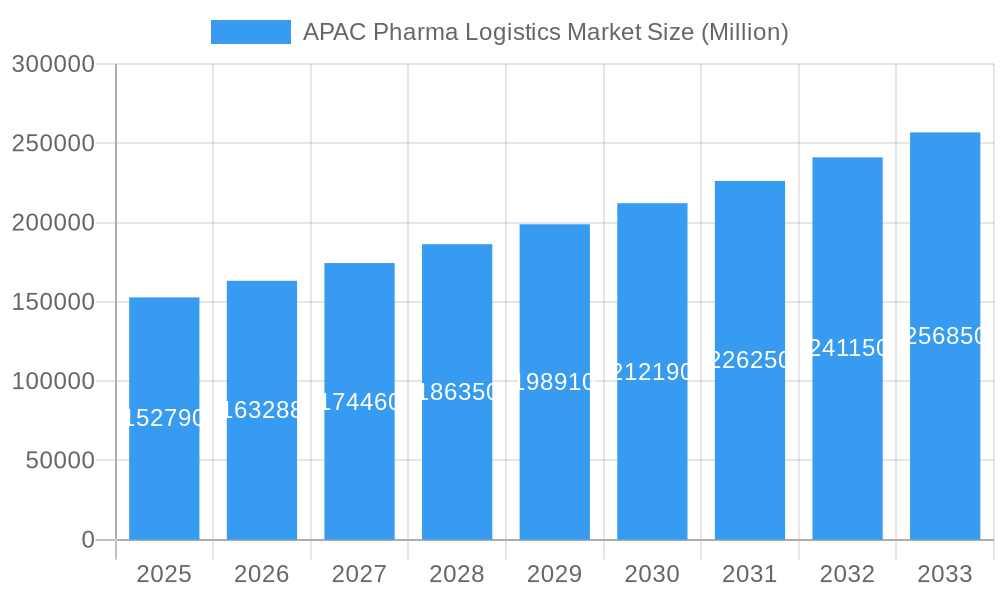
The Asia-Pacific (APAC) pharma logistics market, valued at $152.79 billion in 2025, is poised for robust growth, exhibiting a Compound Annual Growth Rate (CAGR) of 6.68% from 2025 to 2033. This expansion is driven by several key factors. The region's burgeoning pharmaceutical industry, fueled by increasing healthcare expenditure and a rising prevalence of chronic diseases, is a major catalyst. Furthermore, the growing demand for temperature-sensitive pharmaceuticals, particularly biologics, necessitates sophisticated cold chain logistics solutions, contributing significantly to market growth. Stringent regulatory frameworks and a rising focus on pharmaceutical product safety and efficacy are also influencing the adoption of advanced logistics technologies and services. The market is segmented by product type (generic and branded drugs), mode of operation (cold chain and non-cold chain), application (biopharma, chemical pharma, specialized pharma), and mode of transport (air, rail, road, sea). China, India, and Japan are expected to be the leading contributors to market growth, driven by their large populations, expanding healthcare infrastructure, and increasing investments in pharmaceutical manufacturing and research.
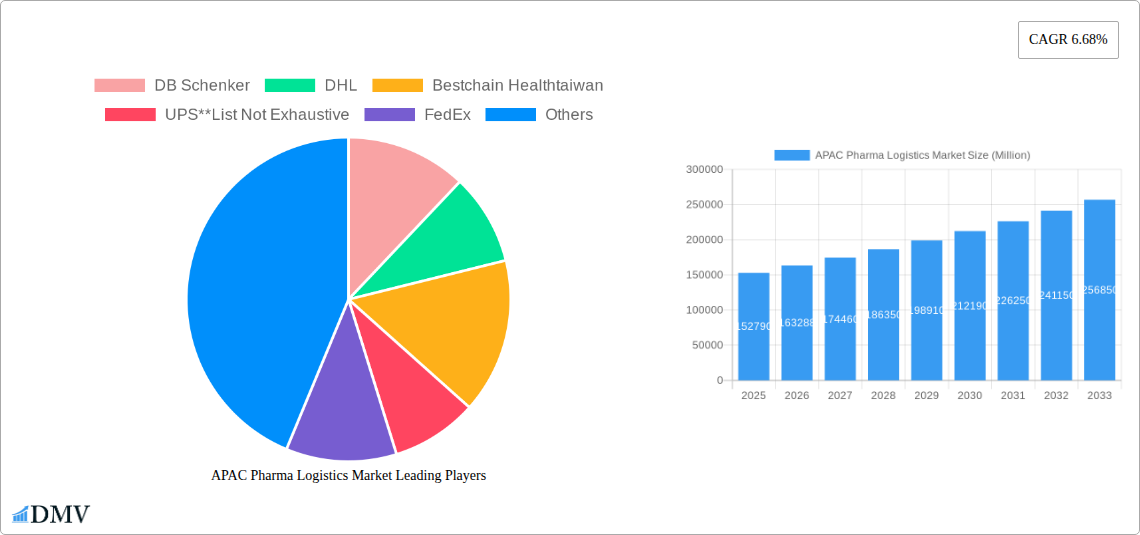
APAC Pharma Logistics Market Market Size (In Billion)
The competitive landscape is characterized by a mix of global and regional players, including DB Schenker, DHL, UPS, FedEx, and others. These companies are continuously investing in infrastructure, technology, and expertise to meet the evolving demands of the pharma logistics sector. Strategic partnerships and mergers and acquisitions are likely to shape the market dynamics in the coming years. The market's growth is also influenced by ongoing technological advancements, such as the integration of IoT devices for real-time monitoring and data analytics capabilities to ensure product integrity and enhance supply chain efficiency. However, challenges remain, including infrastructure limitations in some regions and the need for continuous regulatory compliance. Overcoming these hurdles will be crucial for sustained market growth and the delivery of high-quality, reliable pharmaceutical products across the APAC region.
APAC Pharma Logistics Market Company Market Share
APAC Pharma Logistics Market: A Comprehensive Report (2019-2033)
This insightful report provides a detailed analysis of the Asia-Pacific Pharma Logistics Market, offering crucial data and forecasts for stakeholders across the pharmaceutical supply chain. With a study period spanning 2019-2033, a base year of 2025, and an estimated year of 2025, this report illuminates the market's current state and future trajectory. The forecast period covers 2025-2033, while the historical period analyzed is 2019-2024. The report's value lies in its comprehensive coverage, encompassing market segmentation, leading players, key trends, and future opportunities within the dynamic APAC pharmaceutical landscape. The market size in 2025 is estimated at xx Million USD, and is expected to reach xx Million USD by 2033.
APAC Pharma Logistics Market Composition & Trends
This section delves into the intricate structure of the APAC pharma logistics market, examining market concentration, innovation drivers, regulatory frameworks, substitute products, end-user profiles, and merger & acquisition (M&A) activities. We analyze the market share distribution amongst key players, revealing a moderately consolidated landscape with significant potential for disruption. The report features quantitative analysis of M&A deal values, highlighting strategic shifts within the industry.
Market Concentration: The APAC pharma logistics market exhibits a moderately concentrated structure, with a few major players holding significant market share. However, the presence of numerous smaller, specialized firms indicates opportunities for both consolidation and niche market penetration. The top 5 players are estimated to hold xx% of the market share in 2025.
Innovation Catalysts: Technological advancements, particularly in cold chain logistics and digitalization, are driving significant innovation. This includes the adoption of IoT devices, AI-powered route optimization, and blockchain for enhanced supply chain transparency.
Regulatory Landscape: Stringent regulatory requirements regarding drug handling and storage, especially for temperature-sensitive pharmaceuticals, present both challenges and opportunities for logistics providers. Compliance necessitates investment in advanced technologies and infrastructure.
Substitute Products & Services: The emergence of innovative logistics solutions and alternative transportation methods is shaping the competitive landscape. The report analyzes the impact of these substitutes on market share dynamics and pricing strategies.
End-User Profiles: The report profiles key end-users, including pharmaceutical manufacturers, distributors, hospitals, and pharmacies, analyzing their specific logistics requirements and preferences.
M&A Activities: The APAC pharma logistics market has witnessed considerable M&A activity in recent years, driven by consolidation trends and expansion strategies. The total value of M&A deals in the historical period (2019-2024) is estimated at xx Million USD.
APAC Pharma Logistics Market Industry Evolution
This section provides a comprehensive analysis of the APAC pharma logistics market's growth trajectory, encompassing technological advancements and shifts in consumer demands. It uses quantitative data and qualitative insights to explain the market’s dynamic evolution over the study period (2019-2033). The analysis highlights the interplay of macroeconomic factors, technological disruptions, and evolving regulatory landscapes impacting the market's evolution. The CAGR for the forecast period is projected at xx%. Specific data points concerning growth rates and adoption metrics for key technologies are incorporated, enabling a granular understanding of market dynamics.
Leading Regions, Countries, or Segments in APAC Pharma Logistics Market
This section identifies the dominant regions, countries, and market segments within the APAC pharma logistics market. It examines the factors driving the dominance of specific segments and regions, including investment trends and regulatory support.
- By Product: The branded drugs segment is expected to dominate in 2025 due to higher value and stringent logistics requirements.
- By Mode of Operation: Cold chain transport accounts for a larger market share due to the increasing demand for temperature-sensitive pharmaceutical products.
- By Application: The Biopharma segment is likely to witness significant growth owing to the rising demand for biologics and specialized therapies.
- By Mode of Transport: Air freight is projected as the dominant mode of transport due to speed and reliability, especially for time-sensitive shipments.
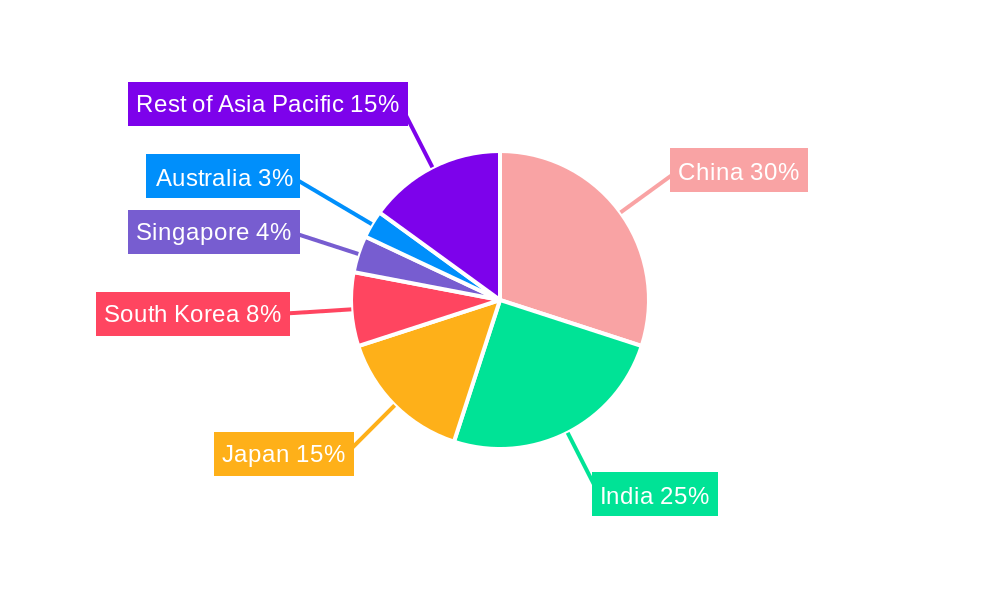
Dominance Factors: Several factors are analyzed in detail, including regulatory frameworks, infrastructure development, economic growth, and healthcare spending patterns. The growth of the pharmaceutical industry in specific countries, such as China and India, is explored as a key driver of market dominance in certain regions.
APAC Pharma Logistics Market Product Innovations
The APAC pharma logistics market is characterized by continuous product innovation, driven by the need for enhanced efficiency, safety, and traceability in pharmaceutical transportation and storage. This includes advancements in temperature-controlled packaging, real-time monitoring systems, and automated warehouse management solutions. These innovations address crucial aspects of pharmaceutical logistics, improving cold chain integrity and enhancing overall operational efficiency. These technological advancements lead to improved product quality, reduced losses, and heightened customer satisfaction.
Propelling Factors for APAC Pharma Logistics Market Growth
Several factors contribute to the expansion of the APAC pharma logistics market. Firstly, the increasing prevalence of chronic diseases fuels demand for pharmaceuticals, escalating logistics requirements. Secondly, growing investments in healthcare infrastructure, coupled with favorable government policies, create a fertile ground for market expansion. Finally, technological advancements, such as automation and digitalization, enhance efficiency and supply chain visibility, further boosting market growth.
Obstacles in the APAC Pharma Logistics Market
The APAC pharma logistics market faces significant challenges. Stringent regulatory compliance demands substantial investment in infrastructure and technology, potentially hindering smaller players. Supply chain disruptions caused by geopolitical instability and natural disasters pose operational risks. Intense competition, especially from established multinational logistics firms, creates pressure on pricing and margins.
Future Opportunities in APAC Pharma Logistics Market
The APAC pharma logistics market presents promising opportunities for growth. Expansion into underserved rural areas holds immense potential, particularly with the growing adoption of e-commerce in healthcare. The development and adoption of innovative technologies such as AI, blockchain, and drone delivery can reshape logistics operations, generating cost savings and improvements in efficiency. Furthermore, the growth of the pharmaceutical industry, fueled by an aging population and rising healthcare expenditure, opens opportunities for specialized pharma logistics solutions.
Major Players in the APAC Pharma Logistics Market Ecosystem
- DB Schenker
- DHL
- Bestchain Healthtaiwan
- UPS
- FedEx
- CEVA Logistics
- Genco
- Kuehne + Nagel
- Mainfreight Ltd
- Bio Pharma Logistics
- Kerry Logistics
- Thermotraffic
- DSV Panalpina
- Arich Enterprise Co Ltd
Key Developments in APAC Pharma Logistics Market Industry
December 2022: DHL Supply Chain announced a EUR 10 million (USD 10,515,247.11) investment to expand its Northern Taiwan plant over five years, focusing on LSHC and semiconductor logistics. This includes a new distribution center in Taoyuan.
August 2022: Nippon Express launched a Healthcare Branch in Shanghai to strengthen its presence in China's pharmaceutical sector.
Strategic APAC Pharma Logistics Market Forecast
The APAC pharma logistics market is poised for robust growth, driven by increasing pharmaceutical consumption, technological advancements, and favorable regulatory support. The market's future trajectory is strongly influenced by factors such as rising healthcare expenditure, expansion of e-commerce in healthcare, and the ongoing adoption of innovative technologies such as AI and blockchain within the supply chain. These factors collectively contribute to a positive outlook for the market, with significant opportunities for both established players and new entrants.
APAC Pharma Logistics Market Segmentation
-
1. Product
- 1.1. Generic Drugs
- 1.2. Branded Drugs
-
2. Mode of Operation
- 2.1. Cold Chain Transport
- 2.2. Non-Cold Chain Transport
-
3. Application
- 3.1. Bio Pharma
- 3.2. Chemical Pharma
- 3.3. Specialized Pharma
-
4. Mode of Transport
- 4.1. Air
- 4.2. Rail
- 4.3. Road
- 4.4. Sea
-
5. Geography
- 5.1. China
- 5.2. India
- 5.3. Japan
- 5.4. South Korea
- 5.5. Singapore
- 5.6. Australia
- 5.7. Rest of Asia Pacific
APAC Pharma Logistics Market Segmentation By Geography
- 1. China
- 2. India
- 3. Japan
- 4. South Korea
- 5. Singapore
- 6. Australia
- 7. Rest of Asia Pacific
APAC Pharma Logistics Market Regional Market Share
Geographic Coverage of APAC Pharma Logistics Market
APAC Pharma Logistics Market REPORT HIGHLIGHTS
| Aspects | Details |
|---|---|
| Study Period | 2020-2034 |
| Base Year | 2025 |
| Estimated Year | 2026 |
| Forecast Period | 2026-2034 |
| Historical Period | 2020-2025 |
| Growth Rate | CAGR of 6.68% from 2020-2034 |
| Segmentation |
|
Table of Contents
- 1. Introduction
- 1.1. Research Scope
- 1.2. Market Segmentation
- 1.3. Research Objective
- 1.4. Definitions and Assumptions
- 2. Executive Summary
- 2.1. Market Snapshot
- 3. Market Dynamics
- 3.1. Market Drivers
- 3.2. Market Restrains
- 3.3. Market Trends
- 3.4. Market Opportunities
- 4. Market Factor Analysis
- 4.1. Porters Five Forces
- 4.1.1. Bargaining Power of Suppliers
- 4.1.2. Bargaining Power of Buyers
- 4.1.3. Threat of New Entrants
- 4.1.4. Threat of Substitutes
- 4.1.5. Competitive Rivalry
- 4.2. PESTEL analysis
- 4.3. BCG Analysis
- 4.3.1. Stars (High Growth, High Market Share)
- 4.3.2. Cash Cows (Low Growth, High Market Share)
- 4.3.3. Question Mark (High Growth, Low Market Share)
- 4.3.4. Dogs (Low Growth, Low Market Share)
- 4.4. Ansoff Matrix Analysis
- 4.5. Supply Chain Analysis
- 4.6. Regulatory Landscape
- 4.7. Current Market Potential and Opportunity Assessment (TAM–SAM–SOM Framework)
- 4.8. DMV Analyst Note
- 4.1. Porters Five Forces
- 5. Market Analysis, Insights and Forecast 2021-2033
- 5.1. Market Analysis, Insights and Forecast - by Product
- 5.1.1. Generic Drugs
- 5.1.2. Branded Drugs
- 5.2. Market Analysis, Insights and Forecast - by Mode of Operation
- 5.2.1. Cold Chain Transport
- 5.2.2. Non-Cold Chain Transport
- 5.3. Market Analysis, Insights and Forecast - by Application
- 5.3.1. Bio Pharma
- 5.3.2. Chemical Pharma
- 5.3.3. Specialized Pharma
- 5.4. Market Analysis, Insights and Forecast - by Mode of Transport
- 5.4.1. Air
- 5.4.2. Rail
- 5.4.3. Road
- 5.4.4. Sea
- 5.5. Market Analysis, Insights and Forecast - by Geography
- 5.5.1. China
- 5.5.2. India
- 5.5.3. Japan
- 5.5.4. South Korea
- 5.5.5. Singapore
- 5.5.6. Australia
- 5.5.7. Rest of Asia Pacific
- 5.6. Market Analysis, Insights and Forecast - by Region
- 5.6.1. China
- 5.6.2. India
- 5.6.3. Japan
- 5.6.4. South Korea
- 5.6.5. Singapore
- 5.6.6. Australia
- 5.6.7. Rest of Asia Pacific
- 5.1. Market Analysis, Insights and Forecast - by Product
- 6. Global APAC Pharma Logistics Market Analysis, Insights and Forecast, 2021-2033
- 6.1. Market Analysis, Insights and Forecast - by Product
- 6.1.1. Generic Drugs
- 6.1.2. Branded Drugs
- 6.2. Market Analysis, Insights and Forecast - by Mode of Operation
- 6.2.1. Cold Chain Transport
- 6.2.2. Non-Cold Chain Transport
- 6.3. Market Analysis, Insights and Forecast - by Application
- 6.3.1. Bio Pharma
- 6.3.2. Chemical Pharma
- 6.3.3. Specialized Pharma
- 6.4. Market Analysis, Insights and Forecast - by Mode of Transport
- 6.4.1. Air
- 6.4.2. Rail
- 6.4.3. Road
- 6.4.4. Sea
- 6.5. Market Analysis, Insights and Forecast - by Geography
- 6.5.1. China
- 6.5.2. India
- 6.5.3. Japan
- 6.5.4. South Korea
- 6.5.5. Singapore
- 6.5.6. Australia
- 6.5.7. Rest of Asia Pacific
- 6.1. Market Analysis, Insights and Forecast - by Product
- 7. China APAC Pharma Logistics Market Analysis, Insights and Forecast, 2020-2032
- 7.1. Market Analysis, Insights and Forecast - by Product
- 7.1.1. Generic Drugs
- 7.1.2. Branded Drugs
- 7.2. Market Analysis, Insights and Forecast - by Mode of Operation
- 7.2.1. Cold Chain Transport
- 7.2.2. Non-Cold Chain Transport
- 7.3. Market Analysis, Insights and Forecast - by Application
- 7.3.1. Bio Pharma
- 7.3.2. Chemical Pharma
- 7.3.3. Specialized Pharma
- 7.4. Market Analysis, Insights and Forecast - by Mode of Transport
- 7.4.1. Air
- 7.4.2. Rail
- 7.4.3. Road
- 7.4.4. Sea
- 7.5. Market Analysis, Insights and Forecast - by Geography
- 7.5.1. China
- 7.5.2. India
- 7.5.3. Japan
- 7.5.4. South Korea
- 7.5.5. Singapore
- 7.5.6. Australia
- 7.5.7. Rest of Asia Pacific
- 7.1. Market Analysis, Insights and Forecast - by Product
- 8. India APAC Pharma Logistics Market Analysis, Insights and Forecast, 2020-2032
- 8.1. Market Analysis, Insights and Forecast - by Product
- 8.1.1. Generic Drugs
- 8.1.2. Branded Drugs
- 8.2. Market Analysis, Insights and Forecast - by Mode of Operation
- 8.2.1. Cold Chain Transport
- 8.2.2. Non-Cold Chain Transport
- 8.3. Market Analysis, Insights and Forecast - by Application
- 8.3.1. Bio Pharma
- 8.3.2. Chemical Pharma
- 8.3.3. Specialized Pharma
- 8.4. Market Analysis, Insights and Forecast - by Mode of Transport
- 8.4.1. Air
- 8.4.2. Rail
- 8.4.3. Road
- 8.4.4. Sea
- 8.5. Market Analysis, Insights and Forecast - by Geography
- 8.5.1. China
- 8.5.2. India
- 8.5.3. Japan
- 8.5.4. South Korea
- 8.5.5. Singapore
- 8.5.6. Australia
- 8.5.7. Rest of Asia Pacific
- 8.1. Market Analysis, Insights and Forecast - by Product
- 9. Japan APAC Pharma Logistics Market Analysis, Insights and Forecast, 2020-2032
- 9.1. Market Analysis, Insights and Forecast - by Product
- 9.1.1. Generic Drugs
- 9.1.2. Branded Drugs
- 9.2. Market Analysis, Insights and Forecast - by Mode of Operation
- 9.2.1. Cold Chain Transport
- 9.2.2. Non-Cold Chain Transport
- 9.3. Market Analysis, Insights and Forecast - by Application
- 9.3.1. Bio Pharma
- 9.3.2. Chemical Pharma
- 9.3.3. Specialized Pharma
- 9.4. Market Analysis, Insights and Forecast - by Mode of Transport
- 9.4.1. Air
- 9.4.2. Rail
- 9.4.3. Road
- 9.4.4. Sea
- 9.5. Market Analysis, Insights and Forecast - by Geography
- 9.5.1. China
- 9.5.2. India
- 9.5.3. Japan
- 9.5.4. South Korea
- 9.5.5. Singapore
- 9.5.6. Australia
- 9.5.7. Rest of Asia Pacific
- 9.1. Market Analysis, Insights and Forecast - by Product
- 10. South Korea APAC Pharma Logistics Market Analysis, Insights and Forecast, 2020-2032
- 10.1. Market Analysis, Insights and Forecast - by Product
- 10.1.1. Generic Drugs
- 10.1.2. Branded Drugs
- 10.2. Market Analysis, Insights and Forecast - by Mode of Operation
- 10.2.1. Cold Chain Transport
- 10.2.2. Non-Cold Chain Transport
- 10.3. Market Analysis, Insights and Forecast - by Application
- 10.3.1. Bio Pharma
- 10.3.2. Chemical Pharma
- 10.3.3. Specialized Pharma
- 10.4. Market Analysis, Insights and Forecast - by Mode of Transport
- 10.4.1. Air
- 10.4.2. Rail
- 10.4.3. Road
- 10.4.4. Sea
- 10.5. Market Analysis, Insights and Forecast - by Geography
- 10.5.1. China
- 10.5.2. India
- 10.5.3. Japan
- 10.5.4. South Korea
- 10.5.5. Singapore
- 10.5.6. Australia
- 10.5.7. Rest of Asia Pacific
- 10.1. Market Analysis, Insights and Forecast - by Product
- 11. Singapore APAC Pharma Logistics Market Analysis, Insights and Forecast, 2020-2032
- 11.1. Market Analysis, Insights and Forecast - by Product
- 11.1.1. Generic Drugs
- 11.1.2. Branded Drugs
- 11.2. Market Analysis, Insights and Forecast - by Mode of Operation
- 11.2.1. Cold Chain Transport
- 11.2.2. Non-Cold Chain Transport
- 11.3. Market Analysis, Insights and Forecast - by Application
- 11.3.1. Bio Pharma
- 11.3.2. Chemical Pharma
- 11.3.3. Specialized Pharma
- 11.4. Market Analysis, Insights and Forecast - by Mode of Transport
- 11.4.1. Air
- 11.4.2. Rail
- 11.4.3. Road
- 11.4.4. Sea
- 11.5. Market Analysis, Insights and Forecast - by Geography
- 11.5.1. China
- 11.5.2. India
- 11.5.3. Japan
- 11.5.4. South Korea
- 11.5.5. Singapore
- 11.5.6. Australia
- 11.5.7. Rest of Asia Pacific
- 11.1. Market Analysis, Insights and Forecast - by Product
- 12. Australia APAC Pharma Logistics Market Analysis, Insights and Forecast, 2020-2032
- 12.1. Market Analysis, Insights and Forecast - by Product
- 12.1.1. Generic Drugs
- 12.1.2. Branded Drugs
- 12.2. Market Analysis, Insights and Forecast - by Mode of Operation
- 12.2.1. Cold Chain Transport
- 12.2.2. Non-Cold Chain Transport
- 12.3. Market Analysis, Insights and Forecast - by Application
- 12.3.1. Bio Pharma
- 12.3.2. Chemical Pharma
- 12.3.3. Specialized Pharma
- 12.4. Market Analysis, Insights and Forecast - by Mode of Transport
- 12.4.1. Air
- 12.4.2. Rail
- 12.4.3. Road
- 12.4.4. Sea
- 12.5. Market Analysis, Insights and Forecast - by Geography
- 12.5.1. China
- 12.5.2. India
- 12.5.3. Japan
- 12.5.4. South Korea
- 12.5.5. Singapore
- 12.5.6. Australia
- 12.5.7. Rest of Asia Pacific
- 12.1. Market Analysis, Insights and Forecast - by Product
- 13. Rest of Asia Pacific APAC Pharma Logistics Market Analysis, Insights and Forecast, 2020-2032
- 13.1. Market Analysis, Insights and Forecast - by Product
- 13.1.1. Generic Drugs
- 13.1.2. Branded Drugs
- 13.2. Market Analysis, Insights and Forecast - by Mode of Operation
- 13.2.1. Cold Chain Transport
- 13.2.2. Non-Cold Chain Transport
- 13.3. Market Analysis, Insights and Forecast - by Application
- 13.3.1. Bio Pharma
- 13.3.2. Chemical Pharma
- 13.3.3. Specialized Pharma
- 13.4. Market Analysis, Insights and Forecast - by Mode of Transport
- 13.4.1. Air
- 13.4.2. Rail
- 13.4.3. Road
- 13.4.4. Sea
- 13.5. Market Analysis, Insights and Forecast - by Geography
- 13.5.1. China
- 13.5.2. India
- 13.5.3. Japan
- 13.5.4. South Korea
- 13.5.5. Singapore
- 13.5.6. Australia
- 13.5.7. Rest of Asia Pacific
- 13.1. Market Analysis, Insights and Forecast - by Product
- 14. Competitive Analysis
- 14.1. Company Profiles
- 14.1.1 DB Schenker
- 14.1.1.1. Company Overview
- 14.1.1.2. Products
- 14.1.1.3. Company Financials
- 14.1.1.4. SWOT Analysis
- 14.1.2 DHL
- 14.1.2.1. Company Overview
- 14.1.2.2. Products
- 14.1.2.3. Company Financials
- 14.1.2.4. SWOT Analysis
- 14.1.3 Bestchain Healthtaiwan
- 14.1.3.1. Company Overview
- 14.1.3.2. Products
- 14.1.3.3. Company Financials
- 14.1.3.4. SWOT Analysis
- 14.1.4 UPS**List Not Exhaustive
- 14.1.4.1. Company Overview
- 14.1.4.2. Products
- 14.1.4.3. Company Financials
- 14.1.4.4. SWOT Analysis
- 14.1.5 FedEx
- 14.1.5.1. Company Overview
- 14.1.5.2. Products
- 14.1.5.3. Company Financials
- 14.1.5.4. SWOT Analysis
- 14.1.6 CEVA Logistics
- 14.1.6.1. Company Overview
- 14.1.6.2. Products
- 14.1.6.3. Company Financials
- 14.1.6.4. SWOT Analysis
- 14.1.7 Genco
- 14.1.7.1. Company Overview
- 14.1.7.2. Products
- 14.1.7.3. Company Financials
- 14.1.7.4. SWOT Analysis
- 14.1.8 Kuehne + Nagel
- 14.1.8.1. Company Overview
- 14.1.8.2. Products
- 14.1.8.3. Company Financials
- 14.1.8.4. SWOT Analysis
- 14.1.9 Mainfreight Ltd
- 14.1.9.1. Company Overview
- 14.1.9.2. Products
- 14.1.9.3. Company Financials
- 14.1.9.4. SWOT Analysis
- 14.1.10 Bio Pharma Logistics
- 14.1.10.1. Company Overview
- 14.1.10.2. Products
- 14.1.10.3. Company Financials
- 14.1.10.4. SWOT Analysis
- 14.1.11 Kerry Logistics
- 14.1.11.1. Company Overview
- 14.1.11.2. Products
- 14.1.11.3. Company Financials
- 14.1.11.4. SWOT Analysis
- 14.1.12 Thermotraffic
- 14.1.12.1. Company Overview
- 14.1.12.2. Products
- 14.1.12.3. Company Financials
- 14.1.12.4. SWOT Analysis
- 14.1.13 DSV Panalpina
- 14.1.13.1. Company Overview
- 14.1.13.2. Products
- 14.1.13.3. Company Financials
- 14.1.13.4. SWOT Analysis
- 14.1.14 Arich Enterprise Co Ltd
- 14.1.14.1. Company Overview
- 14.1.14.2. Products
- 14.1.14.3. Company Financials
- 14.1.14.4. SWOT Analysis
- 14.1.1 DB Schenker
- 14.2. Market Entropy
- 14.2.1 Company's Key Areas Served
- 14.2.2 Recent Developments
- 14.3. Company Market Share Analysis 2025
- 14.3.1 Top 5 Companies Market Share Analysis
- 14.3.2 Top 3 Companies Market Share Analysis
- 14.4. List of Potential Customers
- 15. Research Methodology
List of Figures
- Figure 1: Global APAC Pharma Logistics Market Revenue Breakdown (Million, %) by Region 2025 & 2033
- Figure 2: China APAC Pharma Logistics Market Revenue (Million), by Product 2025 & 2033
- Figure 3: China APAC Pharma Logistics Market Revenue Share (%), by Product 2025 & 2033
- Figure 4: China APAC Pharma Logistics Market Revenue (Million), by Mode of Operation 2025 & 2033
- Figure 5: China APAC Pharma Logistics Market Revenue Share (%), by Mode of Operation 2025 & 2033
- Figure 6: China APAC Pharma Logistics Market Revenue (Million), by Application 2025 & 2033
- Figure 7: China APAC Pharma Logistics Market Revenue Share (%), by Application 2025 & 2033
- Figure 8: China APAC Pharma Logistics Market Revenue (Million), by Mode of Transport 2025 & 2033
- Figure 9: China APAC Pharma Logistics Market Revenue Share (%), by Mode of Transport 2025 & 2033
- Figure 10: China APAC Pharma Logistics Market Revenue (Million), by Geography 2025 & 2033
- Figure 11: China APAC Pharma Logistics Market Revenue Share (%), by Geography 2025 & 2033
- Figure 12: China APAC Pharma Logistics Market Revenue (Million), by Country 2025 & 2033
- Figure 13: China APAC Pharma Logistics Market Revenue Share (%), by Country 2025 & 2033
- Figure 14: India APAC Pharma Logistics Market Revenue (Million), by Product 2025 & 2033
- Figure 15: India APAC Pharma Logistics Market Revenue Share (%), by Product 2025 & 2033
- Figure 16: India APAC Pharma Logistics Market Revenue (Million), by Mode of Operation 2025 & 2033
- Figure 17: India APAC Pharma Logistics Market Revenue Share (%), by Mode of Operation 2025 & 2033
- Figure 18: India APAC Pharma Logistics Market Revenue (Million), by Application 2025 & 2033
- Figure 19: India APAC Pharma Logistics Market Revenue Share (%), by Application 2025 & 2033
- Figure 20: India APAC Pharma Logistics Market Revenue (Million), by Mode of Transport 2025 & 2033
- Figure 21: India APAC Pharma Logistics Market Revenue Share (%), by Mode of Transport 2025 & 2033
- Figure 22: India APAC Pharma Logistics Market Revenue (Million), by Geography 2025 & 2033
- Figure 23: India APAC Pharma Logistics Market Revenue Share (%), by Geography 2025 & 2033
- Figure 24: India APAC Pharma Logistics Market Revenue (Million), by Country 2025 & 2033
- Figure 25: India APAC Pharma Logistics Market Revenue Share (%), by Country 2025 & 2033
- Figure 26: Japan APAC Pharma Logistics Market Revenue (Million), by Product 2025 & 2033
- Figure 27: Japan APAC Pharma Logistics Market Revenue Share (%), by Product 2025 & 2033
- Figure 28: Japan APAC Pharma Logistics Market Revenue (Million), by Mode of Operation 2025 & 2033
- Figure 29: Japan APAC Pharma Logistics Market Revenue Share (%), by Mode of Operation 2025 & 2033
- Figure 30: Japan APAC Pharma Logistics Market Revenue (Million), by Application 2025 & 2033
- Figure 31: Japan APAC Pharma Logistics Market Revenue Share (%), by Application 2025 & 2033
- Figure 32: Japan APAC Pharma Logistics Market Revenue (Million), by Mode of Transport 2025 & 2033
- Figure 33: Japan APAC Pharma Logistics Market Revenue Share (%), by Mode of Transport 2025 & 2033
- Figure 34: Japan APAC Pharma Logistics Market Revenue (Million), by Geography 2025 & 2033
- Figure 35: Japan APAC Pharma Logistics Market Revenue Share (%), by Geography 2025 & 2033
- Figure 36: Japan APAC Pharma Logistics Market Revenue (Million), by Country 2025 & 2033
- Figure 37: Japan APAC Pharma Logistics Market Revenue Share (%), by Country 2025 & 2033
- Figure 38: South Korea APAC Pharma Logistics Market Revenue (Million), by Product 2025 & 2033
- Figure 39: South Korea APAC Pharma Logistics Market Revenue Share (%), by Product 2025 & 2033
- Figure 40: South Korea APAC Pharma Logistics Market Revenue (Million), by Mode of Operation 2025 & 2033
- Figure 41: South Korea APAC Pharma Logistics Market Revenue Share (%), by Mode of Operation 2025 & 2033
- Figure 42: South Korea APAC Pharma Logistics Market Revenue (Million), by Application 2025 & 2033
- Figure 43: South Korea APAC Pharma Logistics Market Revenue Share (%), by Application 2025 & 2033
- Figure 44: South Korea APAC Pharma Logistics Market Revenue (Million), by Mode of Transport 2025 & 2033
- Figure 45: South Korea APAC Pharma Logistics Market Revenue Share (%), by Mode of Transport 2025 & 2033
- Figure 46: South Korea APAC Pharma Logistics Market Revenue (Million), by Geography 2025 & 2033
- Figure 47: South Korea APAC Pharma Logistics Market Revenue Share (%), by Geography 2025 & 2033
- Figure 48: South Korea APAC Pharma Logistics Market Revenue (Million), by Country 2025 & 2033
- Figure 49: South Korea APAC Pharma Logistics Market Revenue Share (%), by Country 2025 & 2033
- Figure 50: Singapore APAC Pharma Logistics Market Revenue (Million), by Product 2025 & 2033
- Figure 51: Singapore APAC Pharma Logistics Market Revenue Share (%), by Product 2025 & 2033
- Figure 52: Singapore APAC Pharma Logistics Market Revenue (Million), by Mode of Operation 2025 & 2033
- Figure 53: Singapore APAC Pharma Logistics Market Revenue Share (%), by Mode of Operation 2025 & 2033
- Figure 54: Singapore APAC Pharma Logistics Market Revenue (Million), by Application 2025 & 2033
- Figure 55: Singapore APAC Pharma Logistics Market Revenue Share (%), by Application 2025 & 2033
- Figure 56: Singapore APAC Pharma Logistics Market Revenue (Million), by Mode of Transport 2025 & 2033
- Figure 57: Singapore APAC Pharma Logistics Market Revenue Share (%), by Mode of Transport 2025 & 2033
- Figure 58: Singapore APAC Pharma Logistics Market Revenue (Million), by Geography 2025 & 2033
- Figure 59: Singapore APAC Pharma Logistics Market Revenue Share (%), by Geography 2025 & 2033
- Figure 60: Singapore APAC Pharma Logistics Market Revenue (Million), by Country 2025 & 2033
- Figure 61: Singapore APAC Pharma Logistics Market Revenue Share (%), by Country 2025 & 2033
- Figure 62: Australia APAC Pharma Logistics Market Revenue (Million), by Product 2025 & 2033
- Figure 63: Australia APAC Pharma Logistics Market Revenue Share (%), by Product 2025 & 2033
- Figure 64: Australia APAC Pharma Logistics Market Revenue (Million), by Mode of Operation 2025 & 2033
- Figure 65: Australia APAC Pharma Logistics Market Revenue Share (%), by Mode of Operation 2025 & 2033
- Figure 66: Australia APAC Pharma Logistics Market Revenue (Million), by Application 2025 & 2033
- Figure 67: Australia APAC Pharma Logistics Market Revenue Share (%), by Application 2025 & 2033
- Figure 68: Australia APAC Pharma Logistics Market Revenue (Million), by Mode of Transport 2025 & 2033
- Figure 69: Australia APAC Pharma Logistics Market Revenue Share (%), by Mode of Transport 2025 & 2033
- Figure 70: Australia APAC Pharma Logistics Market Revenue (Million), by Geography 2025 & 2033
- Figure 71: Australia APAC Pharma Logistics Market Revenue Share (%), by Geography 2025 & 2033
- Figure 72: Australia APAC Pharma Logistics Market Revenue (Million), by Country 2025 & 2033
- Figure 73: Australia APAC Pharma Logistics Market Revenue Share (%), by Country 2025 & 2033
- Figure 74: Rest of Asia Pacific APAC Pharma Logistics Market Revenue (Million), by Product 2025 & 2033
- Figure 75: Rest of Asia Pacific APAC Pharma Logistics Market Revenue Share (%), by Product 2025 & 2033
- Figure 76: Rest of Asia Pacific APAC Pharma Logistics Market Revenue (Million), by Mode of Operation 2025 & 2033
- Figure 77: Rest of Asia Pacific APAC Pharma Logistics Market Revenue Share (%), by Mode of Operation 2025 & 2033
- Figure 78: Rest of Asia Pacific APAC Pharma Logistics Market Revenue (Million), by Application 2025 & 2033
- Figure 79: Rest of Asia Pacific APAC Pharma Logistics Market Revenue Share (%), by Application 2025 & 2033
- Figure 80: Rest of Asia Pacific APAC Pharma Logistics Market Revenue (Million), by Mode of Transport 2025 & 2033
- Figure 81: Rest of Asia Pacific APAC Pharma Logistics Market Revenue Share (%), by Mode of Transport 2025 & 2033
- Figure 82: Rest of Asia Pacific APAC Pharma Logistics Market Revenue (Million), by Geography 2025 & 2033
- Figure 83: Rest of Asia Pacific APAC Pharma Logistics Market Revenue Share (%), by Geography 2025 & 2033
- Figure 84: Rest of Asia Pacific APAC Pharma Logistics Market Revenue (Million), by Country 2025 & 2033
- Figure 85: Rest of Asia Pacific APAC Pharma Logistics Market Revenue Share (%), by Country 2025 & 2033
List of Tables
- Table 1: Global APAC Pharma Logistics Market Revenue Million Forecast, by Product 2020 & 2033
- Table 2: Global APAC Pharma Logistics Market Revenue Million Forecast, by Mode of Operation 2020 & 2033
- Table 3: Global APAC Pharma Logistics Market Revenue Million Forecast, by Application 2020 & 2033
- Table 4: Global APAC Pharma Logistics Market Revenue Million Forecast, by Mode of Transport 2020 & 2033
- Table 5: Global APAC Pharma Logistics Market Revenue Million Forecast, by Geography 2020 & 2033
- Table 6: Global APAC Pharma Logistics Market Revenue Million Forecast, by Region 2020 & 2033
- Table 7: Global APAC Pharma Logistics Market Revenue Million Forecast, by Product 2020 & 2033
- Table 8: Global APAC Pharma Logistics Market Revenue Million Forecast, by Mode of Operation 2020 & 2033
- Table 9: Global APAC Pharma Logistics Market Revenue Million Forecast, by Application 2020 & 2033
- Table 10: Global APAC Pharma Logistics Market Revenue Million Forecast, by Mode of Transport 2020 & 2033
- Table 11: Global APAC Pharma Logistics Market Revenue Million Forecast, by Geography 2020 & 2033
- Table 12: Global APAC Pharma Logistics Market Revenue Million Forecast, by Country 2020 & 2033
- Table 13: Global APAC Pharma Logistics Market Revenue Million Forecast, by Product 2020 & 2033
- Table 14: Global APAC Pharma Logistics Market Revenue Million Forecast, by Mode of Operation 2020 & 2033
- Table 15: Global APAC Pharma Logistics Market Revenue Million Forecast, by Application 2020 & 2033
- Table 16: Global APAC Pharma Logistics Market Revenue Million Forecast, by Mode of Transport 2020 & 2033
- Table 17: Global APAC Pharma Logistics Market Revenue Million Forecast, by Geography 2020 & 2033
- Table 18: Global APAC Pharma Logistics Market Revenue Million Forecast, by Country 2020 & 2033
- Table 19: Global APAC Pharma Logistics Market Revenue Million Forecast, by Product 2020 & 2033
- Table 20: Global APAC Pharma Logistics Market Revenue Million Forecast, by Mode of Operation 2020 & 2033
- Table 21: Global APAC Pharma Logistics Market Revenue Million Forecast, by Application 2020 & 2033
- Table 22: Global APAC Pharma Logistics Market Revenue Million Forecast, by Mode of Transport 2020 & 2033
- Table 23: Global APAC Pharma Logistics Market Revenue Million Forecast, by Geography 2020 & 2033
- Table 24: Global APAC Pharma Logistics Market Revenue Million Forecast, by Country 2020 & 2033
- Table 25: Global APAC Pharma Logistics Market Revenue Million Forecast, by Product 2020 & 2033
- Table 26: Global APAC Pharma Logistics Market Revenue Million Forecast, by Mode of Operation 2020 & 2033
- Table 27: Global APAC Pharma Logistics Market Revenue Million Forecast, by Application 2020 & 2033
- Table 28: Global APAC Pharma Logistics Market Revenue Million Forecast, by Mode of Transport 2020 & 2033
- Table 29: Global APAC Pharma Logistics Market Revenue Million Forecast, by Geography 2020 & 2033
- Table 30: Global APAC Pharma Logistics Market Revenue Million Forecast, by Country 2020 & 2033
- Table 31: Global APAC Pharma Logistics Market Revenue Million Forecast, by Product 2020 & 2033
- Table 32: Global APAC Pharma Logistics Market Revenue Million Forecast, by Mode of Operation 2020 & 2033
- Table 33: Global APAC Pharma Logistics Market Revenue Million Forecast, by Application 2020 & 2033
- Table 34: Global APAC Pharma Logistics Market Revenue Million Forecast, by Mode of Transport 2020 & 2033
- Table 35: Global APAC Pharma Logistics Market Revenue Million Forecast, by Geography 2020 & 2033
- Table 36: Global APAC Pharma Logistics Market Revenue Million Forecast, by Country 2020 & 2033
- Table 37: Global APAC Pharma Logistics Market Revenue Million Forecast, by Product 2020 & 2033
- Table 38: Global APAC Pharma Logistics Market Revenue Million Forecast, by Mode of Operation 2020 & 2033
- Table 39: Global APAC Pharma Logistics Market Revenue Million Forecast, by Application 2020 & 2033
- Table 40: Global APAC Pharma Logistics Market Revenue Million Forecast, by Mode of Transport 2020 & 2033
- Table 41: Global APAC Pharma Logistics Market Revenue Million Forecast, by Geography 2020 & 2033
- Table 42: Global APAC Pharma Logistics Market Revenue Million Forecast, by Country 2020 & 2033
- Table 43: Global APAC Pharma Logistics Market Revenue Million Forecast, by Product 2020 & 2033
- Table 44: Global APAC Pharma Logistics Market Revenue Million Forecast, by Mode of Operation 2020 & 2033
- Table 45: Global APAC Pharma Logistics Market Revenue Million Forecast, by Application 2020 & 2033
- Table 46: Global APAC Pharma Logistics Market Revenue Million Forecast, by Mode of Transport 2020 & 2033
- Table 47: Global APAC Pharma Logistics Market Revenue Million Forecast, by Geography 2020 & 2033
- Table 48: Global APAC Pharma Logistics Market Revenue Million Forecast, by Country 2020 & 2033
Frequently Asked Questions
1. What is the projected Compound Annual Growth Rate (CAGR) of the APAC Pharma Logistics Market?
The projected CAGR is approximately 6.68%.
2. Which companies are prominent players in the APAC Pharma Logistics Market?
Key companies in the market include DB Schenker, DHL, Bestchain Healthtaiwan, UPS**List Not Exhaustive, FedEx, CEVA Logistics, Genco, Kuehne + Nagel, Mainfreight Ltd, Bio Pharma Logistics, Kerry Logistics, Thermotraffic, DSV Panalpina, Arich Enterprise Co Ltd.
3. What are the main segments of the APAC Pharma Logistics Market?
The market segments include Product, Mode of Operation, Application, Mode of Transport, Geography.
4. Can you provide details about the market size?
The market size is estimated to be USD 152.79 Million as of 2022.
5. What are some drivers contributing to market growth?
Growing Events in E-commerce Sector; Increasing Demand for Qualified Event Logistics Services.
6. What are the notable trends driving market growth?
Cold chain Logistics is driving the market.
7. Are there any restraints impacting market growth?
High Labour Cost; High Pricing.
8. Can you provide examples of recent developments in the market?
December 2022: DHL Supply Chain has disclosed its Northern Taiwan plant growth plans for five years. The investment of EUR 10 million (USD 10515247.1083) would expand DHL Supply Chain's market reach and meet the logistics needs of the LSHC and semiconductor industries. The newly inaugurated Taoyuan Distribution Center-Jian Guo, DHL Supply Chain's second location in Taoyuan, is a part of the development.
9. What pricing options are available for accessing the report?
Pricing options include single-user, multi-user, and enterprise licenses priced at USD 4750, USD 5250, and USD 8750 respectively.
10. Is the market size provided in terms of value or volume?
The market size is provided in terms of value, measured in Million.
11. Are there any specific market keywords associated with the report?
Yes, the market keyword associated with the report is "APAC Pharma Logistics Market," which aids in identifying and referencing the specific market segment covered.
12. How do I determine which pricing option suits my needs best?
The pricing options vary based on user requirements and access needs. Individual users may opt for single-user licenses, while businesses requiring broader access may choose multi-user or enterprise licenses for cost-effective access to the report.
13. Are there any additional resources or data provided in the APAC Pharma Logistics Market report?
While the report offers comprehensive insights, it's advisable to review the specific contents or supplementary materials provided to ascertain if additional resources or data are available.
14. How can I stay updated on further developments or reports in the APAC Pharma Logistics Market?
To stay informed about further developments, trends, and reports in the APAC Pharma Logistics Market, consider subscribing to industry newsletters, following relevant companies and organizations, or regularly checking reputable industry news sources and publications.
Methodology
Step 1 - Identification of Relevant Samples Size from Population Database


Step 2 - Approaches for Defining Global Market Size (Value, Volume* & Price*)

Note*: In applicable scenarios
Step 3 - Data Sources
Primary Research
- Web Analytics
- Survey Reports
- Research Institute
- Latest Research Reports
- Opinion Leaders
Secondary Research
- Annual Reports
- White Paper
- Latest Press Release
- Industry Association
- Paid Database
- Investor Presentations

Step 4 - Data Triangulation
Involves using different sources of information in order to increase the validity of a study
These sources are likely to be stakeholders in a program - participants, other researchers, program staff, other community members, and so on.
Then we put all data in single framework & apply various statistical tools to find out the dynamic on the market.
During the analysis stage, feedback from the stakeholder groups would be compared to determine areas of agreement as well as areas of divergence