

Key Insights
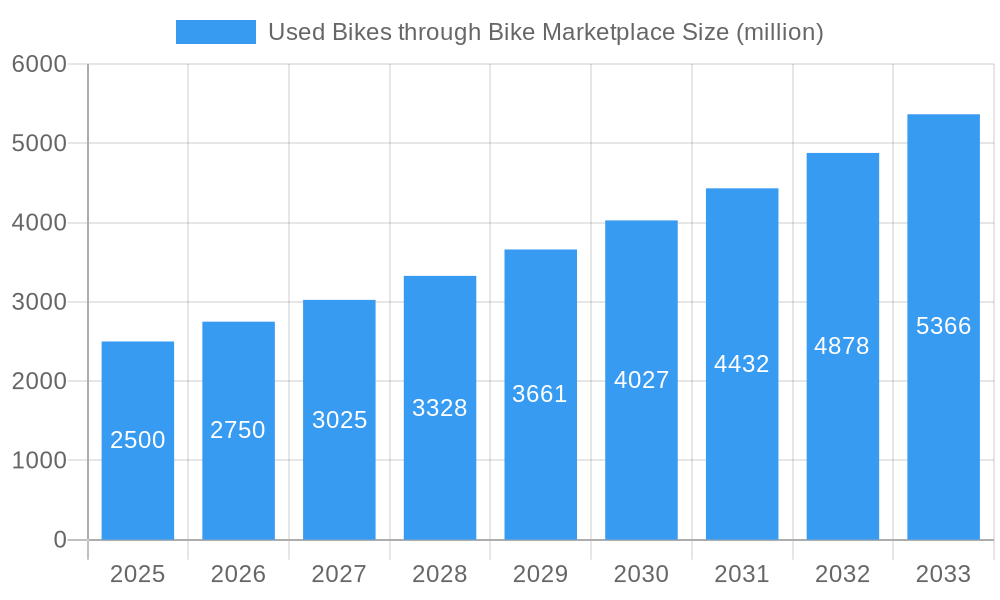
The used motorcycle market, driven by online marketplaces, is experiencing significant expansion. With a projected market size of $4.61 billion in the base year of 2025, this sector's growth is underpinned by major players such as Droom, CredR, BikeDekho, and BikeWale. The increasing adoption of online transactions for vehicles, coupled with the demand for affordable and dependable pre-owned motorcycles, fuels this upward trend. Key growth drivers include rising new motorcycle prices, the appeal of sustainable and economical transportation, and the expanding e-commerce footprint in the automotive industry. Enhanced consumer confidence in online platforms, robust due diligence, and the ease of online comparison further contribute to market vitality.
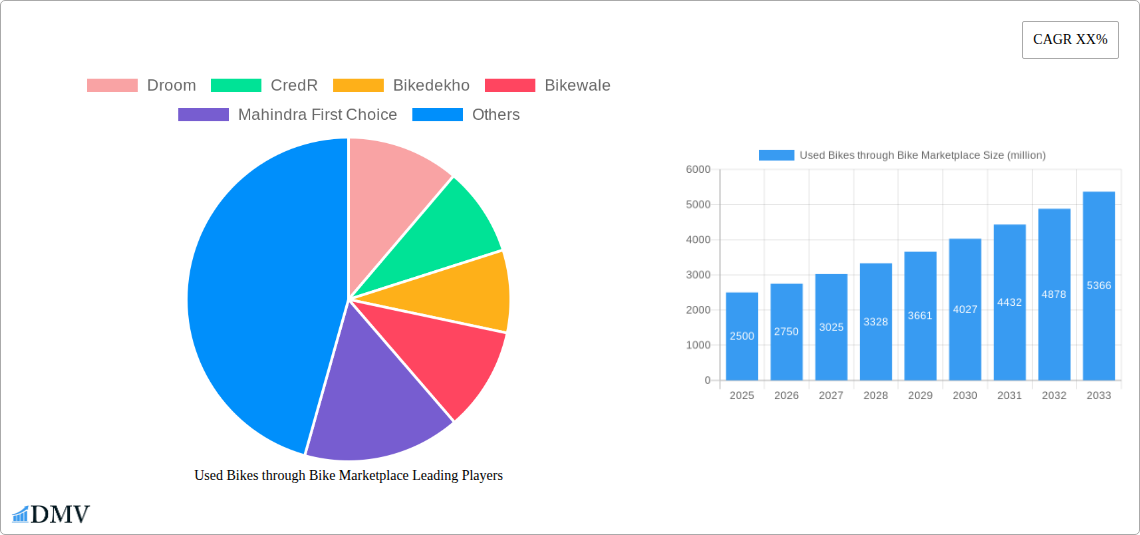
Used Bikes through Bike Marketplace Market Size (In Billion)
By 2033, the market is anticipated to grow at a Compound Annual Growth Rate (CAGR) of 4.53%. Technological advancements in online platforms, such as detailed vehicle history reports and virtual inspections, are expected to propel this growth. However, challenges persist, including the necessity for enhanced regulations to prevent fraudulent listings, the continuous effort to build trust and transparency, and the potential influence of economic volatility. Market segmentation will likely favor popular models, with emerging growth in specialized segments like adventure or electric motorcycles. The competitive landscape, featuring established and new entrants, is set to become increasingly dynamic.
Used Bikes through Bike Marketplace Company Market Share
Used Bikes through Bike Marketplace: A Comprehensive Market Report (2019-2033)
This insightful report provides a detailed analysis of the multi-million dollar used bikes market facilitated through online marketplaces, covering the period from 2019 to 2033. We delve into market composition, industry evolution, leading players, and future opportunities, offering crucial insights for stakeholders seeking to navigate this dynamic sector. The report leverages data from the base year 2025 and forecasts until 2033, incorporating historical data from 2019-2024. Key players analyzed include Droom, CredR, Bikedekho, Bikewale, Mahindra First Choice, Bikers Highway, OLX, Quicker, Used Motorcycle Store, and Bicycle Bluebook.
Used Bikes through Bike Marketplace Market Composition & Trends
This section evaluates the market concentration, innovation drivers, regulatory landscape, substitute products, end-user profiles, and merger & acquisition (M&A) activities within the used bike marketplace. We analyze the market share distribution among major players, revealing a highly competitive landscape with no single dominant entity. The estimated total market size in 2025 is xx million, with an estimated xx million market share held by the top three players.
- Market Concentration: The market displays moderate concentration with several key players vying for market share. The top 5 players account for approximately xx% of the market in 2025.
- Innovation Catalysts: Technological advancements in online platforms, including AI-powered pricing tools and enhanced user interfaces, are driving innovation.
- Regulatory Landscape: Varying regulations across regions concerning used vehicle sales and online transactions influence market dynamics.
- Substitute Products: The primary substitute remains purchasing new bikes, but the used bike market benefits from price sensitivity among consumers.
- End-User Profiles: The primary end-users are budget-conscious buyers and environmentally aware individuals.
- M&A Activities: We identify xx M&A deals in the used bike market during the study period (2019-2024), with a total estimated value of xx million. These transactions often involve consolidation of smaller players and expansion into new geographic areas.
Used Bikes through Bike Marketplace Industry Evolution
The used bikes market through online marketplaces has witnessed significant growth from 2019 to 2024, with a Compound Annual Growth Rate (CAGR) of xx%. This growth is attributed to several factors including increasing affordability, growing environmental awareness, and the convenience of online transactions. Technological advancements, such as improved online platforms and mobile apps, have further fueled this expansion. Consumer demand is shifting towards pre-owned bikes due to their cost-effectiveness, resulting in a surge in online marketplaces dedicated to used bikes.
The forecast period (2025-2033) anticipates a sustained growth trajectory, projected at a CAGR of xx%, driven by the expanding reach of e-commerce, rising disposable incomes in key markets, and a growing preference for sustainable transportation. The adoption rate of online used bike platforms is also projected to increase by xx% annually during the forecast period. Emerging technologies such as blockchain for secure transactions and enhanced data analytics for personalized recommendations are poised to further transform the sector. This will lead to a market size of xx million by 2033.
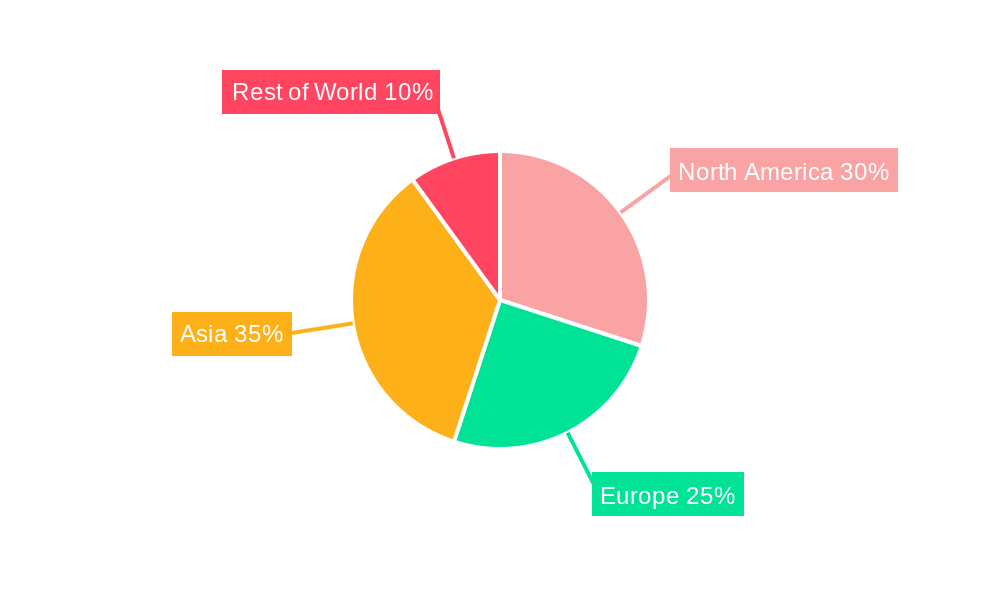
Leading Regions, Countries, or Segments in Used Bikes through Bike Marketplace
- Dominant Region: India currently dominates the used bike marketplace.
Key Drivers for India's Dominance:
- Large and Growing Motorcycle Market: India has one of the largest two-wheeler markets globally, leading to a large pool of used bikes.
- Rising Disposable Incomes: Increasing disposable incomes are boosting demand for affordable transportation options, including used bikes.
- Favorable Regulatory Environment: Supportive governmental policies and efficient logistics networks facilitate the growth of online marketplaces.
- High Penetration of Smartphones and Internet: High smartphone and internet penetration enhances the reach of online platforms.
India's dominance is expected to persist throughout the forecast period, fueled by these strong underlying factors. The report further examines regional variations, highlighting specific market characteristics and growth potentials in other key regions.
Used Bikes through Bike Marketplace Product Innovations
Recent innovations include the integration of AI-driven valuation tools for accurate bike pricing, improved user interfaces for enhanced customer experience, and advanced search filters enabling refined bike selection based on specifications and location. These enhancements improve the efficiency and reliability of the online used bike buying process. The introduction of virtual reality (VR) showrooms and augmented reality (AR) overlays for detailed bike inspections represents a major step forward in making the used bike purchase more transparent and convenient.
Propelling Factors for Used Bikes through Bike Marketplace Growth
The used bike market growth is spurred by several key factors. Firstly, the economic advantage of used bikes offers significant cost savings compared to new ones, appealing to budget-conscious buyers. Secondly, technological advancements such as improved online platforms and user-friendly mobile apps enhance accessibility and transparency. Lastly, increasing environmental concerns are driving a shift towards more sustainable transportation options, increasing the demand for pre-owned vehicles.
Obstacles in the Used Bikes through Bike Marketplace Market
The used bike market faces challenges such as inconsistent vehicle quality, potential for fraudulent listings, and the complexity of vehicle verification processes. Supply chain disruptions can impact the availability of used bikes, impacting market stability. Furthermore, intense competition among online platforms requires substantial marketing and technological investment to maintain market share. These factors collectively affect the overall market growth, impacting customer confidence and operational efficiency for various marketplaces.
Future Opportunities in Used Bikes through Bike Marketplace
Expanding into untapped markets, particularly in developing economies with growing motorcycle ownership, presents substantial growth opportunities. The integration of innovative technologies such as blockchain for secure transactions and AI-powered predictive maintenance tools can further enhance customer trust and market efficiency. Capitalizing on emerging consumer trends, such as demand for eco-friendly transportation, will also contribute significantly to market growth.
Key Developments in Used Bikes through Bike Marketplace Industry
- 2022 Q3: Droom launched an AI-powered valuation tool.
- 2023 Q1: CredR expanded operations into a new region.
- 2024 Q2: A major merger between two smaller players consolidated market share. (Further details on specific deals and their impact would be included in the full report).
Strategic Used Bikes through Bike Marketplace Market Forecast
The used bike marketplace is poised for significant growth, driven by strong economic factors, technological advancements, and increasing consumer preference for sustainable and affordable transportation. The forecast period (2025-2033) anticipates a considerable expansion of the market, exceeding xx million by 2033. Continuous innovation in online platforms and service offerings, coupled with strategic expansions into new markets, will be crucial for companies to capitalize on this substantial growth potential.
Used Bikes through Bike Marketplace Segmentation
-
1. Application
- 1.1. Customer to Customer
- 1.2. Business to Customer
-
2. Types
- 2.1. Off-Roading
- 2.2. Sports
- 2.3. Super Bikes
- 2.4. Cruiser Bikes
- 2.5. Others
Used Bikes through Bike Marketplace Segmentation By Geography
-
1. North America
- 1.1. United States
- 1.2. Canada
- 1.3. Mexico
-
2. South America
- 2.1. Brazil
- 2.2. Argentina
- 2.3. Rest of South America
-
3. Europe
- 3.1. United Kingdom
- 3.2. Germany
- 3.3. France
- 3.4. Italy
- 3.5. Spain
- 3.6. Russia
- 3.7. Benelux
- 3.8. Nordics
- 3.9. Rest of Europe
-
4. Middle East & Africa
- 4.1. Turkey
- 4.2. Israel
- 4.3. GCC
- 4.4. North Africa
- 4.5. South Africa
- 4.6. Rest of Middle East & Africa
-
5. Asia Pacific
- 5.1. China
- 5.2. India
- 5.3. Japan
- 5.4. South Korea
- 5.5. ASEAN
- 5.6. Oceania
- 5.7. Rest of Asia Pacific
Used Bikes through Bike Marketplace Regional Market Share
Geographic Coverage of Used Bikes through Bike Marketplace
Used Bikes through Bike Marketplace REPORT HIGHLIGHTS
| Aspects | Details |
|---|---|
| Study Period | 2020-2034 |
| Base Year | 2025 |
| Estimated Year | 2026 |
| Forecast Period | 2026-2034 |
| Historical Period | 2020-2025 |
| Growth Rate | CAGR of 4.53% from 2020-2034 |
| Segmentation |
|
Table of Contents
- 1. Introduction
- 1.1. Research Scope
- 1.2. Market Segmentation
- 1.3. Research Objective
- 1.4. Definitions and Assumptions
- 2. Executive Summary
- 2.1. Market Snapshot
- 3. Market Dynamics
- 3.1. Market Drivers
- 3.2. Market Restrains
- 3.3. Market Trends
- 3.4. Market Opportunities
- 4. Market Factor Analysis
- 4.1. Porters Five Forces
- 4.1.1. Bargaining Power of Suppliers
- 4.1.2. Bargaining Power of Buyers
- 4.1.3. Threat of New Entrants
- 4.1.4. Threat of Substitutes
- 4.1.5. Competitive Rivalry
- 4.2. PESTEL analysis
- 4.3. BCG Analysis
- 4.3.1. Stars (High Growth, High Market Share)
- 4.3.2. Cash Cows (Low Growth, High Market Share)
- 4.3.3. Question Mark (High Growth, Low Market Share)
- 4.3.4. Dogs (Low Growth, Low Market Share)
- 4.4. Ansoff Matrix Analysis
- 4.5. Supply Chain Analysis
- 4.6. Regulatory Landscape
- 4.7. Current Market Potential and Opportunity Assessment (TAM–SAM–SOM Framework)
- 4.8. DMV Analyst Note
- 4.1. Porters Five Forces
- 5. Market Analysis, Insights and Forecast 2021-2033
- 5.1. Market Analysis, Insights and Forecast - by Application
- 5.1.1. Customer to Customer
- 5.1.2. Business to Customer
- 5.2. Market Analysis, Insights and Forecast - by Types
- 5.2.1. Off-Roading
- 5.2.2. Sports
- 5.2.3. Super Bikes
- 5.2.4. Cruiser Bikes
- 5.2.5. Others
- 5.3. Market Analysis, Insights and Forecast - by Region
- 5.3.1. North America
- 5.3.2. South America
- 5.3.3. Europe
- 5.3.4. Middle East & Africa
- 5.3.5. Asia Pacific
- 5.1. Market Analysis, Insights and Forecast - by Application
- 6. Global Used Bikes through Bike Marketplace Analysis, Insights and Forecast, 2021-2033
- 6.1. Market Analysis, Insights and Forecast - by Application
- 6.1.1. Customer to Customer
- 6.1.2. Business to Customer
- 6.2. Market Analysis, Insights and Forecast - by Types
- 6.2.1. Off-Roading
- 6.2.2. Sports
- 6.2.3. Super Bikes
- 6.2.4. Cruiser Bikes
- 6.2.5. Others
- 6.1. Market Analysis, Insights and Forecast - by Application
- 7. North America Used Bikes through Bike Marketplace Analysis, Insights and Forecast, 2020-2032
- 7.1. Market Analysis, Insights and Forecast - by Application
- 7.1.1. Customer to Customer
- 7.1.2. Business to Customer
- 7.2. Market Analysis, Insights and Forecast - by Types
- 7.2.1. Off-Roading
- 7.2.2. Sports
- 7.2.3. Super Bikes
- 7.2.4. Cruiser Bikes
- 7.2.5. Others
- 7.1. Market Analysis, Insights and Forecast - by Application
- 8. South America Used Bikes through Bike Marketplace Analysis, Insights and Forecast, 2020-2032
- 8.1. Market Analysis, Insights and Forecast - by Application
- 8.1.1. Customer to Customer
- 8.1.2. Business to Customer
- 8.2. Market Analysis, Insights and Forecast - by Types
- 8.2.1. Off-Roading
- 8.2.2. Sports
- 8.2.3. Super Bikes
- 8.2.4. Cruiser Bikes
- 8.2.5. Others
- 8.1. Market Analysis, Insights and Forecast - by Application
- 9. Europe Used Bikes through Bike Marketplace Analysis, Insights and Forecast, 2020-2032
- 9.1. Market Analysis, Insights and Forecast - by Application
- 9.1.1. Customer to Customer
- 9.1.2. Business to Customer
- 9.2. Market Analysis, Insights and Forecast - by Types
- 9.2.1. Off-Roading
- 9.2.2. Sports
- 9.2.3. Super Bikes
- 9.2.4. Cruiser Bikes
- 9.2.5. Others
- 9.1. Market Analysis, Insights and Forecast - by Application
- 10. Middle East & Africa Used Bikes through Bike Marketplace Analysis, Insights and Forecast, 2020-2032
- 10.1. Market Analysis, Insights and Forecast - by Application
- 10.1.1. Customer to Customer
- 10.1.2. Business to Customer
- 10.2. Market Analysis, Insights and Forecast - by Types
- 10.2.1. Off-Roading
- 10.2.2. Sports
- 10.2.3. Super Bikes
- 10.2.4. Cruiser Bikes
- 10.2.5. Others
- 10.1. Market Analysis, Insights and Forecast - by Application
- 11. Asia Pacific Used Bikes through Bike Marketplace Analysis, Insights and Forecast, 2020-2032
- 11.1. Market Analysis, Insights and Forecast - by Application
- 11.1.1. Customer to Customer
- 11.1.2. Business to Customer
- 11.2. Market Analysis, Insights and Forecast - by Types
- 11.2.1. Off-Roading
- 11.2.2. Sports
- 11.2.3. Super Bikes
- 11.2.4. Cruiser Bikes
- 11.2.5. Others
- 11.1. Market Analysis, Insights and Forecast - by Application
- 12. Competitive Analysis
- 12.1. Company Profiles
- 12.1.1 Droom
- 12.1.1.1. Company Overview
- 12.1.1.2. Products
- 12.1.1.3. Company Financials
- 12.1.1.4. SWOT Analysis
- 12.1.2 CredR
- 12.1.2.1. Company Overview
- 12.1.2.2. Products
- 12.1.2.3. Company Financials
- 12.1.2.4. SWOT Analysis
- 12.1.3 Bikedekho
- 12.1.3.1. Company Overview
- 12.1.3.2. Products
- 12.1.3.3. Company Financials
- 12.1.3.4. SWOT Analysis
- 12.1.4 Bikewale
- 12.1.4.1. Company Overview
- 12.1.4.2. Products
- 12.1.4.3. Company Financials
- 12.1.4.4. SWOT Analysis
- 12.1.5 Mahindra First Choice
- 12.1.5.1. Company Overview
- 12.1.5.2. Products
- 12.1.5.3. Company Financials
- 12.1.5.4. SWOT Analysis
- 12.1.6 Bikers Highway
- 12.1.6.1. Company Overview
- 12.1.6.2. Products
- 12.1.6.3. Company Financials
- 12.1.6.4. SWOT Analysis
- 12.1.7 OLX
- 12.1.7.1. Company Overview
- 12.1.7.2. Products
- 12.1.7.3. Company Financials
- 12.1.7.4. SWOT Analysis
- 12.1.8 Quicker
- 12.1.8.1. Company Overview
- 12.1.8.2. Products
- 12.1.8.3. Company Financials
- 12.1.8.4. SWOT Analysis
- 12.1.9 Use Motorcycle Store
- 12.1.9.1. Company Overview
- 12.1.9.2. Products
- 12.1.9.3. Company Financials
- 12.1.9.4. SWOT Analysis
- 12.1.10 Bicycle Bluebook
- 12.1.10.1. Company Overview
- 12.1.10.2. Products
- 12.1.10.3. Company Financials
- 12.1.10.4. SWOT Analysis
- 12.1.1 Droom
- 12.2. Market Entropy
- 12.2.1 Company's Key Areas Served
- 12.2.2 Recent Developments
- 12.3. Company Market Share Analysis 2025
- 12.3.1 Top 5 Companies Market Share Analysis
- 12.3.2 Top 3 Companies Market Share Analysis
- 12.4. List of Potential Customers
- 13. Research Methodology
List of Figures
- Figure 1: Global Used Bikes through Bike Marketplace Revenue Breakdown (billion, %) by Region 2025 & 2033
- Figure 2: North America Used Bikes through Bike Marketplace Revenue (billion), by Application 2025 & 2033
- Figure 3: North America Used Bikes through Bike Marketplace Revenue Share (%), by Application 2025 & 2033
- Figure 4: North America Used Bikes through Bike Marketplace Revenue (billion), by Types 2025 & 2033
- Figure 5: North America Used Bikes through Bike Marketplace Revenue Share (%), by Types 2025 & 2033
- Figure 6: North America Used Bikes through Bike Marketplace Revenue (billion), by Country 2025 & 2033
- Figure 7: North America Used Bikes through Bike Marketplace Revenue Share (%), by Country 2025 & 2033
- Figure 8: South America Used Bikes through Bike Marketplace Revenue (billion), by Application 2025 & 2033
- Figure 9: South America Used Bikes through Bike Marketplace Revenue Share (%), by Application 2025 & 2033
- Figure 10: South America Used Bikes through Bike Marketplace Revenue (billion), by Types 2025 & 2033
- Figure 11: South America Used Bikes through Bike Marketplace Revenue Share (%), by Types 2025 & 2033
- Figure 12: South America Used Bikes through Bike Marketplace Revenue (billion), by Country 2025 & 2033
- Figure 13: South America Used Bikes through Bike Marketplace Revenue Share (%), by Country 2025 & 2033
- Figure 14: Europe Used Bikes through Bike Marketplace Revenue (billion), by Application 2025 & 2033
- Figure 15: Europe Used Bikes through Bike Marketplace Revenue Share (%), by Application 2025 & 2033
- Figure 16: Europe Used Bikes through Bike Marketplace Revenue (billion), by Types 2025 & 2033
- Figure 17: Europe Used Bikes through Bike Marketplace Revenue Share (%), by Types 2025 & 2033
- Figure 18: Europe Used Bikes through Bike Marketplace Revenue (billion), by Country 2025 & 2033
- Figure 19: Europe Used Bikes through Bike Marketplace Revenue Share (%), by Country 2025 & 2033
- Figure 20: Middle East & Africa Used Bikes through Bike Marketplace Revenue (billion), by Application 2025 & 2033
- Figure 21: Middle East & Africa Used Bikes through Bike Marketplace Revenue Share (%), by Application 2025 & 2033
- Figure 22: Middle East & Africa Used Bikes through Bike Marketplace Revenue (billion), by Types 2025 & 2033
- Figure 23: Middle East & Africa Used Bikes through Bike Marketplace Revenue Share (%), by Types 2025 & 2033
- Figure 24: Middle East & Africa Used Bikes through Bike Marketplace Revenue (billion), by Country 2025 & 2033
- Figure 25: Middle East & Africa Used Bikes through Bike Marketplace Revenue Share (%), by Country 2025 & 2033
- Figure 26: Asia Pacific Used Bikes through Bike Marketplace Revenue (billion), by Application 2025 & 2033
- Figure 27: Asia Pacific Used Bikes through Bike Marketplace Revenue Share (%), by Application 2025 & 2033
- Figure 28: Asia Pacific Used Bikes through Bike Marketplace Revenue (billion), by Types 2025 & 2033
- Figure 29: Asia Pacific Used Bikes through Bike Marketplace Revenue Share (%), by Types 2025 & 2033
- Figure 30: Asia Pacific Used Bikes through Bike Marketplace Revenue (billion), by Country 2025 & 2033
- Figure 31: Asia Pacific Used Bikes through Bike Marketplace Revenue Share (%), by Country 2025 & 2033
List of Tables
- Table 1: Global Used Bikes through Bike Marketplace Revenue billion Forecast, by Application 2020 & 2033
- Table 2: Global Used Bikes through Bike Marketplace Revenue billion Forecast, by Types 2020 & 2033
- Table 3: Global Used Bikes through Bike Marketplace Revenue billion Forecast, by Region 2020 & 2033
- Table 4: Global Used Bikes through Bike Marketplace Revenue billion Forecast, by Application 2020 & 2033
- Table 5: Global Used Bikes through Bike Marketplace Revenue billion Forecast, by Types 2020 & 2033
- Table 6: Global Used Bikes through Bike Marketplace Revenue billion Forecast, by Country 2020 & 2033
- Table 7: United States Used Bikes through Bike Marketplace Revenue (billion) Forecast, by Application 2020 & 2033
- Table 8: Canada Used Bikes through Bike Marketplace Revenue (billion) Forecast, by Application 2020 & 2033
- Table 9: Mexico Used Bikes through Bike Marketplace Revenue (billion) Forecast, by Application 2020 & 2033
- Table 10: Global Used Bikes through Bike Marketplace Revenue billion Forecast, by Application 2020 & 2033
- Table 11: Global Used Bikes through Bike Marketplace Revenue billion Forecast, by Types 2020 & 2033
- Table 12: Global Used Bikes through Bike Marketplace Revenue billion Forecast, by Country 2020 & 2033
- Table 13: Brazil Used Bikes through Bike Marketplace Revenue (billion) Forecast, by Application 2020 & 2033
- Table 14: Argentina Used Bikes through Bike Marketplace Revenue (billion) Forecast, by Application 2020 & 2033
- Table 15: Rest of South America Used Bikes through Bike Marketplace Revenue (billion) Forecast, by Application 2020 & 2033
- Table 16: Global Used Bikes through Bike Marketplace Revenue billion Forecast, by Application 2020 & 2033
- Table 17: Global Used Bikes through Bike Marketplace Revenue billion Forecast, by Types 2020 & 2033
- Table 18: Global Used Bikes through Bike Marketplace Revenue billion Forecast, by Country 2020 & 2033
- Table 19: United Kingdom Used Bikes through Bike Marketplace Revenue (billion) Forecast, by Application 2020 & 2033
- Table 20: Germany Used Bikes through Bike Marketplace Revenue (billion) Forecast, by Application 2020 & 2033
- Table 21: France Used Bikes through Bike Marketplace Revenue (billion) Forecast, by Application 2020 & 2033
- Table 22: Italy Used Bikes through Bike Marketplace Revenue (billion) Forecast, by Application 2020 & 2033
- Table 23: Spain Used Bikes through Bike Marketplace Revenue (billion) Forecast, by Application 2020 & 2033
- Table 24: Russia Used Bikes through Bike Marketplace Revenue (billion) Forecast, by Application 2020 & 2033
- Table 25: Benelux Used Bikes through Bike Marketplace Revenue (billion) Forecast, by Application 2020 & 2033
- Table 26: Nordics Used Bikes through Bike Marketplace Revenue (billion) Forecast, by Application 2020 & 2033
- Table 27: Rest of Europe Used Bikes through Bike Marketplace Revenue (billion) Forecast, by Application 2020 & 2033
- Table 28: Global Used Bikes through Bike Marketplace Revenue billion Forecast, by Application 2020 & 2033
- Table 29: Global Used Bikes through Bike Marketplace Revenue billion Forecast, by Types 2020 & 2033
- Table 30: Global Used Bikes through Bike Marketplace Revenue billion Forecast, by Country 2020 & 2033
- Table 31: Turkey Used Bikes through Bike Marketplace Revenue (billion) Forecast, by Application 2020 & 2033
- Table 32: Israel Used Bikes through Bike Marketplace Revenue (billion) Forecast, by Application 2020 & 2033
- Table 33: GCC Used Bikes through Bike Marketplace Revenue (billion) Forecast, by Application 2020 & 2033
- Table 34: North Africa Used Bikes through Bike Marketplace Revenue (billion) Forecast, by Application 2020 & 2033
- Table 35: South Africa Used Bikes through Bike Marketplace Revenue (billion) Forecast, by Application 2020 & 2033
- Table 36: Rest of Middle East & Africa Used Bikes through Bike Marketplace Revenue (billion) Forecast, by Application 2020 & 2033
- Table 37: Global Used Bikes through Bike Marketplace Revenue billion Forecast, by Application 2020 & 2033
- Table 38: Global Used Bikes through Bike Marketplace Revenue billion Forecast, by Types 2020 & 2033
- Table 39: Global Used Bikes through Bike Marketplace Revenue billion Forecast, by Country 2020 & 2033
- Table 40: China Used Bikes through Bike Marketplace Revenue (billion) Forecast, by Application 2020 & 2033
- Table 41: India Used Bikes through Bike Marketplace Revenue (billion) Forecast, by Application 2020 & 2033
- Table 42: Japan Used Bikes through Bike Marketplace Revenue (billion) Forecast, by Application 2020 & 2033
- Table 43: South Korea Used Bikes through Bike Marketplace Revenue (billion) Forecast, by Application 2020 & 2033
- Table 44: ASEAN Used Bikes through Bike Marketplace Revenue (billion) Forecast, by Application 2020 & 2033
- Table 45: Oceania Used Bikes through Bike Marketplace Revenue (billion) Forecast, by Application 2020 & 2033
- Table 46: Rest of Asia Pacific Used Bikes through Bike Marketplace Revenue (billion) Forecast, by Application 2020 & 2033
Frequently Asked Questions
1. What is the projected Compound Annual Growth Rate (CAGR) of the Used Bikes through Bike Marketplace?
The projected CAGR is approximately 4.53%.
2. Which companies are prominent players in the Used Bikes through Bike Marketplace?
Key companies in the market include Droom, CredR, Bikedekho, Bikewale, Mahindra First Choice, Bikers Highway, OLX, Quicker, Use Motorcycle Store, Bicycle Bluebook.
3. What are the main segments of the Used Bikes through Bike Marketplace?
The market segments include Application, Types.
4. Can you provide details about the market size?
The market size is estimated to be USD 4.61 billion as of 2022.
5. What are some drivers contributing to market growth?
N/A
6. What are the notable trends driving market growth?
N/A
7. Are there any restraints impacting market growth?
N/A
8. Can you provide examples of recent developments in the market?
N/A
9. What pricing options are available for accessing the report?
Pricing options include single-user, multi-user, and enterprise licenses priced at USD 4350.00, USD 6525.00, and USD 8700.00 respectively.
10. Is the market size provided in terms of value or volume?
The market size is provided in terms of value, measured in billion.
11. Are there any specific market keywords associated with the report?
Yes, the market keyword associated with the report is "Used Bikes through Bike Marketplace," which aids in identifying and referencing the specific market segment covered.
12. How do I determine which pricing option suits my needs best?
The pricing options vary based on user requirements and access needs. Individual users may opt for single-user licenses, while businesses requiring broader access may choose multi-user or enterprise licenses for cost-effective access to the report.
13. Are there any additional resources or data provided in the Used Bikes through Bike Marketplace report?
While the report offers comprehensive insights, it's advisable to review the specific contents or supplementary materials provided to ascertain if additional resources or data are available.
14. How can I stay updated on further developments or reports in the Used Bikes through Bike Marketplace?
To stay informed about further developments, trends, and reports in the Used Bikes through Bike Marketplace, consider subscribing to industry newsletters, following relevant companies and organizations, or regularly checking reputable industry news sources and publications.
Methodology
Step 1 - Identification of Relevant Samples Size from Population Database


Step 2 - Approaches for Defining Global Market Size (Value, Volume* & Price*)

Note*: In applicable scenarios
Step 3 - Data Sources
Primary Research
- Web Analytics
- Survey Reports
- Research Institute
- Latest Research Reports
- Opinion Leaders
Secondary Research
- Annual Reports
- White Paper
- Latest Press Release
- Industry Association
- Paid Database
- Investor Presentations

Step 4 - Data Triangulation
Involves using different sources of information in order to increase the validity of a study
These sources are likely to be stakeholders in a program - participants, other researchers, program staff, other community members, and so on.
Then we put all data in single framework & apply various statistical tools to find out the dynamic on the market.
During the analysis stage, feedback from the stakeholder groups would be compared to determine areas of agreement as well as areas of divergence