

Key Insights
The global USB-C charger market is projected for significant expansion, with an estimated market size of $4.09 billion by 2025. The market is expected to grow at a Compound Annual Growth Rate (CAGR) of 17% during the forecast period of 2025-2033. This robust growth is primarily driven by the widespread adoption of USB-C ports across smartphones, laptops, tablets, and gaming consoles. Increasing demand for faster charging speeds, fueled by advancements in battery technology and consumer expectations, further propels market expansion. The trend towards universal charging solutions, enabling a single charger for multiple devices, enhances consumer convenience and reduces electronic waste. The "Individual Use" segment is anticipated to lead, reflecting high personal electronic device penetration. Power Delivery (PD) capabilities, particularly those exceeding 60W, are gaining traction for efficiently charging power-intensive devices like laptops.
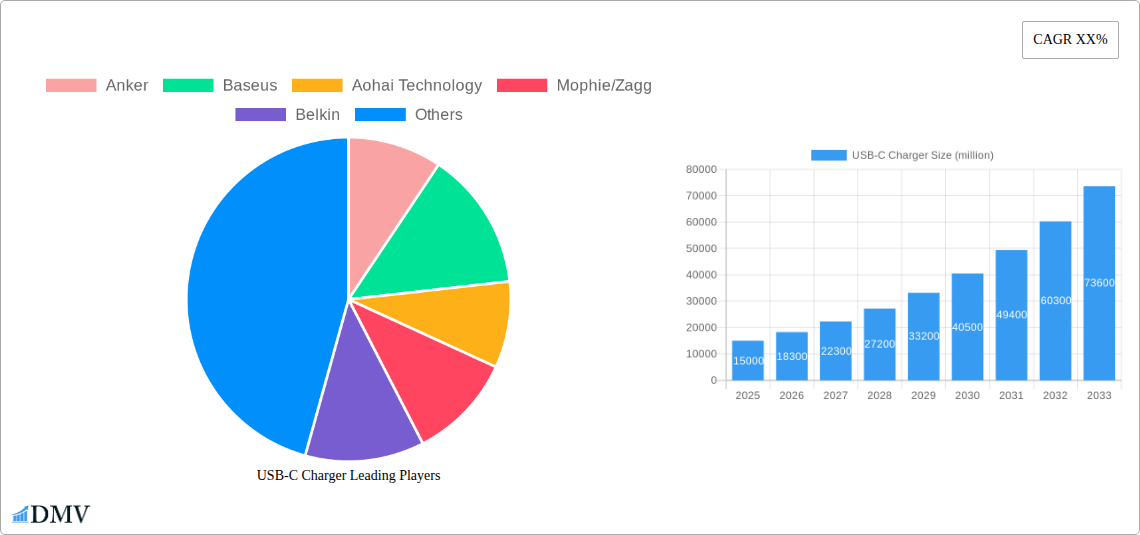
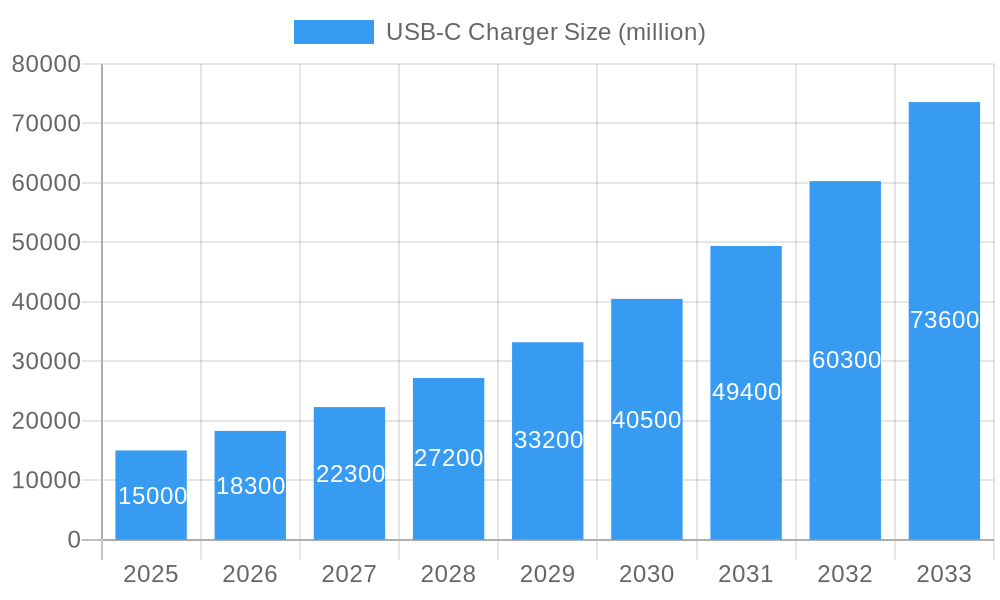
USB-C Charger Market Size (In Billion)
Key market trends include charger miniaturization, integration of Gallium Nitride (GaN) technology for improved efficiency and smaller form factors, and a growing consumer preference for certified, reliable charging solutions. However, the market faces challenges such as intense price competition, particularly in lower wattage segments, potentially impacting profit margins. While interoperability and standardization concerns are diminishing, they can still present obstacles. The prevalence of counterfeit or uncertified chargers poses a risk to consumers and may impede the adoption of premium solutions. Geographically, Asia Pacific, led by China and India, is expected to dominate due to its large consumer base and manufacturing capabilities. North America and Europe are significant markets, driven by early technology adoption and strong consumer spending. The "Commercial Use" segment, including enterprise deployments and public charging stations, is also forecast to experience substantial growth as organizations standardize charging infrastructure.
USB-C Charger Company Market Share
USB-C Charger Market Composition & Trends
The global USB-C charger market exhibits a dynamic and evolving landscape, characterized by intense competition and continuous innovation. Market concentration is moderately fragmented, with a few dominant players like Anker and Baseus commanding significant shares, alongside a robust ecosystem of mid-tier manufacturers such as Aohai Technology, Mophie/Zagg, Belkin, and Apple. Emerging brands like Ugreen, Samsung, Bull, Aukey, Pisen, and Amazon Basics are rapidly gaining traction, leveraging competitive pricing and targeted product development. The market is further populated by specialized manufacturers including Incipio, Innergie, iLuv, RAVPower, Monoprice, Nomad, Spigen, Shenzhen JOWAY, Ventev, Razer, Philips, Cygnett, and IOGEAR. Innovation catalysts are primarily driven by the increasing demand for faster charging speeds, enhanced device compatibility, and compact designs. Regulatory landscapes, particularly concerning power delivery standards and safety certifications, play a crucial role in shaping product development and market entry. Substitute products, such as older USB-A chargers and proprietary charging solutions, are gradually being phased out as USB-C becomes the universal standard. End-user profiles span both individual consumers seeking convenient and efficient charging for personal devices and commercial entities requiring robust charging solutions for fleets of devices. Mergers and acquisitions (M&A) activities, with estimated deal values reaching into the millions, are a key trend as larger companies seek to consolidate market share and acquire innovative technologies. The distribution of market share is influenced by product segmentation, with higher wattage chargers experiencing robust demand.
USB-C Charger Industry Evolution
The USB-C charger industry has undergone a profound transformation, driven by the ubiquitous adoption of the USB Type-C connector and the subsequent development of advanced charging technologies. Over the historical period of 2019–2024, the market witnessed a steady surge in demand, fueled by the proliferation of USB-C enabled devices across smartphones, laptops, tablets, and an ever-expanding array of accessories. The base year of 2025 marks a pivotal point, with the market firmly established as a cornerstone of modern electronics. The forecast period of 2025–2033 anticipates continued exponential growth, projected to reach multi-million dollar valuations. This trajectory is primarily attributed to ongoing technological advancements. Gallium Nitride (GaN) technology has revolutionized charger design, enabling smaller, more efficient, and higher-wattage adapters. Innovations in Power Delivery (PD) protocols have unlocked unprecedented charging speeds, allowing devices to power up in mere minutes rather than hours. Consumer demand has evolved from basic charging needs to a desire for intelligent charging solutions that optimize battery health and offer multi-device charging capabilities from a single adapter. The increasing complexity of electronic devices, requiring more power, further propels market expansion. Adoption metrics for USB-C charging are nearing saturation in developed markets, with emerging economies presenting significant growth opportunities. Industry development is characterized by a constant pursuit of higher power outputs, improved safety features, and enhanced portability, ensuring that the USB-C charger remains an indispensable accessory in the digital age.
Leading Regions, Countries, or Segments in USB-C Charger
The USB-C charger market's dominance is multifaceted, with Individual Use applications and the 60-100W and 100W~150W power categories exhibiting particularly strong growth trajectories. North America and Europe currently lead in terms of market penetration and revenue, driven by high disposable incomes, early adoption of new technologies, and a dense concentration of advanced electronic device users. The United States, in particular, stands out as a key market due to its vast consumer base and the significant presence of major tech companies.
Key Drivers of Dominance in Individual Use and High Wattage Segments:
- Consumer Electronics Proliferation: The ever-increasing number of personal electronic devices, including smartphones, laptops, tablets, smartwatches, and wireless earbuds, necessitates a robust and versatile charging infrastructure. Individual users often own multiple devices, driving demand for high-performance USB-C chargers.
- Demand for Fast Charging: Consumers are increasingly prioritizing speed and convenience. The desire to quickly charge power-hungry devices, especially laptops and gaming consoles, fuels the demand for chargers in the 60W to 150W+ range.
- Laptop and Ultrabook Adoption: The widespread adoption of USB-C as the primary charging port for modern laptops and ultrabooks is a monumental driver. Users now expect to power their primary computing devices with the same charger used for their phones, leading to a demand for higher wattage solutions.
- Gaming and Portable Power: The burgeoning portable gaming market and the need to keep high-performance mobile devices powered on the go contribute significantly to the demand for chargers capable of delivering substantial power output.
- Technological Advancements in GaN: The integration of Gallium Nitride (GaN) technology has enabled manufacturers to produce smaller, more efficient, and safer chargers that can deliver higher wattages without significant heat generation. This innovation directly supports the growth of the 100W~150W segment and beyond.
- Ecosystem Integration: The growing trend of a unified charging ecosystem, where one charger can power multiple devices, further boosts the popularity of versatile, higher-wattage USB-C chargers for individual users.
While Commercial Use is a significant and growing segment, the sheer volume and pace of adoption in the individual consumer space, coupled with the rapid evolution of device power requirements, currently place Individual Use and the higher wattage categories at the forefront of market dynamism and revenue generation. Other segments and regions are expected to catch up, but the current landscape is heavily influenced by these key drivers.
USB-C Charger Product Innovations
USB-C charger product innovations are rapidly advancing, focusing on delivering unparalleled charging speeds, enhanced portability, and intelligent power management. The integration of Gallium Nitride (GaN) technology has been a game-changer, enabling the creation of compact yet powerful chargers, with models now exceeding 150W in pocket-friendly designs. Innovations in Power Delivery (PD) 3.0 and 3.1 protocols offer dynamic power negotiation, optimizing charging for specific devices and preventing overcharging. Many new chargers feature multiple USB-C ports, allowing simultaneous charging of several devices at high speeds, often with intelligent power distribution across ports. Furthermore, advancements include enhanced safety features like overcurrent, overvoltage, and short-circuit protection, alongside improved thermal management for cooler operation. These product innovations are crucial for meeting the escalating power demands of modern electronic devices and enhancing user convenience.
Propelling Factors for USB-C Charger Growth
The USB-C charger market's robust growth is propelled by several key factors. Technological Advancements, particularly the widespread adoption of USB Power Delivery (PD) and Gallium Nitride (GaN) technology, enable faster charging speeds and more compact charger designs. Increasing Device Compatibility as USB-C becomes the universal standard across smartphones, laptops, tablets, and other electronics, creates a unified charging ecosystem. Growing Demand for Multi-Device Charging Solutions for individuals and businesses further fuels market expansion. Economically, the rising disposable income in developing regions and the increasing number of electronic devices per user contribute significantly. Regulatory support, such as standardization initiatives, also plays a role in ensuring compatibility and safety, indirectly promoting adoption.
Obstacles in the USB-C Charger Market
Despite its growth, the USB-C charger market faces several obstacles. Counterfeit and Low-Quality Products pose a significant risk to consumers, leading to potential device damage and safety hazards, undermining trust. Intense Price Competition among numerous manufacturers can squeeze profit margins, especially for smaller players. Supply Chain Disruptions, as seen with recent global events, can impact the availability of essential components and raw materials, leading to production delays and price fluctuations. Rapid Technological Obsolescence can lead to a shorter product lifecycle, requiring continuous R&D investment. Furthermore, compatibility issues with older devices or specific proprietary charging protocols can still present challenges, although these are diminishing. The cost of advanced technologies like GaN can also be a barrier for some consumers.
Future Opportunities in USB-C Charger
Emerging opportunities in the USB-C charger market are ripe for exploration. The increasing adoption of USB4 and Thunderbolt technologies presents a significant avenue for high-speed data transfer and charging solutions. The expansion of smart home ecosystems and the demand for integrated charging solutions for various IoT devices offer substantial potential. The automotive sector, with the growing integration of USB-C ports in vehicles, presents a new frontier for charger development. Furthermore, the push for eco-friendly and sustainable charging solutions, utilizing recycled materials and energy-efficient designs, is a growing consumer trend. The untapped potential in emerging economies as smartphone and laptop penetration continues to rise offers vast market expansion possibilities.
Major Players in the USB-C Charger Ecosystem
- Anker
- Baseus
- Aohai Technology
- Mophie/Zagg
- Belkin
- Apple
- Ugreen
- Samsung
- Bull
- Aukey
- Pisen
- Amazon Basics
- Incipio
- Innergie
- iLuv
- RAVPower
- Monoprice
- Nomad
- Spigen
- Shenzhen JOWAY
- Ventev
- Razer
- Philips
- Cygnett
- IOGEAR
Key Developments in USB-C Charger Industry
- 2019: Widespread adoption of USB PD 3.0 with Programmable Power Supply (PPS) for enhanced charging efficiency.
- 2020: Emergence and rapid adoption of Gallium Nitride (GaN) technology, leading to smaller and more powerful chargers.
- 2021: Launch of higher wattage chargers (100W+) becoming more mainstream for laptops and multiple device charging.
- 2022: Increased focus on intelligent charging features, including adaptive charging for battery health optimization.
- 2023: Standardization efforts towards USB PD 3.1 extend charging capabilities to over 200W, catering to demanding applications.
- 2024: Growing consumer demand for chargers made with sustainable and recycled materials.
Strategic USB-C Charger Market Forecast
The strategic forecast for the USB-C charger market points towards continued robust growth, driven by an insatiable demand for faster, more efficient, and versatile charging solutions. The ongoing proliferation of USB-C across an ever-expanding range of electronic devices, coupled with advancements in GaN technology and USB PD protocols, will be pivotal growth catalysts. Emerging opportunities in sectors like automotive and smart home technology, alongside untapped potential in developing markets, promise significant expansion. While challenges such as counterfeiting and supply chain volatility persist, the fundamental shift towards a universal charging standard and the continuous innovation in power delivery technology position the USB-C charger market for sustained, multi-million dollar expansion through 2033.
USB-C Charger Segmentation
-
1. Application
- 1.1. Individual Use
- 1.2. Commercial Use
- 1.3. Others
-
2. Types
- 2.1. Up to 20W
- 2.2. 20-30W
- 2.3. 30-60W
- 2.4. 60-100W
- 2.5. 100W~150W
- 2.6. 150W~200W
- 2.7. Above 200W
USB-C Charger Segmentation By Geography
-
1. North America
- 1.1. United States
- 1.2. Canada
- 1.3. Mexico
-
2. South America
- 2.1. Brazil
- 2.2. Argentina
- 2.3. Rest of South America
-
3. Europe
- 3.1. United Kingdom
- 3.2. Germany
- 3.3. France
- 3.4. Italy
- 3.5. Spain
- 3.6. Russia
- 3.7. Benelux
- 3.8. Nordics
- 3.9. Rest of Europe
-
4. Middle East & Africa
- 4.1. Turkey
- 4.2. Israel
- 4.3. GCC
- 4.4. North Africa
- 4.5. South Africa
- 4.6. Rest of Middle East & Africa
-
5. Asia Pacific
- 5.1. China
- 5.2. India
- 5.3. Japan
- 5.4. South Korea
- 5.5. ASEAN
- 5.6. Oceania
- 5.7. Rest of Asia Pacific
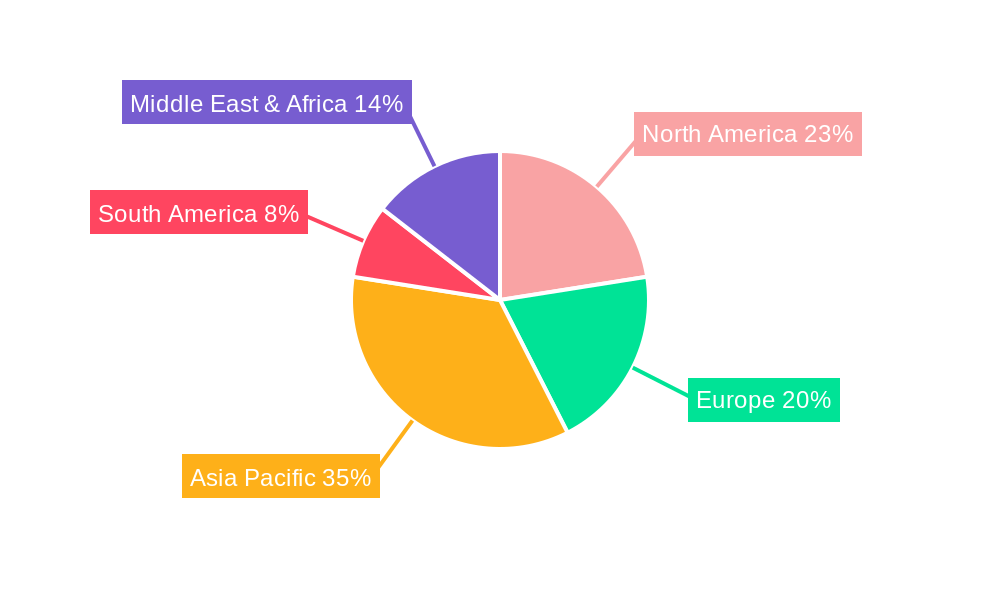
USB-C Charger Regional Market Share
Geographic Coverage of USB-C Charger
USB-C Charger REPORT HIGHLIGHTS
| Aspects | Details |
|---|---|
| Study Period | 2020-2034 |
| Base Year | 2025 |
| Estimated Year | 2026 |
| Forecast Period | 2026-2034 |
| Historical Period | 2020-2025 |
| Growth Rate | CAGR of 17% from 2020-2034 |
| Segmentation |
|
Table of Contents
- 1. Introduction
- 1.1. Research Scope
- 1.2. Market Segmentation
- 1.3. Research Methodology
- 1.4. Definitions and Assumptions
- 2. Executive Summary
- 2.1. Introduction
- 3. Market Dynamics
- 3.1. Introduction
- 3.2. Market Drivers
- 3.3. Market Restrains
- 3.4. Market Trends
- 4. Market Factor Analysis
- 4.1. Porters Five Forces
- 4.2. Supply/Value Chain
- 4.3. PESTEL analysis
- 4.4. Market Entropy
- 4.5. Patent/Trademark Analysis
- 5. Global USB-C Charger Analysis, Insights and Forecast, 2020-2032
- 5.1. Market Analysis, Insights and Forecast - by Application
- 5.1.1. Individual Use
- 5.1.2. Commercial Use
- 5.1.3. Others
- 5.2. Market Analysis, Insights and Forecast - by Types
- 5.2.1. Up to 20W
- 5.2.2. 20-30W
- 5.2.3. 30-60W
- 5.2.4. 60-100W
- 5.2.5. 100W~150W
- 5.2.6. 150W~200W
- 5.2.7. Above 200W
- 5.3. Market Analysis, Insights and Forecast - by Region
- 5.3.1. North America
- 5.3.2. South America
- 5.3.3. Europe
- 5.3.4. Middle East & Africa
- 5.3.5. Asia Pacific
- 5.1. Market Analysis, Insights and Forecast - by Application
- 6. North America USB-C Charger Analysis, Insights and Forecast, 2020-2032
- 6.1. Market Analysis, Insights and Forecast - by Application
- 6.1.1. Individual Use
- 6.1.2. Commercial Use
- 6.1.3. Others
- 6.2. Market Analysis, Insights and Forecast - by Types
- 6.2.1. Up to 20W
- 6.2.2. 20-30W
- 6.2.3. 30-60W
- 6.2.4. 60-100W
- 6.2.5. 100W~150W
- 6.2.6. 150W~200W
- 6.2.7. Above 200W
- 6.1. Market Analysis, Insights and Forecast - by Application
- 7. South America USB-C Charger Analysis, Insights and Forecast, 2020-2032
- 7.1. Market Analysis, Insights and Forecast - by Application
- 7.1.1. Individual Use
- 7.1.2. Commercial Use
- 7.1.3. Others
- 7.2. Market Analysis, Insights and Forecast - by Types
- 7.2.1. Up to 20W
- 7.2.2. 20-30W
- 7.2.3. 30-60W
- 7.2.4. 60-100W
- 7.2.5. 100W~150W
- 7.2.6. 150W~200W
- 7.2.7. Above 200W
- 7.1. Market Analysis, Insights and Forecast - by Application
- 8. Europe USB-C Charger Analysis, Insights and Forecast, 2020-2032
- 8.1. Market Analysis, Insights and Forecast - by Application
- 8.1.1. Individual Use
- 8.1.2. Commercial Use
- 8.1.3. Others
- 8.2. Market Analysis, Insights and Forecast - by Types
- 8.2.1. Up to 20W
- 8.2.2. 20-30W
- 8.2.3. 30-60W
- 8.2.4. 60-100W
- 8.2.5. 100W~150W
- 8.2.6. 150W~200W
- 8.2.7. Above 200W
- 8.1. Market Analysis, Insights and Forecast - by Application
- 9. Middle East & Africa USB-C Charger Analysis, Insights and Forecast, 2020-2032
- 9.1. Market Analysis, Insights and Forecast - by Application
- 9.1.1. Individual Use
- 9.1.2. Commercial Use
- 9.1.3. Others
- 9.2. Market Analysis, Insights and Forecast - by Types
- 9.2.1. Up to 20W
- 9.2.2. 20-30W
- 9.2.3. 30-60W
- 9.2.4. 60-100W
- 9.2.5. 100W~150W
- 9.2.6. 150W~200W
- 9.2.7. Above 200W
- 9.1. Market Analysis, Insights and Forecast - by Application
- 10. Asia Pacific USB-C Charger Analysis, Insights and Forecast, 2020-2032
- 10.1. Market Analysis, Insights and Forecast - by Application
- 10.1.1. Individual Use
- 10.1.2. Commercial Use
- 10.1.3. Others
- 10.2. Market Analysis, Insights and Forecast - by Types
- 10.2.1. Up to 20W
- 10.2.2. 20-30W
- 10.2.3. 30-60W
- 10.2.4. 60-100W
- 10.2.5. 100W~150W
- 10.2.6. 150W~200W
- 10.2.7. Above 200W
- 10.1. Market Analysis, Insights and Forecast - by Application
- 11. Competitive Analysis
- 11.1. Global Market Share Analysis 2025
- 11.2. Company Profiles
- 11.2.1 Anker
- 11.2.1.1. Overview
- 11.2.1.2. Products
- 11.2.1.3. SWOT Analysis
- 11.2.1.4. Recent Developments
- 11.2.1.5. Financials (Based on Availability)
- 11.2.2 Baseus
- 11.2.2.1. Overview
- 11.2.2.2. Products
- 11.2.2.3. SWOT Analysis
- 11.2.2.4. Recent Developments
- 11.2.2.5. Financials (Based on Availability)
- 11.2.3 Aohai Technology
- 11.2.3.1. Overview
- 11.2.3.2. Products
- 11.2.3.3. SWOT Analysis
- 11.2.3.4. Recent Developments
- 11.2.3.5. Financials (Based on Availability)
- 11.2.4 Mophie/Zagg
- 11.2.4.1. Overview
- 11.2.4.2. Products
- 11.2.4.3. SWOT Analysis
- 11.2.4.4. Recent Developments
- 11.2.4.5. Financials (Based on Availability)
- 11.2.5 Belkin
- 11.2.5.1. Overview
- 11.2.5.2. Products
- 11.2.5.3. SWOT Analysis
- 11.2.5.4. Recent Developments
- 11.2.5.5. Financials (Based on Availability)
- 11.2.6 Apple
- 11.2.6.1. Overview
- 11.2.6.2. Products
- 11.2.6.3. SWOT Analysis
- 11.2.6.4. Recent Developments
- 11.2.6.5. Financials (Based on Availability)
- 11.2.7 Ugreen
- 11.2.7.1. Overview
- 11.2.7.2. Products
- 11.2.7.3. SWOT Analysis
- 11.2.7.4. Recent Developments
- 11.2.7.5. Financials (Based on Availability)
- 11.2.8 Samsung
- 11.2.8.1. Overview
- 11.2.8.2. Products
- 11.2.8.3. SWOT Analysis
- 11.2.8.4. Recent Developments
- 11.2.8.5. Financials (Based on Availability)
- 11.2.9 Bull
- 11.2.9.1. Overview
- 11.2.9.2. Products
- 11.2.9.3. SWOT Analysis
- 11.2.9.4. Recent Developments
- 11.2.9.5. Financials (Based on Availability)
- 11.2.10 Aukey
- 11.2.10.1. Overview
- 11.2.10.2. Products
- 11.2.10.3. SWOT Analysis
- 11.2.10.4. Recent Developments
- 11.2.10.5. Financials (Based on Availability)
- 11.2.11 Pisen
- 11.2.11.1. Overview
- 11.2.11.2. Products
- 11.2.11.3. SWOT Analysis
- 11.2.11.4. Recent Developments
- 11.2.11.5. Financials (Based on Availability)
- 11.2.12 Amazon Basics
- 11.2.12.1. Overview
- 11.2.12.2. Products
- 11.2.12.3. SWOT Analysis
- 11.2.12.4. Recent Developments
- 11.2.12.5. Financials (Based on Availability)
- 11.2.13 Incipio
- 11.2.13.1. Overview
- 11.2.13.2. Products
- 11.2.13.3. SWOT Analysis
- 11.2.13.4. Recent Developments
- 11.2.13.5. Financials (Based on Availability)
- 11.2.14 Innergie
- 11.2.14.1. Overview
- 11.2.14.2. Products
- 11.2.14.3. SWOT Analysis
- 11.2.14.4. Recent Developments
- 11.2.14.5. Financials (Based on Availability)
- 11.2.15 iLuv
- 11.2.15.1. Overview
- 11.2.15.2. Products
- 11.2.15.3. SWOT Analysis
- 11.2.15.4. Recent Developments
- 11.2.15.5. Financials (Based on Availability)
- 11.2.16 RAVPower
- 11.2.16.1. Overview
- 11.2.16.2. Products
- 11.2.16.3. SWOT Analysis
- 11.2.16.4. Recent Developments
- 11.2.16.5. Financials (Based on Availability)
- 11.2.17 Monoprice
- 11.2.17.1. Overview
- 11.2.17.2. Products
- 11.2.17.3. SWOT Analysis
- 11.2.17.4. Recent Developments
- 11.2.17.5. Financials (Based on Availability)
- 11.2.18 Nomad
- 11.2.18.1. Overview
- 11.2.18.2. Products
- 11.2.18.3. SWOT Analysis
- 11.2.18.4. Recent Developments
- 11.2.18.5. Financials (Based on Availability)
- 11.2.19 Spigen
- 11.2.19.1. Overview
- 11.2.19.2. Products
- 11.2.19.3. SWOT Analysis
- 11.2.19.4. Recent Developments
- 11.2.19.5. Financials (Based on Availability)
- 11.2.20 Shenzhen JOWAY
- 11.2.20.1. Overview
- 11.2.20.2. Products
- 11.2.20.3. SWOT Analysis
- 11.2.20.4. Recent Developments
- 11.2.20.5. Financials (Based on Availability)
- 11.2.21 Ventev
- 11.2.21.1. Overview
- 11.2.21.2. Products
- 11.2.21.3. SWOT Analysis
- 11.2.21.4. Recent Developments
- 11.2.21.5. Financials (Based on Availability)
- 11.2.22 Razer
- 11.2.22.1. Overview
- 11.2.22.2. Products
- 11.2.22.3. SWOT Analysis
- 11.2.22.4. Recent Developments
- 11.2.22.5. Financials (Based on Availability)
- 11.2.23 Philips
- 11.2.23.1. Overview
- 11.2.23.2. Products
- 11.2.23.3. SWOT Analysis
- 11.2.23.4. Recent Developments
- 11.2.23.5. Financials (Based on Availability)
- 11.2.24 Cygnett
- 11.2.24.1. Overview
- 11.2.24.2. Products
- 11.2.24.3. SWOT Analysis
- 11.2.24.4. Recent Developments
- 11.2.24.5. Financials (Based on Availability)
- 11.2.25 IOGEAR
- 11.2.25.1. Overview
- 11.2.25.2. Products
- 11.2.25.3. SWOT Analysis
- 11.2.25.4. Recent Developments
- 11.2.25.5. Financials (Based on Availability)
- 11.2.1 Anker
List of Figures
- Figure 1: Global USB-C Charger Revenue Breakdown (billion, %) by Region 2025 & 2033
- Figure 2: North America USB-C Charger Revenue (billion), by Application 2025 & 2033
- Figure 3: North America USB-C Charger Revenue Share (%), by Application 2025 & 2033
- Figure 4: North America USB-C Charger Revenue (billion), by Types 2025 & 2033
- Figure 5: North America USB-C Charger Revenue Share (%), by Types 2025 & 2033
- Figure 6: North America USB-C Charger Revenue (billion), by Country 2025 & 2033
- Figure 7: North America USB-C Charger Revenue Share (%), by Country 2025 & 2033
- Figure 8: South America USB-C Charger Revenue (billion), by Application 2025 & 2033
- Figure 9: South America USB-C Charger Revenue Share (%), by Application 2025 & 2033
- Figure 10: South America USB-C Charger Revenue (billion), by Types 2025 & 2033
- Figure 11: South America USB-C Charger Revenue Share (%), by Types 2025 & 2033
- Figure 12: South America USB-C Charger Revenue (billion), by Country 2025 & 2033
- Figure 13: South America USB-C Charger Revenue Share (%), by Country 2025 & 2033
- Figure 14: Europe USB-C Charger Revenue (billion), by Application 2025 & 2033
- Figure 15: Europe USB-C Charger Revenue Share (%), by Application 2025 & 2033
- Figure 16: Europe USB-C Charger Revenue (billion), by Types 2025 & 2033
- Figure 17: Europe USB-C Charger Revenue Share (%), by Types 2025 & 2033
- Figure 18: Europe USB-C Charger Revenue (billion), by Country 2025 & 2033
- Figure 19: Europe USB-C Charger Revenue Share (%), by Country 2025 & 2033
- Figure 20: Middle East & Africa USB-C Charger Revenue (billion), by Application 2025 & 2033
- Figure 21: Middle East & Africa USB-C Charger Revenue Share (%), by Application 2025 & 2033
- Figure 22: Middle East & Africa USB-C Charger Revenue (billion), by Types 2025 & 2033
- Figure 23: Middle East & Africa USB-C Charger Revenue Share (%), by Types 2025 & 2033
- Figure 24: Middle East & Africa USB-C Charger Revenue (billion), by Country 2025 & 2033
- Figure 25: Middle East & Africa USB-C Charger Revenue Share (%), by Country 2025 & 2033
- Figure 26: Asia Pacific USB-C Charger Revenue (billion), by Application 2025 & 2033
- Figure 27: Asia Pacific USB-C Charger Revenue Share (%), by Application 2025 & 2033
- Figure 28: Asia Pacific USB-C Charger Revenue (billion), by Types 2025 & 2033
- Figure 29: Asia Pacific USB-C Charger Revenue Share (%), by Types 2025 & 2033
- Figure 30: Asia Pacific USB-C Charger Revenue (billion), by Country 2025 & 2033
- Figure 31: Asia Pacific USB-C Charger Revenue Share (%), by Country 2025 & 2033
List of Tables
- Table 1: Global USB-C Charger Revenue billion Forecast, by Application 2020 & 2033
- Table 2: Global USB-C Charger Revenue billion Forecast, by Types 2020 & 2033
- Table 3: Global USB-C Charger Revenue billion Forecast, by Region 2020 & 2033
- Table 4: Global USB-C Charger Revenue billion Forecast, by Application 2020 & 2033
- Table 5: Global USB-C Charger Revenue billion Forecast, by Types 2020 & 2033
- Table 6: Global USB-C Charger Revenue billion Forecast, by Country 2020 & 2033
- Table 7: United States USB-C Charger Revenue (billion) Forecast, by Application 2020 & 2033
- Table 8: Canada USB-C Charger Revenue (billion) Forecast, by Application 2020 & 2033
- Table 9: Mexico USB-C Charger Revenue (billion) Forecast, by Application 2020 & 2033
- Table 10: Global USB-C Charger Revenue billion Forecast, by Application 2020 & 2033
- Table 11: Global USB-C Charger Revenue billion Forecast, by Types 2020 & 2033
- Table 12: Global USB-C Charger Revenue billion Forecast, by Country 2020 & 2033
- Table 13: Brazil USB-C Charger Revenue (billion) Forecast, by Application 2020 & 2033
- Table 14: Argentina USB-C Charger Revenue (billion) Forecast, by Application 2020 & 2033
- Table 15: Rest of South America USB-C Charger Revenue (billion) Forecast, by Application 2020 & 2033
- Table 16: Global USB-C Charger Revenue billion Forecast, by Application 2020 & 2033
- Table 17: Global USB-C Charger Revenue billion Forecast, by Types 2020 & 2033
- Table 18: Global USB-C Charger Revenue billion Forecast, by Country 2020 & 2033
- Table 19: United Kingdom USB-C Charger Revenue (billion) Forecast, by Application 2020 & 2033
- Table 20: Germany USB-C Charger Revenue (billion) Forecast, by Application 2020 & 2033
- Table 21: France USB-C Charger Revenue (billion) Forecast, by Application 2020 & 2033
- Table 22: Italy USB-C Charger Revenue (billion) Forecast, by Application 2020 & 2033
- Table 23: Spain USB-C Charger Revenue (billion) Forecast, by Application 2020 & 2033
- Table 24: Russia USB-C Charger Revenue (billion) Forecast, by Application 2020 & 2033
- Table 25: Benelux USB-C Charger Revenue (billion) Forecast, by Application 2020 & 2033
- Table 26: Nordics USB-C Charger Revenue (billion) Forecast, by Application 2020 & 2033
- Table 27: Rest of Europe USB-C Charger Revenue (billion) Forecast, by Application 2020 & 2033
- Table 28: Global USB-C Charger Revenue billion Forecast, by Application 2020 & 2033
- Table 29: Global USB-C Charger Revenue billion Forecast, by Types 2020 & 2033
- Table 30: Global USB-C Charger Revenue billion Forecast, by Country 2020 & 2033
- Table 31: Turkey USB-C Charger Revenue (billion) Forecast, by Application 2020 & 2033
- Table 32: Israel USB-C Charger Revenue (billion) Forecast, by Application 2020 & 2033
- Table 33: GCC USB-C Charger Revenue (billion) Forecast, by Application 2020 & 2033
- Table 34: North Africa USB-C Charger Revenue (billion) Forecast, by Application 2020 & 2033
- Table 35: South Africa USB-C Charger Revenue (billion) Forecast, by Application 2020 & 2033
- Table 36: Rest of Middle East & Africa USB-C Charger Revenue (billion) Forecast, by Application 2020 & 2033
- Table 37: Global USB-C Charger Revenue billion Forecast, by Application 2020 & 2033
- Table 38: Global USB-C Charger Revenue billion Forecast, by Types 2020 & 2033
- Table 39: Global USB-C Charger Revenue billion Forecast, by Country 2020 & 2033
- Table 40: China USB-C Charger Revenue (billion) Forecast, by Application 2020 & 2033
- Table 41: India USB-C Charger Revenue (billion) Forecast, by Application 2020 & 2033
- Table 42: Japan USB-C Charger Revenue (billion) Forecast, by Application 2020 & 2033
- Table 43: South Korea USB-C Charger Revenue (billion) Forecast, by Application 2020 & 2033
- Table 44: ASEAN USB-C Charger Revenue (billion) Forecast, by Application 2020 & 2033
- Table 45: Oceania USB-C Charger Revenue (billion) Forecast, by Application 2020 & 2033
- Table 46: Rest of Asia Pacific USB-C Charger Revenue (billion) Forecast, by Application 2020 & 2033
Frequently Asked Questions
1. What is the projected Compound Annual Growth Rate (CAGR) of the USB-C Charger?
The projected CAGR is approximately 17%.
2. Which companies are prominent players in the USB-C Charger?
Key companies in the market include Anker, Baseus, Aohai Technology, Mophie/Zagg, Belkin, Apple, Ugreen, Samsung, Bull, Aukey, Pisen, Amazon Basics, Incipio, Innergie, iLuv, RAVPower, Monoprice, Nomad, Spigen, Shenzhen JOWAY, Ventev, Razer, Philips, Cygnett, IOGEAR.
3. What are the main segments of the USB-C Charger?
The market segments include Application, Types.
4. Can you provide details about the market size?
The market size is estimated to be USD 4.09 billion as of 2022.
5. What are some drivers contributing to market growth?
N/A
6. What are the notable trends driving market growth?
N/A
7. Are there any restraints impacting market growth?
N/A
8. Can you provide examples of recent developments in the market?
N/A
9. What pricing options are available for accessing the report?
Pricing options include single-user, multi-user, and enterprise licenses priced at USD 2900.00, USD 4350.00, and USD 5800.00 respectively.
10. Is the market size provided in terms of value or volume?
The market size is provided in terms of value, measured in billion.
11. Are there any specific market keywords associated with the report?
Yes, the market keyword associated with the report is "USB-C Charger," which aids in identifying and referencing the specific market segment covered.
12. How do I determine which pricing option suits my needs best?
The pricing options vary based on user requirements and access needs. Individual users may opt for single-user licenses, while businesses requiring broader access may choose multi-user or enterprise licenses for cost-effective access to the report.
13. Are there any additional resources or data provided in the USB-C Charger report?
While the report offers comprehensive insights, it's advisable to review the specific contents or supplementary materials provided to ascertain if additional resources or data are available.
14. How can I stay updated on further developments or reports in the USB-C Charger?
To stay informed about further developments, trends, and reports in the USB-C Charger, consider subscribing to industry newsletters, following relevant companies and organizations, or regularly checking reputable industry news sources and publications.
Methodology
Step 1 - Identification of Relevant Samples Size from Population Database


Step 2 - Approaches for Defining Global Market Size (Value, Volume* & Price*)

Note*: In applicable scenarios
Step 3 - Data Sources
Primary Research
- Web Analytics
- Survey Reports
- Research Institute
- Latest Research Reports
- Opinion Leaders
Secondary Research
- Annual Reports
- White Paper
- Latest Press Release
- Industry Association
- Paid Database
- Investor Presentations

Step 4 - Data Triangulation
Involves using different sources of information in order to increase the validity of a study
These sources are likely to be stakeholders in a program - participants, other researchers, program staff, other community members, and so on.
Then we put all data in single framework & apply various statistical tools to find out the dynamic on the market.
During the analysis stage, feedback from the stakeholder groups would be compared to determine areas of agreement as well as areas of divergence