

Key Insights
The US vertical farming market is experiencing robust growth, projected to reach a substantial size by 2033. Driven by increasing urbanization, rising consumer demand for fresh, locally sourced produce, and concerns regarding food security and sustainability, the market is poised for significant expansion. The adoption of innovative technologies like aeroponics, hydroponics, and aquaponics is further fueling this growth. Different vertical farming structures, including building-based and shipping container farms, cater to diverse needs and scales of operations. The market is segmented by crop type, with fruits and vegetables, herbs and microgreens, and flowers and ornamentals representing major segments. Key players like Bowery Farming, AeroFarms, and Plenty Unlimited are driving innovation and market penetration, demonstrating the sector's maturity and potential. While challenges remain, including high initial investment costs and technological complexities, the long-term prospects for the US vertical farming market remain highly positive, fueled by ongoing technological advancements and increasing consumer awareness of sustainable food production methods.
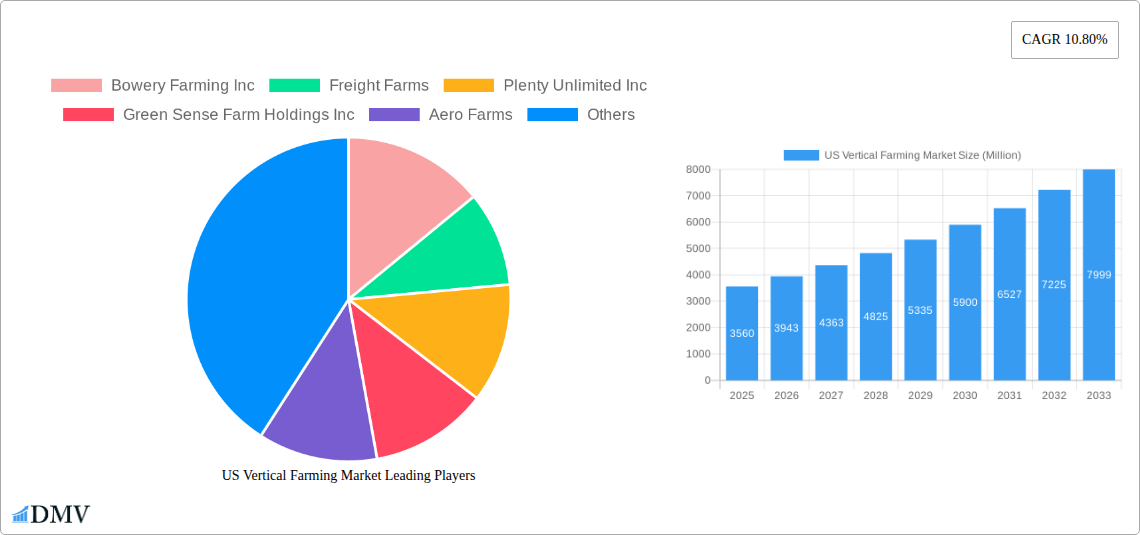
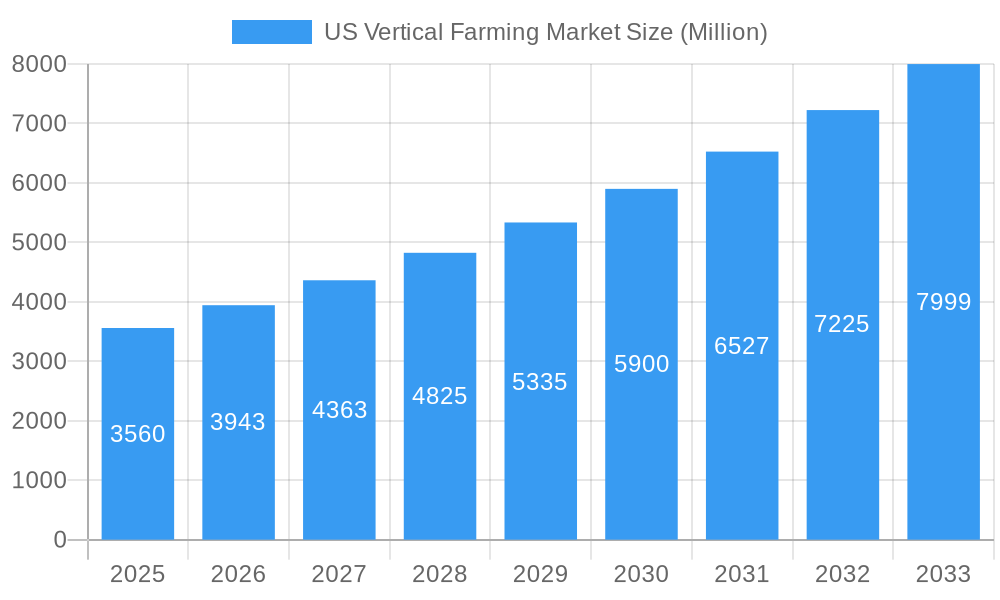
US Vertical Farming Market Market Size (In Billion)
The Northeast region currently holds a significant share of the US vertical farming market due to higher population density and consumer acceptance of novel farming techniques. However, growth is anticipated across all regions as awareness increases and technological advancements lead to cost reductions and wider accessibility. The market's CAGR of 10.80% indicates a consistently strong growth trajectory, promising further expansion in the coming years. The focus on specific crop types reflects market demand and the unique capabilities of vertical farming technologies to optimize growth conditions for various plants. Further research and development efforts are expected to improve efficiency, reduce costs, and broaden the range of crops successfully cultivated using vertical farming methods, thus contributing to the overall market expansion.
US Vertical Farming Market Company Market Share
US Vertical Farming Market: A Comprehensive Market Report (2019-2033)
This insightful report provides a detailed analysis of the burgeoning US Vertical Farming Market, offering invaluable insights for stakeholders seeking to navigate this rapidly evolving sector. With a study period spanning 2019-2033, a base year of 2025, and a forecast period of 2025-2033, this report delivers a comprehensive overview of market trends, key players, and future opportunities. The market is projected to reach xx Million by 2033, showcasing significant growth potential.
US Vertical Farming Market Composition & Trends
This section delves into the competitive landscape of the US vertical farming market, analyzing market concentration, innovation drivers, regulatory frameworks, substitute products, end-user profiles, and mergers & acquisitions (M&A) activity. The market exhibits a moderately consolidated structure, with key players such as Bowery Farming Inc., Aero Farms, and Plenty Unlimited Inc. holding significant market share. However, the entry of numerous startups and smaller players points to a dynamic and competitive environment.
- Market Share Distribution: Aero Farms holds an estimated xx% market share in 2025, followed by Bowery Farming Inc. at xx% and Plenty Unlimited Inc. at xx%. The remaining market share is distributed among various smaller players.
- Innovation Catalysts: Technological advancements in areas like AI-powered automation, improved lighting systems, and advanced hydroponic techniques are driving market innovation.
- Regulatory Landscape: Federal and state-level regulations concerning food safety, environmental impact, and labor practices are shaping the market's trajectory. The evolving regulatory environment presents both opportunities and challenges for market participants.
- Substitute Products: Traditional agriculture remains the primary substitute, though vertical farming offers advantages in terms of sustainability and year-round production.
- End-User Profiles: Major end-users include grocery retailers, restaurants, food service providers, and direct-to-consumer sales channels. The increasing demand for locally sourced and sustainably produced food is fueling market growth.
- M&A Activity: The market has witnessed a notable increase in M&A activity in recent years, with deal values ranging from xx Million to xx Million. These activities reflect strategic consolidation and expansion efforts by established players.
US Vertical Farming Market Industry Evolution
This section explores the historical and projected growth trajectories of the US vertical farming market. The market experienced a Compound Annual Growth Rate (CAGR) of xx% during the historical period (2019-2024), driven by increasing consumer demand for fresh produce, advancements in vertical farming technologies, and rising concerns about food security and sustainability. Technological innovations, such as the development of more efficient hydroponic systems and the integration of AI in farming operations, are accelerating market growth. Shifting consumer preferences towards locally sourced, healthy, and sustainably produced food are also significant drivers. The forecast period (2025-2033) anticipates a CAGR of xx%, fueled by ongoing technological advancements, expanding market applications, and increasing investments in the sector.
The adoption rate of vertical farming technologies is also steadily increasing, with a significant rise observed among large-scale commercial operations. This adoption is further bolstered by government initiatives promoting sustainable agriculture and food security.
Leading Regions, Countries, or Segments in US Vertical Farming Market
The US vertical farming market shows significant regional variations in growth and adoption. While data specifics are not readily available to determine a singular 'leading' region, we can analyze the key segment drivers.
Growth Mechanism:
- Hydroponics: Currently dominates the market due to its relatively lower initial investment and established technology. Key drivers include its scalability and high yield potential.
- Aeroponics: Shows strong growth potential due to its high efficiency and reduced water usage. Investment in research and development is a key driver.
- Aquaponics: Represents a niche segment with opportunities for sustainable and integrated farming systems. Growing consumer awareness of sustainable practices is a key driver.
Structure:
- Building-based Vertical Farms: This segment holds the largest market share, benefiting from readily available infrastructure and larger-scale operations. Significant investments from venture capitalists and large corporations contribute to this segment's dominance.
- Shipping Container Vertical Farms: Offers advantages of mobility and suitability for smaller-scale operations. Growth is driven by its affordability and ease of setup.
Crop Type:
- Fruits and Vegetables: This segment represents the largest portion of the market, driven by high consumer demand and diverse crop options. The development of varieties suitable for vertical farming is a crucial driver.
- Herbs and Microgreens: Experiences rapid growth due to high profitability and shorter growth cycles. The increasing popularity of these crops in the culinary sector is a key driver.
US Vertical Farming Market Product Innovations
Recent innovations focus on enhancing crop yields, optimizing resource utilization, and improving automation. Companies are developing advanced lighting systems, tailored nutrient solutions, and sophisticated environmental controls to maximize productivity and product quality. The integration of AI and machine learning in farm management is enabling precise control over environmental conditions and predictive analytics for yield optimization. Unique selling propositions include increased yield per square foot, reduced water and pesticide usage, and year-round production of high-quality produce.
Propelling Factors for US Vertical Farming Market Growth
The US vertical farming market is propelled by several key factors: increasing consumer demand for fresh, locally grown produce; growing concerns about food security and sustainability; advancements in technology leading to higher efficiency and yields; supportive government policies promoting sustainable agriculture; and rising investments from venture capitalists and large corporations. The need for climate-resilient agriculture and reduced transportation costs are also driving growth.
Obstacles in the US Vertical Farming Market
The market faces challenges such as high initial capital investment, operational complexity, technological limitations, and the need for skilled labor. Competition from traditional agriculture, energy costs, and potential supply chain disruptions also pose significant hurdles. Regulatory uncertainties and variations across different states can also present obstacles to market expansion.
Future Opportunities in US Vertical Farming Market
Future opportunities lie in technological advancements such as advanced automation, AI-driven optimization, and the development of new crop varieties suitable for vertical farming. Expansion into new markets, including developing countries, and tapping into unmet consumer needs for niche and specialty crops presents significant growth potential.
Major Players in the US Vertical Farming Market Ecosystem
- Bowery Farming Inc
- Freight Farms
- Plenty Unlimited Inc
- Green Sense Farm Holdings Inc
- Aero Farms
- Altius Farm
- Green Spirit Farms
Key Developments in US Vertical Farming Market Industry
- August 2023: Plenty Unlimited Inc. commences construction on a USD 300 Million vertical farming campus in Meadowville Technology Park, projected to be the world's largest.
- February 2022: Aero Farms partners with FFAR and the University of Florida to research high-yielding, flavorful tomatoes for vertical farms.
- January 2022: Plenty and Walmart announce a long-term investment to deliver fresh produce to consumers year-round.
Strategic US Vertical Farming Market Forecast
The US vertical farming market is poised for significant growth over the next decade, driven by technological advancements, increasing consumer demand for sustainable food, and supportive government policies. Opportunities exist in optimizing production processes, expanding into new crop types, and developing innovative business models. The market's future is bright, with potential for substantial expansion and contribution to a more sustainable and resilient food system.
US Vertical Farming Market Segmentation
- 1. Production Analysis
- 2. Consumption Analysis
- 3. Import Market Analysis (Value & Volume)
- 4. Export Market Analysis (Value & Volume)
- 5. Price Trend Analysis
US Vertical Farming Market Segmentation By Geography
-
1. North America
- 1.1. United States
- 1.2. Canada
- 1.3. Mexico
-
2. South America
- 2.1. Brazil
- 2.2. Argentina
- 2.3. Rest of South America
-
3. Europe
- 3.1. United Kingdom
- 3.2. Germany
- 3.3. France
- 3.4. Italy
- 3.5. Spain
- 3.6. Russia
- 3.7. Benelux
- 3.8. Nordics
- 3.9. Rest of Europe
-
4. Middle East & Africa
- 4.1. Turkey
- 4.2. Israel
- 4.3. GCC
- 4.4. North Africa
- 4.5. South Africa
- 4.6. Rest of Middle East & Africa
-
5. Asia Pacific
- 5.1. China
- 5.2. India
- 5.3. Japan
- 5.4. South Korea
- 5.5. ASEAN
- 5.6. Oceania
- 5.7. Rest of Asia Pacific
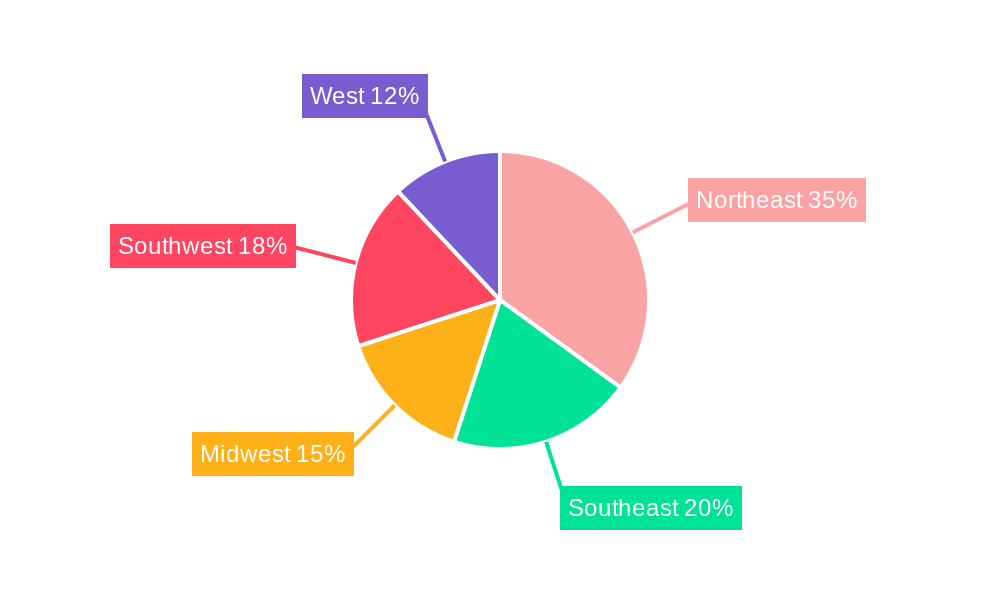
US Vertical Farming Market Regional Market Share
Geographic Coverage of US Vertical Farming Market
US Vertical Farming Market REPORT HIGHLIGHTS
| Aspects | Details |
|---|---|
| Study Period | 2020-2034 |
| Base Year | 2025 |
| Estimated Year | 2026 |
| Forecast Period | 2026-2034 |
| Historical Period | 2020-2025 |
| Growth Rate | CAGR of 10.80% from 2020-2034 |
| Segmentation |
|
Table of Contents
- 1. Introduction
- 1.1. Research Scope
- 1.2. Market Segmentation
- 1.3. Research Objective
- 1.4. Definitions and Assumptions
- 2. Executive Summary
- 2.1. Market Snapshot
- 3. Market Dynamics
- 3.1. Market Drivers
- 3.2. Market Restrains
- 3.3. Market Trends
- 3.4. Market Opportunities
- 4. Market Factor Analysis
- 4.1. Porters Five Forces
- 4.1.1. Bargaining Power of Suppliers
- 4.1.2. Bargaining Power of Buyers
- 4.1.3. Threat of New Entrants
- 4.1.4. Threat of Substitutes
- 4.1.5. Competitive Rivalry
- 4.2. PESTEL analysis
- 4.3. BCG Analysis
- 4.3.1. Stars (High Growth, High Market Share)
- 4.3.2. Cash Cows (Low Growth, High Market Share)
- 4.3.3. Question Mark (High Growth, Low Market Share)
- 4.3.4. Dogs (Low Growth, Low Market Share)
- 4.4. Ansoff Matrix Analysis
- 4.5. Supply Chain Analysis
- 4.6. Regulatory Landscape
- 4.7. Current Market Potential and Opportunity Assessment (TAM–SAM–SOM Framework)
- 4.8. DMV Analyst Note
- 4.1. Porters Five Forces
- 5. Market Analysis, Insights and Forecast 2021-2033
- 5.1. Market Analysis, Insights and Forecast - by Production Analysis
- 5.2. Market Analysis, Insights and Forecast - by Consumption Analysis
- 5.3. Market Analysis, Insights and Forecast - by Import Market Analysis (Value & Volume)
- 5.4. Market Analysis, Insights and Forecast - by Export Market Analysis (Value & Volume)
- 5.5. Market Analysis, Insights and Forecast - by Price Trend Analysis
- 5.6. Market Analysis, Insights and Forecast - by Region
- 5.6.1. North America
- 5.6.2. South America
- 5.6.3. Europe
- 5.6.4. Middle East & Africa
- 5.6.5. Asia Pacific
- 6. Global US Vertical Farming Market Analysis, Insights and Forecast, 2021-2033
- 6.1. Market Analysis, Insights and Forecast - by Production Analysis
- 6.2. Market Analysis, Insights and Forecast - by Consumption Analysis
- 6.3. Market Analysis, Insights and Forecast - by Import Market Analysis (Value & Volume)
- 6.4. Market Analysis, Insights and Forecast - by Export Market Analysis (Value & Volume)
- 6.5. Market Analysis, Insights and Forecast - by Price Trend Analysis
- 7. North America US Vertical Farming Market Analysis, Insights and Forecast, 2020-2032
- 7.1. Market Analysis, Insights and Forecast - by Production Analysis
- 7.2. Market Analysis, Insights and Forecast - by Consumption Analysis
- 7.3. Market Analysis, Insights and Forecast - by Import Market Analysis (Value & Volume)
- 7.4. Market Analysis, Insights and Forecast - by Export Market Analysis (Value & Volume)
- 7.5. Market Analysis, Insights and Forecast - by Price Trend Analysis
- 8. South America US Vertical Farming Market Analysis, Insights and Forecast, 2020-2032
- 8.1. Market Analysis, Insights and Forecast - by Production Analysis
- 8.2. Market Analysis, Insights and Forecast - by Consumption Analysis
- 8.3. Market Analysis, Insights and Forecast - by Import Market Analysis (Value & Volume)
- 8.4. Market Analysis, Insights and Forecast - by Export Market Analysis (Value & Volume)
- 8.5. Market Analysis, Insights and Forecast - by Price Trend Analysis
- 9. Europe US Vertical Farming Market Analysis, Insights and Forecast, 2020-2032
- 9.1. Market Analysis, Insights and Forecast - by Production Analysis
- 9.2. Market Analysis, Insights and Forecast - by Consumption Analysis
- 9.3. Market Analysis, Insights and Forecast - by Import Market Analysis (Value & Volume)
- 9.4. Market Analysis, Insights and Forecast - by Export Market Analysis (Value & Volume)
- 9.5. Market Analysis, Insights and Forecast - by Price Trend Analysis
- 10. Middle East & Africa US Vertical Farming Market Analysis, Insights and Forecast, 2020-2032
- 10.1. Market Analysis, Insights and Forecast - by Production Analysis
- 10.2. Market Analysis, Insights and Forecast - by Consumption Analysis
- 10.3. Market Analysis, Insights and Forecast - by Import Market Analysis (Value & Volume)
- 10.4. Market Analysis, Insights and Forecast - by Export Market Analysis (Value & Volume)
- 10.5. Market Analysis, Insights and Forecast - by Price Trend Analysis
- 11. Asia Pacific US Vertical Farming Market Analysis, Insights and Forecast, 2020-2032
- 11.1. Market Analysis, Insights and Forecast - by Production Analysis
- 11.2. Market Analysis, Insights and Forecast - by Consumption Analysis
- 11.3. Market Analysis, Insights and Forecast - by Import Market Analysis (Value & Volume)
- 11.4. Market Analysis, Insights and Forecast - by Export Market Analysis (Value & Volume)
- 11.5. Market Analysis, Insights and Forecast - by Price Trend Analysis
- 12. Competitive Analysis
- 12.1. Company Profiles
- 12.1.1 Bowery Farming Inc
- 12.1.1.1. Company Overview
- 12.1.1.2. Products
- 12.1.1.3. Company Financials
- 12.1.1.4. SWOT Analysis
- 12.1.2 Freight Farms
- 12.1.2.1. Company Overview
- 12.1.2.2. Products
- 12.1.2.3. Company Financials
- 12.1.2.4. SWOT Analysis
- 12.1.3 Plenty Unlimited Inc
- 12.1.3.1. Company Overview
- 12.1.3.2. Products
- 12.1.3.3. Company Financials
- 12.1.3.4. SWOT Analysis
- 12.1.4 Green Sense Farm Holdings Inc
- 12.1.4.1. Company Overview
- 12.1.4.2. Products
- 12.1.4.3. Company Financials
- 12.1.4.4. SWOT Analysis
- 12.1.5 Aero Farms
- 12.1.5.1. Company Overview
- 12.1.5.2. Products
- 12.1.5.3. Company Financials
- 12.1.5.4. SWOT Analysis
- 12.1.6 Altius Farm
- 12.1.6.1. Company Overview
- 12.1.6.2. Products
- 12.1.6.3. Company Financials
- 12.1.6.4. SWOT Analysis
- 12.1.7 Green Spirit Farms
- 12.1.7.1. Company Overview
- 12.1.7.2. Products
- 12.1.7.3. Company Financials
- 12.1.7.4. SWOT Analysis
- 12.1.1 Bowery Farming Inc
- 12.2. Market Entropy
- 12.2.1 Company's Key Areas Served
- 12.2.2 Recent Developments
- 12.3. Company Market Share Analysis 2025
- 12.3.1 Top 5 Companies Market Share Analysis
- 12.3.2 Top 3 Companies Market Share Analysis
- 12.4. List of Potential Customers
- 13. Research Methodology
List of Figures
- Figure 1: Global US Vertical Farming Market Revenue Breakdown (Million, %) by Region 2025 & 2033
- Figure 2: North America US Vertical Farming Market Revenue (Million), by Production Analysis 2025 & 2033
- Figure 3: North America US Vertical Farming Market Revenue Share (%), by Production Analysis 2025 & 2033
- Figure 4: North America US Vertical Farming Market Revenue (Million), by Consumption Analysis 2025 & 2033
- Figure 5: North America US Vertical Farming Market Revenue Share (%), by Consumption Analysis 2025 & 2033
- Figure 6: North America US Vertical Farming Market Revenue (Million), by Import Market Analysis (Value & Volume) 2025 & 2033
- Figure 7: North America US Vertical Farming Market Revenue Share (%), by Import Market Analysis (Value & Volume) 2025 & 2033
- Figure 8: North America US Vertical Farming Market Revenue (Million), by Export Market Analysis (Value & Volume) 2025 & 2033
- Figure 9: North America US Vertical Farming Market Revenue Share (%), by Export Market Analysis (Value & Volume) 2025 & 2033
- Figure 10: North America US Vertical Farming Market Revenue (Million), by Price Trend Analysis 2025 & 2033
- Figure 11: North America US Vertical Farming Market Revenue Share (%), by Price Trend Analysis 2025 & 2033
- Figure 12: North America US Vertical Farming Market Revenue (Million), by Country 2025 & 2033
- Figure 13: North America US Vertical Farming Market Revenue Share (%), by Country 2025 & 2033
- Figure 14: South America US Vertical Farming Market Revenue (Million), by Production Analysis 2025 & 2033
- Figure 15: South America US Vertical Farming Market Revenue Share (%), by Production Analysis 2025 & 2033
- Figure 16: South America US Vertical Farming Market Revenue (Million), by Consumption Analysis 2025 & 2033
- Figure 17: South America US Vertical Farming Market Revenue Share (%), by Consumption Analysis 2025 & 2033
- Figure 18: South America US Vertical Farming Market Revenue (Million), by Import Market Analysis (Value & Volume) 2025 & 2033
- Figure 19: South America US Vertical Farming Market Revenue Share (%), by Import Market Analysis (Value & Volume) 2025 & 2033
- Figure 20: South America US Vertical Farming Market Revenue (Million), by Export Market Analysis (Value & Volume) 2025 & 2033
- Figure 21: South America US Vertical Farming Market Revenue Share (%), by Export Market Analysis (Value & Volume) 2025 & 2033
- Figure 22: South America US Vertical Farming Market Revenue (Million), by Price Trend Analysis 2025 & 2033
- Figure 23: South America US Vertical Farming Market Revenue Share (%), by Price Trend Analysis 2025 & 2033
- Figure 24: South America US Vertical Farming Market Revenue (Million), by Country 2025 & 2033
- Figure 25: South America US Vertical Farming Market Revenue Share (%), by Country 2025 & 2033
- Figure 26: Europe US Vertical Farming Market Revenue (Million), by Production Analysis 2025 & 2033
- Figure 27: Europe US Vertical Farming Market Revenue Share (%), by Production Analysis 2025 & 2033
- Figure 28: Europe US Vertical Farming Market Revenue (Million), by Consumption Analysis 2025 & 2033
- Figure 29: Europe US Vertical Farming Market Revenue Share (%), by Consumption Analysis 2025 & 2033
- Figure 30: Europe US Vertical Farming Market Revenue (Million), by Import Market Analysis (Value & Volume) 2025 & 2033
- Figure 31: Europe US Vertical Farming Market Revenue Share (%), by Import Market Analysis (Value & Volume) 2025 & 2033
- Figure 32: Europe US Vertical Farming Market Revenue (Million), by Export Market Analysis (Value & Volume) 2025 & 2033
- Figure 33: Europe US Vertical Farming Market Revenue Share (%), by Export Market Analysis (Value & Volume) 2025 & 2033
- Figure 34: Europe US Vertical Farming Market Revenue (Million), by Price Trend Analysis 2025 & 2033
- Figure 35: Europe US Vertical Farming Market Revenue Share (%), by Price Trend Analysis 2025 & 2033
- Figure 36: Europe US Vertical Farming Market Revenue (Million), by Country 2025 & 2033
- Figure 37: Europe US Vertical Farming Market Revenue Share (%), by Country 2025 & 2033
- Figure 38: Middle East & Africa US Vertical Farming Market Revenue (Million), by Production Analysis 2025 & 2033
- Figure 39: Middle East & Africa US Vertical Farming Market Revenue Share (%), by Production Analysis 2025 & 2033
- Figure 40: Middle East & Africa US Vertical Farming Market Revenue (Million), by Consumption Analysis 2025 & 2033
- Figure 41: Middle East & Africa US Vertical Farming Market Revenue Share (%), by Consumption Analysis 2025 & 2033
- Figure 42: Middle East & Africa US Vertical Farming Market Revenue (Million), by Import Market Analysis (Value & Volume) 2025 & 2033
- Figure 43: Middle East & Africa US Vertical Farming Market Revenue Share (%), by Import Market Analysis (Value & Volume) 2025 & 2033
- Figure 44: Middle East & Africa US Vertical Farming Market Revenue (Million), by Export Market Analysis (Value & Volume) 2025 & 2033
- Figure 45: Middle East & Africa US Vertical Farming Market Revenue Share (%), by Export Market Analysis (Value & Volume) 2025 & 2033
- Figure 46: Middle East & Africa US Vertical Farming Market Revenue (Million), by Price Trend Analysis 2025 & 2033
- Figure 47: Middle East & Africa US Vertical Farming Market Revenue Share (%), by Price Trend Analysis 2025 & 2033
- Figure 48: Middle East & Africa US Vertical Farming Market Revenue (Million), by Country 2025 & 2033
- Figure 49: Middle East & Africa US Vertical Farming Market Revenue Share (%), by Country 2025 & 2033
- Figure 50: Asia Pacific US Vertical Farming Market Revenue (Million), by Production Analysis 2025 & 2033
- Figure 51: Asia Pacific US Vertical Farming Market Revenue Share (%), by Production Analysis 2025 & 2033
- Figure 52: Asia Pacific US Vertical Farming Market Revenue (Million), by Consumption Analysis 2025 & 2033
- Figure 53: Asia Pacific US Vertical Farming Market Revenue Share (%), by Consumption Analysis 2025 & 2033
- Figure 54: Asia Pacific US Vertical Farming Market Revenue (Million), by Import Market Analysis (Value & Volume) 2025 & 2033
- Figure 55: Asia Pacific US Vertical Farming Market Revenue Share (%), by Import Market Analysis (Value & Volume) 2025 & 2033
- Figure 56: Asia Pacific US Vertical Farming Market Revenue (Million), by Export Market Analysis (Value & Volume) 2025 & 2033
- Figure 57: Asia Pacific US Vertical Farming Market Revenue Share (%), by Export Market Analysis (Value & Volume) 2025 & 2033
- Figure 58: Asia Pacific US Vertical Farming Market Revenue (Million), by Price Trend Analysis 2025 & 2033
- Figure 59: Asia Pacific US Vertical Farming Market Revenue Share (%), by Price Trend Analysis 2025 & 2033
- Figure 60: Asia Pacific US Vertical Farming Market Revenue (Million), by Country 2025 & 2033
- Figure 61: Asia Pacific US Vertical Farming Market Revenue Share (%), by Country 2025 & 2033
List of Tables
- Table 1: Global US Vertical Farming Market Revenue Million Forecast, by Production Analysis 2020 & 2033
- Table 2: Global US Vertical Farming Market Revenue Million Forecast, by Consumption Analysis 2020 & 2033
- Table 3: Global US Vertical Farming Market Revenue Million Forecast, by Import Market Analysis (Value & Volume) 2020 & 2033
- Table 4: Global US Vertical Farming Market Revenue Million Forecast, by Export Market Analysis (Value & Volume) 2020 & 2033
- Table 5: Global US Vertical Farming Market Revenue Million Forecast, by Price Trend Analysis 2020 & 2033
- Table 6: Global US Vertical Farming Market Revenue Million Forecast, by Region 2020 & 2033
- Table 7: Global US Vertical Farming Market Revenue Million Forecast, by Production Analysis 2020 & 2033
- Table 8: Global US Vertical Farming Market Revenue Million Forecast, by Consumption Analysis 2020 & 2033
- Table 9: Global US Vertical Farming Market Revenue Million Forecast, by Import Market Analysis (Value & Volume) 2020 & 2033
- Table 10: Global US Vertical Farming Market Revenue Million Forecast, by Export Market Analysis (Value & Volume) 2020 & 2033
- Table 11: Global US Vertical Farming Market Revenue Million Forecast, by Price Trend Analysis 2020 & 2033
- Table 12: Global US Vertical Farming Market Revenue Million Forecast, by Country 2020 & 2033
- Table 13: United States US Vertical Farming Market Revenue (Million) Forecast, by Application 2020 & 2033
- Table 14: Canada US Vertical Farming Market Revenue (Million) Forecast, by Application 2020 & 2033
- Table 15: Mexico US Vertical Farming Market Revenue (Million) Forecast, by Application 2020 & 2033
- Table 16: Global US Vertical Farming Market Revenue Million Forecast, by Production Analysis 2020 & 2033
- Table 17: Global US Vertical Farming Market Revenue Million Forecast, by Consumption Analysis 2020 & 2033
- Table 18: Global US Vertical Farming Market Revenue Million Forecast, by Import Market Analysis (Value & Volume) 2020 & 2033
- Table 19: Global US Vertical Farming Market Revenue Million Forecast, by Export Market Analysis (Value & Volume) 2020 & 2033
- Table 20: Global US Vertical Farming Market Revenue Million Forecast, by Price Trend Analysis 2020 & 2033
- Table 21: Global US Vertical Farming Market Revenue Million Forecast, by Country 2020 & 2033
- Table 22: Brazil US Vertical Farming Market Revenue (Million) Forecast, by Application 2020 & 2033
- Table 23: Argentina US Vertical Farming Market Revenue (Million) Forecast, by Application 2020 & 2033
- Table 24: Rest of South America US Vertical Farming Market Revenue (Million) Forecast, by Application 2020 & 2033
- Table 25: Global US Vertical Farming Market Revenue Million Forecast, by Production Analysis 2020 & 2033
- Table 26: Global US Vertical Farming Market Revenue Million Forecast, by Consumption Analysis 2020 & 2033
- Table 27: Global US Vertical Farming Market Revenue Million Forecast, by Import Market Analysis (Value & Volume) 2020 & 2033
- Table 28: Global US Vertical Farming Market Revenue Million Forecast, by Export Market Analysis (Value & Volume) 2020 & 2033
- Table 29: Global US Vertical Farming Market Revenue Million Forecast, by Price Trend Analysis 2020 & 2033
- Table 30: Global US Vertical Farming Market Revenue Million Forecast, by Country 2020 & 2033
- Table 31: United Kingdom US Vertical Farming Market Revenue (Million) Forecast, by Application 2020 & 2033
- Table 32: Germany US Vertical Farming Market Revenue (Million) Forecast, by Application 2020 & 2033
- Table 33: France US Vertical Farming Market Revenue (Million) Forecast, by Application 2020 & 2033
- Table 34: Italy US Vertical Farming Market Revenue (Million) Forecast, by Application 2020 & 2033
- Table 35: Spain US Vertical Farming Market Revenue (Million) Forecast, by Application 2020 & 2033
- Table 36: Russia US Vertical Farming Market Revenue (Million) Forecast, by Application 2020 & 2033
- Table 37: Benelux US Vertical Farming Market Revenue (Million) Forecast, by Application 2020 & 2033
- Table 38: Nordics US Vertical Farming Market Revenue (Million) Forecast, by Application 2020 & 2033
- Table 39: Rest of Europe US Vertical Farming Market Revenue (Million) Forecast, by Application 2020 & 2033
- Table 40: Global US Vertical Farming Market Revenue Million Forecast, by Production Analysis 2020 & 2033
- Table 41: Global US Vertical Farming Market Revenue Million Forecast, by Consumption Analysis 2020 & 2033
- Table 42: Global US Vertical Farming Market Revenue Million Forecast, by Import Market Analysis (Value & Volume) 2020 & 2033
- Table 43: Global US Vertical Farming Market Revenue Million Forecast, by Export Market Analysis (Value & Volume) 2020 & 2033
- Table 44: Global US Vertical Farming Market Revenue Million Forecast, by Price Trend Analysis 2020 & 2033
- Table 45: Global US Vertical Farming Market Revenue Million Forecast, by Country 2020 & 2033
- Table 46: Turkey US Vertical Farming Market Revenue (Million) Forecast, by Application 2020 & 2033
- Table 47: Israel US Vertical Farming Market Revenue (Million) Forecast, by Application 2020 & 2033
- Table 48: GCC US Vertical Farming Market Revenue (Million) Forecast, by Application 2020 & 2033
- Table 49: North Africa US Vertical Farming Market Revenue (Million) Forecast, by Application 2020 & 2033
- Table 50: South Africa US Vertical Farming Market Revenue (Million) Forecast, by Application 2020 & 2033
- Table 51: Rest of Middle East & Africa US Vertical Farming Market Revenue (Million) Forecast, by Application 2020 & 2033
- Table 52: Global US Vertical Farming Market Revenue Million Forecast, by Production Analysis 2020 & 2033
- Table 53: Global US Vertical Farming Market Revenue Million Forecast, by Consumption Analysis 2020 & 2033
- Table 54: Global US Vertical Farming Market Revenue Million Forecast, by Import Market Analysis (Value & Volume) 2020 & 2033
- Table 55: Global US Vertical Farming Market Revenue Million Forecast, by Export Market Analysis (Value & Volume) 2020 & 2033
- Table 56: Global US Vertical Farming Market Revenue Million Forecast, by Price Trend Analysis 2020 & 2033
- Table 57: Global US Vertical Farming Market Revenue Million Forecast, by Country 2020 & 2033
- Table 58: China US Vertical Farming Market Revenue (Million) Forecast, by Application 2020 & 2033
- Table 59: India US Vertical Farming Market Revenue (Million) Forecast, by Application 2020 & 2033
- Table 60: Japan US Vertical Farming Market Revenue (Million) Forecast, by Application 2020 & 2033
- Table 61: South Korea US Vertical Farming Market Revenue (Million) Forecast, by Application 2020 & 2033
- Table 62: ASEAN US Vertical Farming Market Revenue (Million) Forecast, by Application 2020 & 2033
- Table 63: Oceania US Vertical Farming Market Revenue (Million) Forecast, by Application 2020 & 2033
- Table 64: Rest of Asia Pacific US Vertical Farming Market Revenue (Million) Forecast, by Application 2020 & 2033
Frequently Asked Questions
1. What is the projected Compound Annual Growth Rate (CAGR) of the US Vertical Farming Market?
The projected CAGR is approximately 10.80%.
2. Which companies are prominent players in the US Vertical Farming Market?
Key companies in the market include Bowery Farming Inc, Freight Farms, Plenty Unlimited Inc, Green Sense Farm Holdings Inc, Aero Farms, Altius Farm, Green Spirit Farms.
3. What are the main segments of the US Vertical Farming Market?
The market segments include Production Analysis, Consumption Analysis, Import Market Analysis (Value & Volume), Export Market Analysis (Value & Volume), Price Trend Analysis.
4. Can you provide details about the market size?
The market size is estimated to be USD 3.56 Million as of 2022.
5. What are some drivers contributing to market growth?
Seed Treatment As A Solution To Enhance Yield; Growing Awareness For Seed Treatment Among The Farmers; Rising Trend Of Organic Farming.
6. What are the notable trends driving market growth?
The Hydroponics Segment Dominates the Market.
7. Are there any restraints impacting market growth?
Limitations Across Farm-Level Seed Treatment; Rising Environmental Concerns.
8. Can you provide examples of recent developments in the market?
August 2023: Plenty Unlimited Inc., a San Francisco-based company, began construction on a vertical indoor farming campus that, when completed, is likely to be the largest such operation in the world. The campus, to be developed in phases totaling USD 300 million, will sit on 120 acres in the Meadowville Technology Park.
9. What pricing options are available for accessing the report?
Pricing options include single-user, multi-user, and enterprise licenses priced at USD 3800, USD 4500, and USD 5800 respectively.
10. Is the market size provided in terms of value or volume?
The market size is provided in terms of value, measured in Million.
11. Are there any specific market keywords associated with the report?
Yes, the market keyword associated with the report is "US Vertical Farming Market," which aids in identifying and referencing the specific market segment covered.
12. How do I determine which pricing option suits my needs best?
The pricing options vary based on user requirements and access needs. Individual users may opt for single-user licenses, while businesses requiring broader access may choose multi-user or enterprise licenses for cost-effective access to the report.
13. Are there any additional resources or data provided in the US Vertical Farming Market report?
While the report offers comprehensive insights, it's advisable to review the specific contents or supplementary materials provided to ascertain if additional resources or data are available.
14. How can I stay updated on further developments or reports in the US Vertical Farming Market?
To stay informed about further developments, trends, and reports in the US Vertical Farming Market, consider subscribing to industry newsletters, following relevant companies and organizations, or regularly checking reputable industry news sources and publications.
Methodology
Step 1 - Identification of Relevant Samples Size from Population Database


Step 2 - Approaches for Defining Global Market Size (Value, Volume* & Price*)

Note*: In applicable scenarios
Step 3 - Data Sources
Primary Research
- Web Analytics
- Survey Reports
- Research Institute
- Latest Research Reports
- Opinion Leaders
Secondary Research
- Annual Reports
- White Paper
- Latest Press Release
- Industry Association
- Paid Database
- Investor Presentations

Step 4 - Data Triangulation
Involves using different sources of information in order to increase the validity of a study
These sources are likely to be stakeholders in a program - participants, other researchers, program staff, other community members, and so on.
Then we put all data in single framework & apply various statistical tools to find out the dynamic on the market.
During the analysis stage, feedback from the stakeholder groups would be compared to determine areas of agreement as well as areas of divergence