

Key Insights
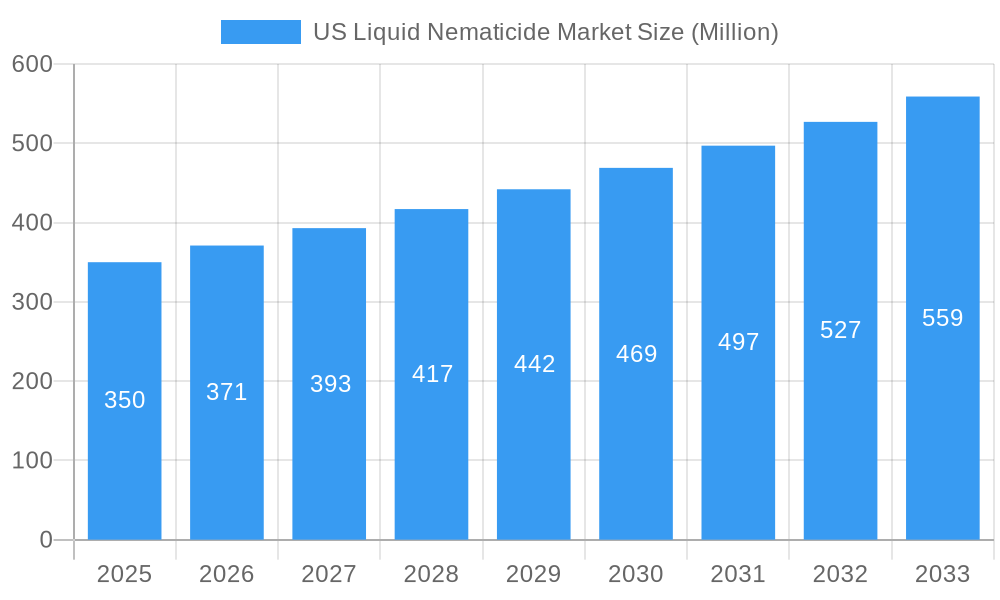
The US liquid nematicide market, projected to reach $356.6 million by 2025, is poised for significant expansion. This growth is propelled by escalating demand for high-yield crops and the increasing incidence of nematode infestations across major agricultural areas. The market's estimated Compound Annual Growth Rate (CAGR) of 5.6% indicates sustained development. Key drivers include the expansion of commercial crop, fruit, and vegetable cultivation, necessitating robust nematode control. Liquid formulations are favored for their application efficiency and precise dosage, surpassing granular alternatives. Furthermore, the adoption of bio-based nematicides underscores a growing commitment to environmental sustainability in agriculture. Challenges include stringent regulatory approval processes and the potential for nematode resistance development.
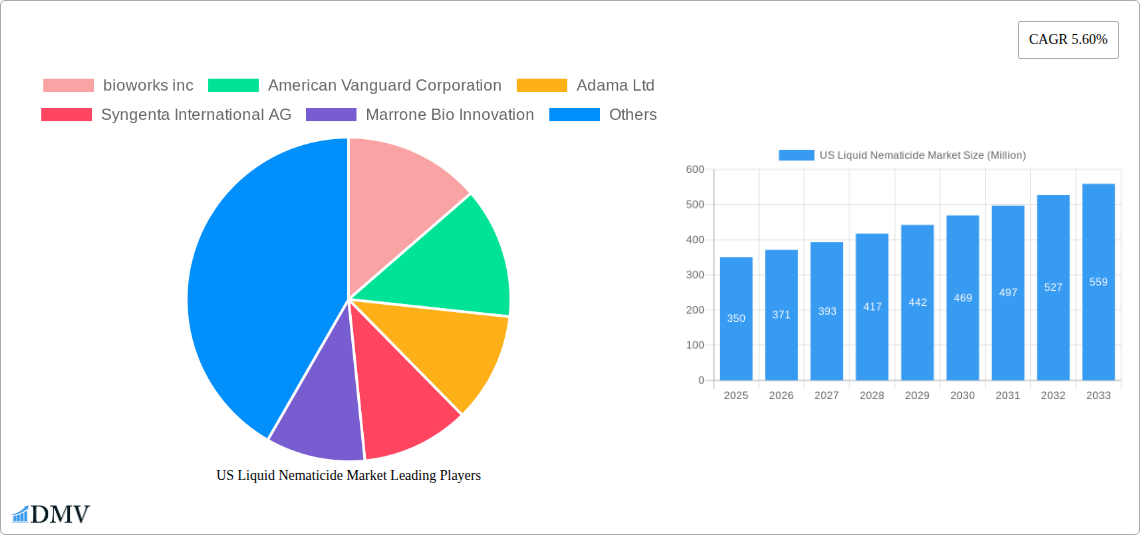
US Liquid Nematicide Market Market Size (In Million)
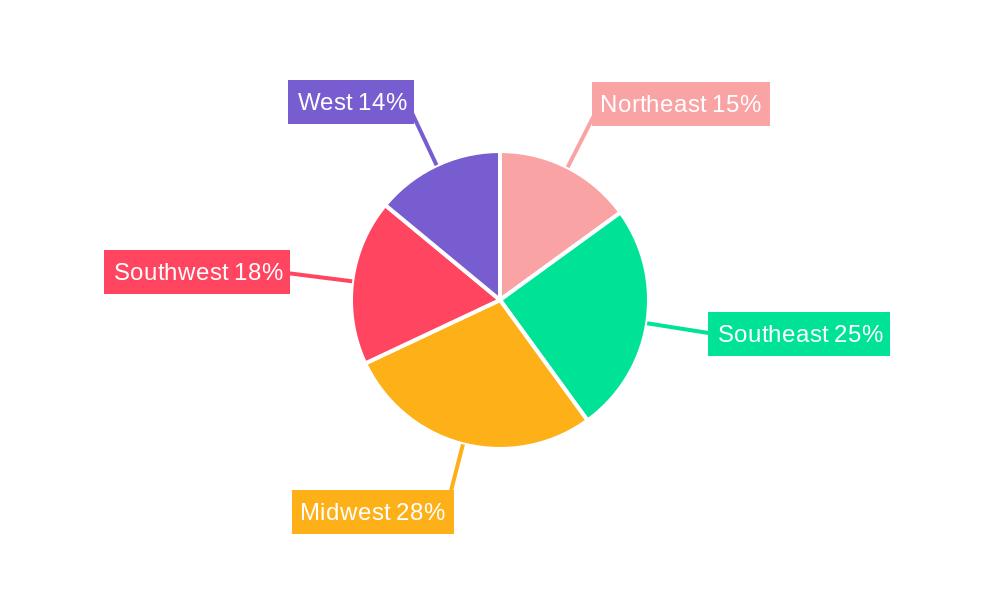
Regional market dynamics are expected to vary, with the Southeast and Midwest anticipated to lead growth due to substantial agricultural output and a higher prevalence of nematode-susceptible crops. Market segmentation by chemical type (e.g., organophosphates, carbamates, bio-based) and application (e.g., grains & cereals, pulses & oilseeds) highlights the diverse agricultural landscape. Leading companies like Syngenta, Bayer, and BASF are actively engaged in market expansion through innovation and strategic initiatives, focusing on effective and sustainable solutions. Future market performance will be influenced by technological advancements, regulatory shifts, and evolving farmer preferences for yield optimization and environmental stewardship.
US Liquid Nematicide Market Company Market Share
US Liquid Nematicide Market: A Comprehensive Market Report (2019-2033)
This insightful report provides a comprehensive analysis of the US Liquid Nematicide Market, offering a detailed overview of market size, trends, leading players, and future growth prospects. The study period spans from 2019 to 2033, with 2025 serving as the base and estimated year. The report meticulously examines the market's dynamics, focusing on key segments like chemical type, formulation, and application, to provide stakeholders with actionable insights for strategic decision-making. The market is valued at $XX Million in 2025 and is projected to reach $XX Million by 2033, exhibiting a CAGR of XX% during the forecast period (2025-2033).
US Liquid Nematicide Market Composition & Trends
The US liquid nematicide market is a dynamic landscape shaped by several key factors. Market concentration is moderate, with a few major players holding significant shares, while several smaller companies compete in niche segments. Innovation is driven by the need for more effective and environmentally friendly nematicides, leading to the development of bio-based alternatives and advanced formulations. The regulatory landscape plays a significant role, with stringent regulations regarding pesticide use influencing product development and market access. Substitute products, such as crop rotation and biological control methods, also pose competitive pressure. End-users, primarily agricultural producers across various crop types, exhibit varying needs and preferences influencing demand patterns. Finally, M&A activities are relatively frequent, with companies seeking to expand their product portfolios and market reach. Deal values in recent years have averaged $XX Million per transaction.
Market Share Distribution (2025):
- Syngenta International AG: XX%
- Bayer CropScience AG: XX%
- BASF SE: XX%
- Others: XX%
- Syngenta International AG: XX%
Recent M&A Activities (2022-2024):
- Acquisition of Company X by Company Y for $XX Million (Year)
- Partnership between Company A and Company B (Year)
- Acquisition of Company X by Company Y for $XX Million (Year)
US Liquid Nematicide Market Industry Evolution
The US liquid nematicide market has witnessed significant evolution over the past decade. From 2019 to 2024, the market experienced a compound annual growth rate (CAGR) of XX%, driven by factors such as increasing crop production, rising awareness of nematode damage, and the introduction of novel nematicides. Technological advancements, particularly in bio-based nematicide formulations and targeted application technologies, have played a crucial role in shaping market dynamics. Consumer demand is increasingly shifting towards environmentally sustainable and safer products, putting pressure on manufacturers to develop and adopt greener solutions. This change is reflected in the growing market share of bio-based nematicides, which is expected to reach XX% by 2033, up from XX% in 2025. The adoption of precision application techniques like drip irrigation is also gaining traction, improving efficiency and reducing environmental impact. Further, the growing adoption of integrated pest management (IPM) strategies is contributing to the market growth.
Leading Regions, Countries, or Segments in US Liquid Nematicide Market
The Midwest region dominates the US liquid nematicide market due to its extensive agricultural land and diverse crop production. Within chemical types, Organophosphates hold the largest market share owing to their proven efficacy. However, the bio-based nematicide segment is projected to experience the fastest growth due to increasing consumer preference for eco-friendly alternatives and stringent regulations concerning harmful chemicals. In terms of formulations, liquid formulations dominate owing to their ease of application.
Key Drivers for Midwest Dominance:
- High concentration of agricultural land dedicated to various crops susceptible to nematode infestations.
- Favorable climatic conditions conducive to high crop yields and hence necessitating nematode control.
- Extensive infrastructure supporting agricultural practices and efficient distribution networks.
- Significant government investment in agricultural research and development within this region.
Key Drivers for Organophosphate Dominance:
- Proven efficacy and long history of use, establishing trust amongst farmers.
- Relatively lower initial cost compared to newer bio-based options.
- Wide availability and established distribution channels.
Key Drivers for Liquid Formulation Dominance:
- Easy to handle and apply, particularly with precision application technologies.
- Excellent compatibility with various irrigation and application systems.
- Offers convenient and cost-effective solutions for large-scale agricultural operations.
US Liquid Nematicide Market Product Innovations
Recent innovations include the development of more effective and environmentally benign nematicides with improved biodegradability and reduced environmental impact. Advances in formulation technology, such as nano-encapsulation and controlled-release formulations, enhance the efficacy and longevity of the nematicides, minimizing environmental impact. Furthermore, the integration of digital technologies, including precision application systems and remote monitoring tools, is improving application efficiency.
Propelling Factors for US Liquid Nematicide Market Growth
Several factors fuel the growth of the US liquid nematicide market. Firstly, the rising global demand for food and feed crops is driving intensive agriculture, increasing nematode infestation occurrences. Secondly, technological advancements in nematicide formulations are leading to more effective and environmentally friendly solutions. Thirdly, government regulations promoting sustainable agriculture practices and stricter guidelines on pesticide usage are driving demand for safer and more efficient nematicides. Finally, increasing farmer awareness of the economic losses caused by nematodes is encouraging proactive adoption of control measures.
Obstacles in the US Liquid Nematicide Market Market
The market faces challenges such as stringent regulatory approvals impacting time-to-market for new products, increasing raw material costs affecting manufacturing costs, and concerns regarding potential environmental impact influencing consumer preference. Supply chain disruptions also influence the availability and cost of nematicides, and intense competition among established players limits profit margins.
Future Opportunities in US Liquid Nematicide Market
Future opportunities lie in the expansion of bio-based and low-impact nematicide adoption, exploring novel application technologies like drones and precision spraying, and penetrating new markets through innovative product development. Furthermore, the integration of digital technologies to monitor nematode populations and optimize treatment strategies will present significant growth potential.
Major Players in the US Liquid Nematicide Market Ecosystem
Key Developments in US Liquid Nematicide Market Industry
- January 2023: Syngenta launched a new bio-based nematicide.
- March 2022: Bayer CropScience acquired a smaller nematicide producer.
- June 2024: New regulations on nematicide use were implemented in California.
- October 2021: BASF announced a new partnership for nematicide research.
Strategic US Liquid Nematicide Market Forecast
The US liquid nematicide market is poised for robust growth driven by increased demand, technological advancements, and a shift toward sustainable agriculture. The growing adoption of bio-based alternatives and precision application techniques will play a key role in shaping market dynamics. The market is projected to witness substantial expansion, propelled by factors mentioned above, offering significant opportunities for both established and emerging players in the industry.
US Liquid Nematicide Market Segmentation
- 1. Production Analysis
- 2. Consumption Analysis
- 3. Import Market Analysis (Value & Volume)
- 4. Export Market Analysis (Value & Volume)
- 5. Price Trend Analysis
US Liquid Nematicide Market Segmentation By Geography
-
1. North America
- 1.1. United States
- 1.2. Canada
- 1.3. Mexico
-
2. South America
- 2.1. Brazil
- 2.2. Argentina
- 2.3. Rest of South America
-
3. Europe
- 3.1. United Kingdom
- 3.2. Germany
- 3.3. France
- 3.4. Italy
- 3.5. Spain
- 3.6. Russia
- 3.7. Benelux
- 3.8. Nordics
- 3.9. Rest of Europe
-
4. Middle East & Africa
- 4.1. Turkey
- 4.2. Israel
- 4.3. GCC
- 4.4. North Africa
- 4.5. South Africa
- 4.6. Rest of Middle East & Africa
-
5. Asia Pacific
- 5.1. China
- 5.2. India
- 5.3. Japan
- 5.4. South Korea
- 5.5. ASEAN
- 5.6. Oceania
- 5.7. Rest of Asia Pacific
US Liquid Nematicide Market Regional Market Share
Geographic Coverage of US Liquid Nematicide Market
US Liquid Nematicide Market REPORT HIGHLIGHTS
| Aspects | Details |
|---|---|
| Study Period | 2020-2034 |
| Base Year | 2025 |
| Estimated Year | 2026 |
| Forecast Period | 2026-2034 |
| Historical Period | 2020-2025 |
| Growth Rate | CAGR of 5.6% from 2020-2034 |
| Segmentation |
|
Table of Contents
- 1. Introduction
- 1.1. Research Scope
- 1.2. Market Segmentation
- 1.3. Research Methodology
- 1.4. Definitions and Assumptions
- 2. Executive Summary
- 2.1. Introduction
- 3. Market Dynamics
- 3.1. Introduction
- 3.2. Market Drivers
- 3.2.1. Seed Treatment As A Solution To Enhance Yield; Growing Awareness For Seed Treatment Among The Farmers; Rising Trend Of Organic Farming
- 3.3. Market Restrains
- 3.3.1. Limitations Across Farm-Level Seed Treatment; Rising Environmental Concerns
- 3.4. Market Trends
- 3.4.1. Increase Nematode Management in Vegetable crops
- 4. Market Factor Analysis
- 4.1. Porters Five Forces
- 4.2. Supply/Value Chain
- 4.3. PESTEL analysis
- 4.4. Market Entropy
- 4.5. Patent/Trademark Analysis
- 5. Global US Liquid Nematicide Market Analysis, Insights and Forecast, 2020-2032
- 5.1. Market Analysis, Insights and Forecast - by Production Analysis
- 5.2. Market Analysis, Insights and Forecast - by Consumption Analysis
- 5.3. Market Analysis, Insights and Forecast - by Import Market Analysis (Value & Volume)
- 5.4. Market Analysis, Insights and Forecast - by Export Market Analysis (Value & Volume)
- 5.5. Market Analysis, Insights and Forecast - by Price Trend Analysis
- 5.6. Market Analysis, Insights and Forecast - by Region
- 5.6.1. North America
- 5.6.2. South America
- 5.6.3. Europe
- 5.6.4. Middle East & Africa
- 5.6.5. Asia Pacific
- 5.1. Market Analysis, Insights and Forecast - by Production Analysis
- 6. North America US Liquid Nematicide Market Analysis, Insights and Forecast, 2020-2032
- 6.1. Market Analysis, Insights and Forecast - by Production Analysis
- 6.2. Market Analysis, Insights and Forecast - by Consumption Analysis
- 6.3. Market Analysis, Insights and Forecast - by Import Market Analysis (Value & Volume)
- 6.4. Market Analysis, Insights and Forecast - by Export Market Analysis (Value & Volume)
- 6.5. Market Analysis, Insights and Forecast - by Price Trend Analysis
- 6.1. Market Analysis, Insights and Forecast - by Production Analysis
- 7. South America US Liquid Nematicide Market Analysis, Insights and Forecast, 2020-2032
- 7.1. Market Analysis, Insights and Forecast - by Production Analysis
- 7.2. Market Analysis, Insights and Forecast - by Consumption Analysis
- 7.3. Market Analysis, Insights and Forecast - by Import Market Analysis (Value & Volume)
- 7.4. Market Analysis, Insights and Forecast - by Export Market Analysis (Value & Volume)
- 7.5. Market Analysis, Insights and Forecast - by Price Trend Analysis
- 7.1. Market Analysis, Insights and Forecast - by Production Analysis
- 8. Europe US Liquid Nematicide Market Analysis, Insights and Forecast, 2020-2032
- 8.1. Market Analysis, Insights and Forecast - by Production Analysis
- 8.2. Market Analysis, Insights and Forecast - by Consumption Analysis
- 8.3. Market Analysis, Insights and Forecast - by Import Market Analysis (Value & Volume)
- 8.4. Market Analysis, Insights and Forecast - by Export Market Analysis (Value & Volume)
- 8.5. Market Analysis, Insights and Forecast - by Price Trend Analysis
- 8.1. Market Analysis, Insights and Forecast - by Production Analysis
- 9. Middle East & Africa US Liquid Nematicide Market Analysis, Insights and Forecast, 2020-2032
- 9.1. Market Analysis, Insights and Forecast - by Production Analysis
- 9.2. Market Analysis, Insights and Forecast - by Consumption Analysis
- 9.3. Market Analysis, Insights and Forecast - by Import Market Analysis (Value & Volume)
- 9.4. Market Analysis, Insights and Forecast - by Export Market Analysis (Value & Volume)
- 9.5. Market Analysis, Insights and Forecast - by Price Trend Analysis
- 9.1. Market Analysis, Insights and Forecast - by Production Analysis
- 10. Asia Pacific US Liquid Nematicide Market Analysis, Insights and Forecast, 2020-2032
- 10.1. Market Analysis, Insights and Forecast - by Production Analysis
- 10.2. Market Analysis, Insights and Forecast - by Consumption Analysis
- 10.3. Market Analysis, Insights and Forecast - by Import Market Analysis (Value & Volume)
- 10.4. Market Analysis, Insights and Forecast - by Export Market Analysis (Value & Volume)
- 10.5. Market Analysis, Insights and Forecast - by Price Trend Analysis
- 10.1. Market Analysis, Insights and Forecast - by Production Analysis
- 11. Competitive Analysis
- 11.1. Global Market Share Analysis 2025
- 11.2. Company Profiles
- 11.2.1 bioworks inc
- 11.2.1.1. Overview
- 11.2.1.2. Products
- 11.2.1.3. SWOT Analysis
- 11.2.1.4. Recent Developments
- 11.2.1.5. Financials (Based on Availability)
- 11.2.2 American Vanguard Corporation
- 11.2.2.1. Overview
- 11.2.2.2. Products
- 11.2.2.3. SWOT Analysis
- 11.2.2.4. Recent Developments
- 11.2.2.5. Financials (Based on Availability)
- 11.2.3 Adama Ltd
- 11.2.3.1. Overview
- 11.2.3.2. Products
- 11.2.3.3. SWOT Analysis
- 11.2.3.4. Recent Developments
- 11.2.3.5. Financials (Based on Availability)
- 11.2.4 Syngenta International AG
- 11.2.4.1. Overview
- 11.2.4.2. Products
- 11.2.4.3. SWOT Analysis
- 11.2.4.4. Recent Developments
- 11.2.4.5. Financials (Based on Availability)
- 11.2.5 Marrone Bio Innovation
- 11.2.5.1. Overview
- 11.2.5.2. Products
- 11.2.5.3. SWOT Analysis
- 11.2.5.4. Recent Developments
- 11.2.5.5. Financials (Based on Availability)
- 11.2.6 Corteva Agriscience
- 11.2.6.1. Overview
- 11.2.6.2. Products
- 11.2.6.3. SWOT Analysis
- 11.2.6.4. Recent Developments
- 11.2.6.5. Financials (Based on Availability)
- 11.2.7 Bayer CropScience AG
- 11.2.7.1. Overview
- 11.2.7.2. Products
- 11.2.7.3. SWOT Analysis
- 11.2.7.4. Recent Developments
- 11.2.7.5. Financials (Based on Availability)
- 11.2.8 Nufarm Ltd
- 11.2.8.1. Overview
- 11.2.8.2. Products
- 11.2.8.3. SWOT Analysis
- 11.2.8.4. Recent Developments
- 11.2.8.5. Financials (Based on Availability)
- 11.2.9 BASF SE
- 11.2.9.1. Overview
- 11.2.9.2. Products
- 11.2.9.3. SWOT Analysis
- 11.2.9.4. Recent Developments
- 11.2.9.5. Financials (Based on Availability)
- 11.2.1 bioworks inc
List of Figures
- Figure 1: Global US Liquid Nematicide Market Revenue Breakdown (million, %) by Region 2025 & 2033
- Figure 2: North America US Liquid Nematicide Market Revenue (million), by Production Analysis 2025 & 2033
- Figure 3: North America US Liquid Nematicide Market Revenue Share (%), by Production Analysis 2025 & 2033
- Figure 4: North America US Liquid Nematicide Market Revenue (million), by Consumption Analysis 2025 & 2033
- Figure 5: North America US Liquid Nematicide Market Revenue Share (%), by Consumption Analysis 2025 & 2033
- Figure 6: North America US Liquid Nematicide Market Revenue (million), by Import Market Analysis (Value & Volume) 2025 & 2033
- Figure 7: North America US Liquid Nematicide Market Revenue Share (%), by Import Market Analysis (Value & Volume) 2025 & 2033
- Figure 8: North America US Liquid Nematicide Market Revenue (million), by Export Market Analysis (Value & Volume) 2025 & 2033
- Figure 9: North America US Liquid Nematicide Market Revenue Share (%), by Export Market Analysis (Value & Volume) 2025 & 2033
- Figure 10: North America US Liquid Nematicide Market Revenue (million), by Price Trend Analysis 2025 & 2033
- Figure 11: North America US Liquid Nematicide Market Revenue Share (%), by Price Trend Analysis 2025 & 2033
- Figure 12: North America US Liquid Nematicide Market Revenue (million), by Country 2025 & 2033
- Figure 13: North America US Liquid Nematicide Market Revenue Share (%), by Country 2025 & 2033
- Figure 14: South America US Liquid Nematicide Market Revenue (million), by Production Analysis 2025 & 2033
- Figure 15: South America US Liquid Nematicide Market Revenue Share (%), by Production Analysis 2025 & 2033
- Figure 16: South America US Liquid Nematicide Market Revenue (million), by Consumption Analysis 2025 & 2033
- Figure 17: South America US Liquid Nematicide Market Revenue Share (%), by Consumption Analysis 2025 & 2033
- Figure 18: South America US Liquid Nematicide Market Revenue (million), by Import Market Analysis (Value & Volume) 2025 & 2033
- Figure 19: South America US Liquid Nematicide Market Revenue Share (%), by Import Market Analysis (Value & Volume) 2025 & 2033
- Figure 20: South America US Liquid Nematicide Market Revenue (million), by Export Market Analysis (Value & Volume) 2025 & 2033
- Figure 21: South America US Liquid Nematicide Market Revenue Share (%), by Export Market Analysis (Value & Volume) 2025 & 2033
- Figure 22: South America US Liquid Nematicide Market Revenue (million), by Price Trend Analysis 2025 & 2033
- Figure 23: South America US Liquid Nematicide Market Revenue Share (%), by Price Trend Analysis 2025 & 2033
- Figure 24: South America US Liquid Nematicide Market Revenue (million), by Country 2025 & 2033
- Figure 25: South America US Liquid Nematicide Market Revenue Share (%), by Country 2025 & 2033
- Figure 26: Europe US Liquid Nematicide Market Revenue (million), by Production Analysis 2025 & 2033
- Figure 27: Europe US Liquid Nematicide Market Revenue Share (%), by Production Analysis 2025 & 2033
- Figure 28: Europe US Liquid Nematicide Market Revenue (million), by Consumption Analysis 2025 & 2033
- Figure 29: Europe US Liquid Nematicide Market Revenue Share (%), by Consumption Analysis 2025 & 2033
- Figure 30: Europe US Liquid Nematicide Market Revenue (million), by Import Market Analysis (Value & Volume) 2025 & 2033
- Figure 31: Europe US Liquid Nematicide Market Revenue Share (%), by Import Market Analysis (Value & Volume) 2025 & 2033
- Figure 32: Europe US Liquid Nematicide Market Revenue (million), by Export Market Analysis (Value & Volume) 2025 & 2033
- Figure 33: Europe US Liquid Nematicide Market Revenue Share (%), by Export Market Analysis (Value & Volume) 2025 & 2033
- Figure 34: Europe US Liquid Nematicide Market Revenue (million), by Price Trend Analysis 2025 & 2033
- Figure 35: Europe US Liquid Nematicide Market Revenue Share (%), by Price Trend Analysis 2025 & 2033
- Figure 36: Europe US Liquid Nematicide Market Revenue (million), by Country 2025 & 2033
- Figure 37: Europe US Liquid Nematicide Market Revenue Share (%), by Country 2025 & 2033
- Figure 38: Middle East & Africa US Liquid Nematicide Market Revenue (million), by Production Analysis 2025 & 2033
- Figure 39: Middle East & Africa US Liquid Nematicide Market Revenue Share (%), by Production Analysis 2025 & 2033
- Figure 40: Middle East & Africa US Liquid Nematicide Market Revenue (million), by Consumption Analysis 2025 & 2033
- Figure 41: Middle East & Africa US Liquid Nematicide Market Revenue Share (%), by Consumption Analysis 2025 & 2033
- Figure 42: Middle East & Africa US Liquid Nematicide Market Revenue (million), by Import Market Analysis (Value & Volume) 2025 & 2033
- Figure 43: Middle East & Africa US Liquid Nematicide Market Revenue Share (%), by Import Market Analysis (Value & Volume) 2025 & 2033
- Figure 44: Middle East & Africa US Liquid Nematicide Market Revenue (million), by Export Market Analysis (Value & Volume) 2025 & 2033
- Figure 45: Middle East & Africa US Liquid Nematicide Market Revenue Share (%), by Export Market Analysis (Value & Volume) 2025 & 2033
- Figure 46: Middle East & Africa US Liquid Nematicide Market Revenue (million), by Price Trend Analysis 2025 & 2033
- Figure 47: Middle East & Africa US Liquid Nematicide Market Revenue Share (%), by Price Trend Analysis 2025 & 2033
- Figure 48: Middle East & Africa US Liquid Nematicide Market Revenue (million), by Country 2025 & 2033
- Figure 49: Middle East & Africa US Liquid Nematicide Market Revenue Share (%), by Country 2025 & 2033
- Figure 50: Asia Pacific US Liquid Nematicide Market Revenue (million), by Production Analysis 2025 & 2033
- Figure 51: Asia Pacific US Liquid Nematicide Market Revenue Share (%), by Production Analysis 2025 & 2033
- Figure 52: Asia Pacific US Liquid Nematicide Market Revenue (million), by Consumption Analysis 2025 & 2033
- Figure 53: Asia Pacific US Liquid Nematicide Market Revenue Share (%), by Consumption Analysis 2025 & 2033
- Figure 54: Asia Pacific US Liquid Nematicide Market Revenue (million), by Import Market Analysis (Value & Volume) 2025 & 2033
- Figure 55: Asia Pacific US Liquid Nematicide Market Revenue Share (%), by Import Market Analysis (Value & Volume) 2025 & 2033
- Figure 56: Asia Pacific US Liquid Nematicide Market Revenue (million), by Export Market Analysis (Value & Volume) 2025 & 2033
- Figure 57: Asia Pacific US Liquid Nematicide Market Revenue Share (%), by Export Market Analysis (Value & Volume) 2025 & 2033
- Figure 58: Asia Pacific US Liquid Nematicide Market Revenue (million), by Price Trend Analysis 2025 & 2033
- Figure 59: Asia Pacific US Liquid Nematicide Market Revenue Share (%), by Price Trend Analysis 2025 & 2033
- Figure 60: Asia Pacific US Liquid Nematicide Market Revenue (million), by Country 2025 & 2033
- Figure 61: Asia Pacific US Liquid Nematicide Market Revenue Share (%), by Country 2025 & 2033
List of Tables
- Table 1: Global US Liquid Nematicide Market Revenue million Forecast, by Production Analysis 2020 & 2033
- Table 2: Global US Liquid Nematicide Market Revenue million Forecast, by Consumption Analysis 2020 & 2033
- Table 3: Global US Liquid Nematicide Market Revenue million Forecast, by Import Market Analysis (Value & Volume) 2020 & 2033
- Table 4: Global US Liquid Nematicide Market Revenue million Forecast, by Export Market Analysis (Value & Volume) 2020 & 2033
- Table 5: Global US Liquid Nematicide Market Revenue million Forecast, by Price Trend Analysis 2020 & 2033
- Table 6: Global US Liquid Nematicide Market Revenue million Forecast, by Region 2020 & 2033
- Table 7: Global US Liquid Nematicide Market Revenue million Forecast, by Production Analysis 2020 & 2033
- Table 8: Global US Liquid Nematicide Market Revenue million Forecast, by Consumption Analysis 2020 & 2033
- Table 9: Global US Liquid Nematicide Market Revenue million Forecast, by Import Market Analysis (Value & Volume) 2020 & 2033
- Table 10: Global US Liquid Nematicide Market Revenue million Forecast, by Export Market Analysis (Value & Volume) 2020 & 2033
- Table 11: Global US Liquid Nematicide Market Revenue million Forecast, by Price Trend Analysis 2020 & 2033
- Table 12: Global US Liquid Nematicide Market Revenue million Forecast, by Country 2020 & 2033
- Table 13: United States US Liquid Nematicide Market Revenue (million) Forecast, by Application 2020 & 2033
- Table 14: Canada US Liquid Nematicide Market Revenue (million) Forecast, by Application 2020 & 2033
- Table 15: Mexico US Liquid Nematicide Market Revenue (million) Forecast, by Application 2020 & 2033
- Table 16: Global US Liquid Nematicide Market Revenue million Forecast, by Production Analysis 2020 & 2033
- Table 17: Global US Liquid Nematicide Market Revenue million Forecast, by Consumption Analysis 2020 & 2033
- Table 18: Global US Liquid Nematicide Market Revenue million Forecast, by Import Market Analysis (Value & Volume) 2020 & 2033
- Table 19: Global US Liquid Nematicide Market Revenue million Forecast, by Export Market Analysis (Value & Volume) 2020 & 2033
- Table 20: Global US Liquid Nematicide Market Revenue million Forecast, by Price Trend Analysis 2020 & 2033
- Table 21: Global US Liquid Nematicide Market Revenue million Forecast, by Country 2020 & 2033
- Table 22: Brazil US Liquid Nematicide Market Revenue (million) Forecast, by Application 2020 & 2033
- Table 23: Argentina US Liquid Nematicide Market Revenue (million) Forecast, by Application 2020 & 2033
- Table 24: Rest of South America US Liquid Nematicide Market Revenue (million) Forecast, by Application 2020 & 2033
- Table 25: Global US Liquid Nematicide Market Revenue million Forecast, by Production Analysis 2020 & 2033
- Table 26: Global US Liquid Nematicide Market Revenue million Forecast, by Consumption Analysis 2020 & 2033
- Table 27: Global US Liquid Nematicide Market Revenue million Forecast, by Import Market Analysis (Value & Volume) 2020 & 2033
- Table 28: Global US Liquid Nematicide Market Revenue million Forecast, by Export Market Analysis (Value & Volume) 2020 & 2033
- Table 29: Global US Liquid Nematicide Market Revenue million Forecast, by Price Trend Analysis 2020 & 2033
- Table 30: Global US Liquid Nematicide Market Revenue million Forecast, by Country 2020 & 2033
- Table 31: United Kingdom US Liquid Nematicide Market Revenue (million) Forecast, by Application 2020 & 2033
- Table 32: Germany US Liquid Nematicide Market Revenue (million) Forecast, by Application 2020 & 2033
- Table 33: France US Liquid Nematicide Market Revenue (million) Forecast, by Application 2020 & 2033
- Table 34: Italy US Liquid Nematicide Market Revenue (million) Forecast, by Application 2020 & 2033
- Table 35: Spain US Liquid Nematicide Market Revenue (million) Forecast, by Application 2020 & 2033
- Table 36: Russia US Liquid Nematicide Market Revenue (million) Forecast, by Application 2020 & 2033
- Table 37: Benelux US Liquid Nematicide Market Revenue (million) Forecast, by Application 2020 & 2033
- Table 38: Nordics US Liquid Nematicide Market Revenue (million) Forecast, by Application 2020 & 2033
- Table 39: Rest of Europe US Liquid Nematicide Market Revenue (million) Forecast, by Application 2020 & 2033
- Table 40: Global US Liquid Nematicide Market Revenue million Forecast, by Production Analysis 2020 & 2033
- Table 41: Global US Liquid Nematicide Market Revenue million Forecast, by Consumption Analysis 2020 & 2033
- Table 42: Global US Liquid Nematicide Market Revenue million Forecast, by Import Market Analysis (Value & Volume) 2020 & 2033
- Table 43: Global US Liquid Nematicide Market Revenue million Forecast, by Export Market Analysis (Value & Volume) 2020 & 2033
- Table 44: Global US Liquid Nematicide Market Revenue million Forecast, by Price Trend Analysis 2020 & 2033
- Table 45: Global US Liquid Nematicide Market Revenue million Forecast, by Country 2020 & 2033
- Table 46: Turkey US Liquid Nematicide Market Revenue (million) Forecast, by Application 2020 & 2033
- Table 47: Israel US Liquid Nematicide Market Revenue (million) Forecast, by Application 2020 & 2033
- Table 48: GCC US Liquid Nematicide Market Revenue (million) Forecast, by Application 2020 & 2033
- Table 49: North Africa US Liquid Nematicide Market Revenue (million) Forecast, by Application 2020 & 2033
- Table 50: South Africa US Liquid Nematicide Market Revenue (million) Forecast, by Application 2020 & 2033
- Table 51: Rest of Middle East & Africa US Liquid Nematicide Market Revenue (million) Forecast, by Application 2020 & 2033
- Table 52: Global US Liquid Nematicide Market Revenue million Forecast, by Production Analysis 2020 & 2033
- Table 53: Global US Liquid Nematicide Market Revenue million Forecast, by Consumption Analysis 2020 & 2033
- Table 54: Global US Liquid Nematicide Market Revenue million Forecast, by Import Market Analysis (Value & Volume) 2020 & 2033
- Table 55: Global US Liquid Nematicide Market Revenue million Forecast, by Export Market Analysis (Value & Volume) 2020 & 2033
- Table 56: Global US Liquid Nematicide Market Revenue million Forecast, by Price Trend Analysis 2020 & 2033
- Table 57: Global US Liquid Nematicide Market Revenue million Forecast, by Country 2020 & 2033
- Table 58: China US Liquid Nematicide Market Revenue (million) Forecast, by Application 2020 & 2033
- Table 59: India US Liquid Nematicide Market Revenue (million) Forecast, by Application 2020 & 2033
- Table 60: Japan US Liquid Nematicide Market Revenue (million) Forecast, by Application 2020 & 2033
- Table 61: South Korea US Liquid Nematicide Market Revenue (million) Forecast, by Application 2020 & 2033
- Table 62: ASEAN US Liquid Nematicide Market Revenue (million) Forecast, by Application 2020 & 2033
- Table 63: Oceania US Liquid Nematicide Market Revenue (million) Forecast, by Application 2020 & 2033
- Table 64: Rest of Asia Pacific US Liquid Nematicide Market Revenue (million) Forecast, by Application 2020 & 2033
Frequently Asked Questions
1. What is the projected Compound Annual Growth Rate (CAGR) of the US Liquid Nematicide Market?
The projected CAGR is approximately 5.6%.
2. Which companies are prominent players in the US Liquid Nematicide Market?
Key companies in the market include bioworks inc, American Vanguard Corporation, Adama Ltd, Syngenta International AG, Marrone Bio Innovation, Corteva Agriscience, Bayer CropScience AG, Nufarm Ltd, BASF SE.
3. What are the main segments of the US Liquid Nematicide Market?
The market segments include Production Analysis, Consumption Analysis, Import Market Analysis (Value & Volume), Export Market Analysis (Value & Volume), Price Trend Analysis.
4. Can you provide details about the market size?
The market size is estimated to be USD 356.6 million as of 2022.
5. What are some drivers contributing to market growth?
Seed Treatment As A Solution To Enhance Yield; Growing Awareness For Seed Treatment Among The Farmers; Rising Trend Of Organic Farming.
6. What are the notable trends driving market growth?
Increase Nematode Management in Vegetable crops.
7. Are there any restraints impacting market growth?
Limitations Across Farm-Level Seed Treatment; Rising Environmental Concerns.
8. Can you provide examples of recent developments in the market?
N/A
9. What pricing options are available for accessing the report?
Pricing options include single-user, multi-user, and enterprise licenses priced at USD 3800, USD 4500, and USD 5800 respectively.
10. Is the market size provided in terms of value or volume?
The market size is provided in terms of value, measured in million.
11. Are there any specific market keywords associated with the report?
Yes, the market keyword associated with the report is "US Liquid Nematicide Market," which aids in identifying and referencing the specific market segment covered.
12. How do I determine which pricing option suits my needs best?
The pricing options vary based on user requirements and access needs. Individual users may opt for single-user licenses, while businesses requiring broader access may choose multi-user or enterprise licenses for cost-effective access to the report.
13. Are there any additional resources or data provided in the US Liquid Nematicide Market report?
While the report offers comprehensive insights, it's advisable to review the specific contents or supplementary materials provided to ascertain if additional resources or data are available.
14. How can I stay updated on further developments or reports in the US Liquid Nematicide Market?
To stay informed about further developments, trends, and reports in the US Liquid Nematicide Market, consider subscribing to industry newsletters, following relevant companies and organizations, or regularly checking reputable industry news sources and publications.
Methodology
Step 1 - Identification of Relevant Samples Size from Population Database


Step 2 - Approaches for Defining Global Market Size (Value, Volume* & Price*)

Note*: In applicable scenarios
Step 3 - Data Sources
Primary Research
- Web Analytics
- Survey Reports
- Research Institute
- Latest Research Reports
- Opinion Leaders
Secondary Research
- Annual Reports
- White Paper
- Latest Press Release
- Industry Association
- Paid Database
- Investor Presentations

Step 4 - Data Triangulation
Involves using different sources of information in order to increase the validity of a study
These sources are likely to be stakeholders in a program - participants, other researchers, program staff, other community members, and so on.
Then we put all data in single framework & apply various statistical tools to find out the dynamic on the market.
During the analysis stage, feedback from the stakeholder groups would be compared to determine areas of agreement as well as areas of divergence