

Key Insights
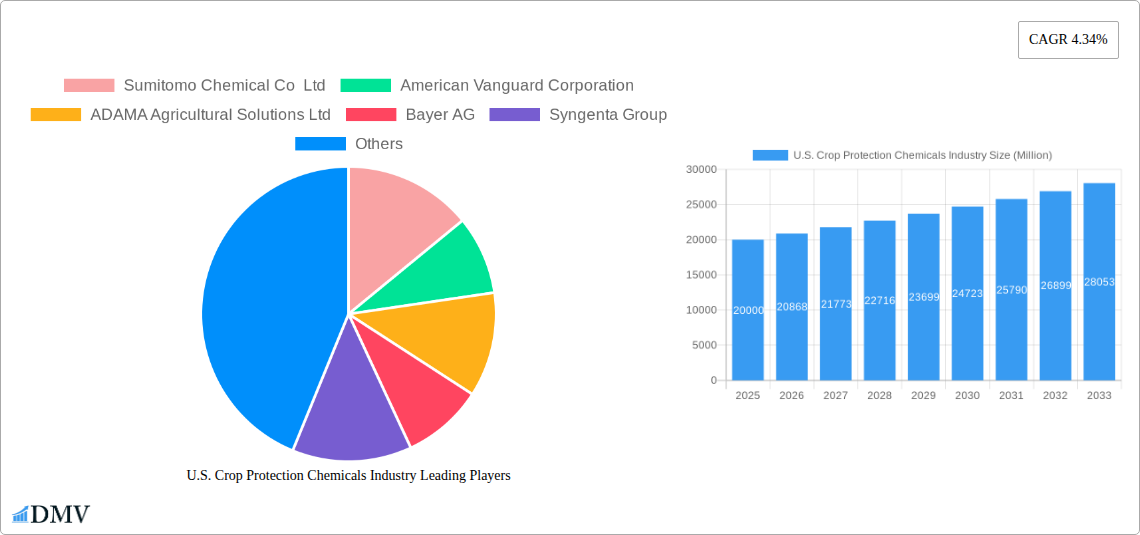
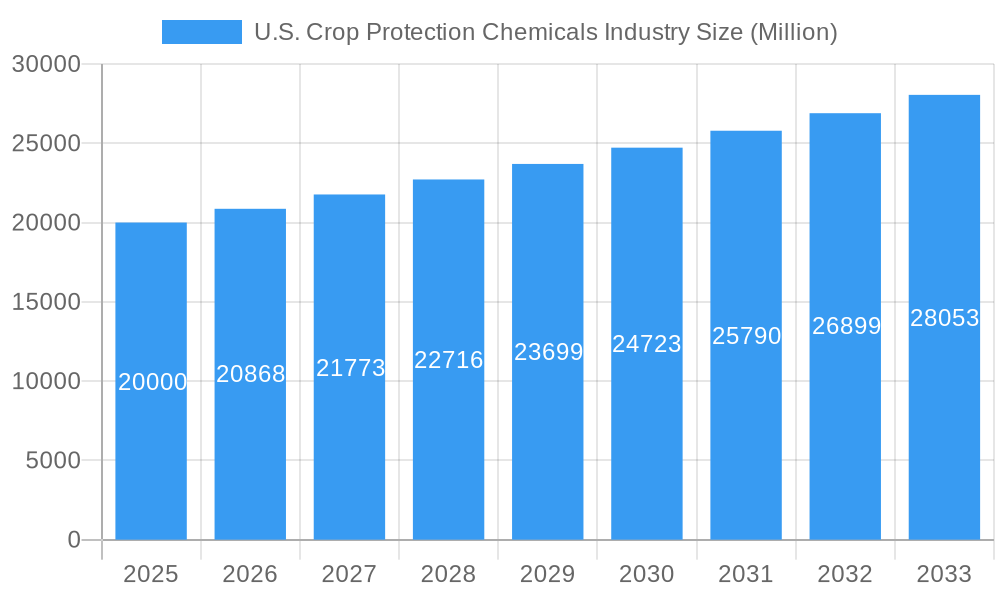
The U.S. crop protection chemicals market, valued at approximately $20 billion in 2025, is projected to experience robust growth, driven by increasing demand for food security and rising crop yields. A compound annual growth rate (CAGR) of 4.34% from 2025 to 2033 indicates a significant expansion of this market. Key drivers include the growing adoption of advanced farming techniques, the escalating prevalence of crop diseases and pests, and the increasing awareness among farmers regarding the importance of crop protection. Furthermore, government initiatives promoting sustainable agriculture and technological advancements in chemical formulation are contributing to market growth. The market is segmented by function (fungicides, herbicides, insecticides, etc.), application mode (foliar, soil treatment, etc.), and crop type (grains, fruits & vegetables, etc.). The dominant players, including Sumitomo Chemical, Bayer, Syngenta, and BASF, are continuously investing in research and development to introduce innovative, effective, and environmentally friendly crop protection solutions. Competition is fierce, necessitating strategic alliances and mergers to maintain market share.
U.S. Crop Protection Chemicals Industry Market Size (In Billion)
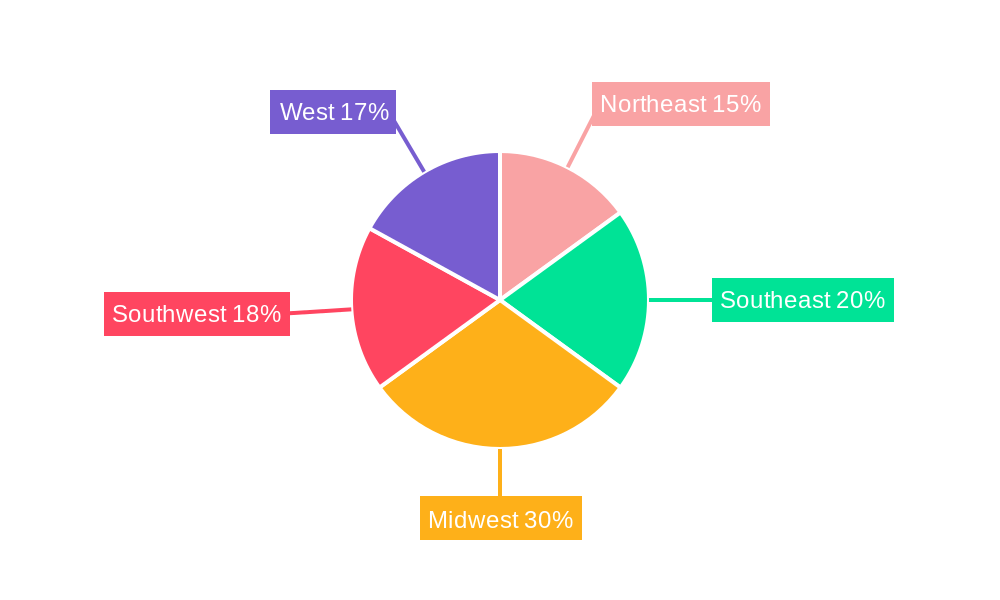
Regional variations exist within the U.S. market, with the Midwest and West regions likely exhibiting strong growth due to their significant agricultural production. However, increasing regulatory scrutiny related to environmental concerns and the rising cost of raw materials pose significant restraints. The industry is actively addressing these challenges through the development of biopesticides and other sustainable solutions, aiming to balance yield maximization with environmental sustainability. This transition towards sustainable practices is expected to influence market dynamics in the coming years, presenting both opportunities and challenges for industry players. The focus is shifting towards precision agriculture, aiming for targeted applications of crop protection chemicals to minimize environmental impact while optimizing crop yields.
U.S. Crop Protection Chemicals Industry Company Market Share
U.S. Crop Protection Chemicals Industry: A Comprehensive Market Report (2019-2033)
This insightful report provides a detailed analysis of the U.S. crop protection chemicals industry, offering a comprehensive overview of market trends, leading players, and future growth prospects. With a focus on the period 2019-2033, including a base year of 2025 and a forecast period of 2025-2033, this report is an essential resource for stakeholders seeking to understand and capitalize on opportunities within this dynamic sector. The market is valued at $XX Million in 2025 and is projected to reach $XX Million by 2033.
U.S. Crop Protection Chemicals Industry Market Composition & Trends
This section delves into the intricate composition of the U.S. crop protection chemicals market, examining key aspects influencing its trajectory. We analyze market concentration, revealing the market share distribution amongst key players like Bayer AG, Syngenta Group, BASF SE, and Corteva Agriscience. The report also explores the role of innovation, focusing on the development of new chemistries and formulations to address evolving pest resistance and consumer demand for sustainable solutions. Furthermore, the impact of the regulatory landscape, including EPA regulations and labeling requirements, is meticulously examined. The influence of substitute products, such as biological controls and integrated pest management (IPM) strategies, is also assessed. End-user profiles are detailed, covering commercial crop producers, fruits & vegetable farmers, and turf & ornamental specialists. Finally, a comprehensive overview of M&A activities within the sector is provided, including an analysis of deal values and their implications for market consolidation. The total value of M&A deals during the historical period (2019-2024) is estimated at $XX Million.
- Market Concentration: High concentration with top 5 players holding approximately xx% market share.
- Innovation Catalysts: Rising pest resistance, consumer preference for sustainable products, and technological advancements in formulation and delivery systems.
- Regulatory Landscape: Stringent EPA regulations driving the development and adoption of safer and more effective crop protection solutions.
- Substitute Products: Growth of biological control agents and IPM practices posing competitive pressure.
- End-User Profiles: Detailed segmentation across different crop types and farming practices.
- M&A Activities: Significant consolidation through mergers and acquisitions, with average deal value of $XX Million.
U.S. Crop Protection Chemicals Industry Industry Evolution
This section provides a detailed historical and future outlook of the U.S. crop protection chemicals market. We analyze market growth trajectories from 2019 to 2024, highlighting growth rates and adoption metrics for various crop protection solutions. Technological advancements, such as the development of precision application technologies, biopesticides, and advanced formulations, are discussed in detail. The evolution of consumer preferences towards environmentally friendly and sustainable practices is also thoroughly assessed. This analysis includes the impact of these factors on market growth and product demand. Key areas include the increasing adoption of digital agriculture technologies, such as precision spraying and drone technology. We also analyze the evolving role of regulatory changes and the impact of climate change on pest dynamics and crop production.
Leading Regions, Countries, or Segments in U.S. Crop Protection Chemicals Industry
This section identifies the dominant regions, countries, and segments within the U.S. crop protection chemicals market. Detailed analysis will highlight the leading segments by function (Fungicide, Herbicide, Insecticide, Molluscicide, Nematicide), application mode (Chemigation, Foliar, Fumigation, Seed Treatment, Soil Treatment), and crop type (Commercial Crops, Fruits & Vegetables, Grains & Cereals, Pulses & Oilseeds, Turf & Ornamental). Key drivers of dominance in each segment are explored, with specific examples of investment trends and regulatory support.
- Key Drivers (Examples):
- Herbicides: Growing prevalence of herbicide-resistant weeds driving demand.
- Foliar Application: Wide adoption due to ease of application and effectiveness across various crops.
- Grains & Cereals: High acreage and economic significance drive substantial demand.
- Dominance Factors: Detailed analysis of market dynamics driving leadership positions in specific segments, regions, and countries.
U.S. Crop Protection Chemicals Industry Product Innovations
This section showcases recent product innovations in the U.S. crop protection chemical market. It details novel chemistries, formulations, and application technologies, highlighting their unique selling propositions and advancements. Performance metrics, including efficacy and environmental impact, are analyzed to understand the benefits of these innovations for farmers and the environment.
Propelling Factors for U.S. Crop Protection Chemicals Industry Growth
This section outlines the key factors driving growth within the U.S. crop protection chemicals industry. These include technological advancements (e.g., precision agriculture, biopesticides), economic factors (e.g., rising agricultural productivity, increasing food demand), and regulatory influences (e.g., government support for sustainable agriculture).
Obstacles in the U.S. Crop Protection Chemicals Industry Market
This section examines the challenges faced by the U.S. crop protection chemicals industry. Key obstacles include stringent regulations, supply chain disruptions, and intense competition, along with their impact on market growth and profitability. Quantifiable impacts of these challenges are discussed.
Future Opportunities in U.S. Crop Protection Chemicals Industry
This section explores emerging opportunities for growth in the U.S. crop protection chemicals market. It identifies new markets (e.g., organic farming), technologies (e.g., AI-driven pest management), and consumer trends (e.g., demand for sustainable solutions) that present significant potential for future expansion.
Major Players in the U.S. Crop Protection Chemicals Industry Ecosystem
Key Developments in U.S. Crop Protection Chemicals Industry Industry
- April 2023: Nufarm launched Tourney EZ, a new liquid formulation fungicide for turf and ornamental crops. This strengthens Nufarm's position in this specific market segment, addressing customer demand for efficient solutions.
- March 2023: AMVAC introduced new herbicides (Impact Core and Sinate) targeting weed resistance in maize, a significant development in addressing a major challenge for maize production.
- January 2023: Bayer partnered with Oerth Bio to advance crop protection technology and develop eco-friendly solutions, signaling a shift towards sustainable and environmentally conscious practices within the industry.
Strategic U.S. Crop Protection Chemicals Industry Market Forecast
The U.S. crop protection chemicals market is poised for continued growth driven by factors such as rising global food demand, technological advancements fostering precision agriculture, and the increasing adoption of sustainable practices. Opportunities lie in the development and commercialization of novel biopesticides, improved formulation technologies that enhance efficacy and reduce environmental impact, and the expansion of digital agriculture solutions. This growth trajectory underscores the market's potential for sustained expansion in the coming years.
U.S. Crop Protection Chemicals Industry Segmentation
-
1. Function
- 1.1. Fungicide
- 1.2. Herbicide
- 1.3. Insecticide
- 1.4. Molluscicide
- 1.5. Nematicide
-
2. Application Mode
- 2.1. Chemigation
- 2.2. Foliar
- 2.3. Fumigation
- 2.4. Seed Treatment
- 2.5. Soil Treatment
-
3. Crop Type
- 3.1. Commercial Crops
- 3.2. Fruits & Vegetables
- 3.3. Grains & Cereals
- 3.4. Pulses & Oilseeds
- 3.5. Turf & Ornamental
-
4. Function
- 4.1. Fungicide
- 4.2. Herbicide
- 4.3. Insecticide
- 4.4. Molluscicide
- 4.5. Nematicide
-
5. Application Mode
- 5.1. Chemigation
- 5.2. Foliar
- 5.3. Fumigation
- 5.4. Seed Treatment
- 5.5. Soil Treatment
-
6. Crop Type
- 6.1. Commercial Crops
- 6.2. Fruits & Vegetables
- 6.3. Grains & Cereals
- 6.4. Pulses & Oilseeds
- 6.5. Turf & Ornamental
U.S. Crop Protection Chemicals Industry Segmentation By Geography
- 1. U.S.
U.S. Crop Protection Chemicals Industry Regional Market Share
Geographic Coverage of U.S. Crop Protection Chemicals Industry
U.S. Crop Protection Chemicals Industry REPORT HIGHLIGHTS
| Aspects | Details |
|---|---|
| Study Period | 2020-2034 |
| Base Year | 2025 |
| Estimated Year | 2026 |
| Forecast Period | 2026-2034 |
| Historical Period | 2020-2025 |
| Growth Rate | CAGR of 5% from 2020-2034 |
| Segmentation |
|
Table of Contents
- 1. Introduction
- 1.1. Research Scope
- 1.2. Market Segmentation
- 1.3. Research Objective
- 1.4. Definitions and Assumptions
- 2. Executive Summary
- 2.1. Market Snapshot
- 3. Market Dynamics
- 3.1. Market Drivers
- 3.2. Market Restrains
- 3.3. Market Trends
- 3.4. Market Opportunities
- 4. Market Factor Analysis
- 4.1. Porters Five Forces
- 4.1.1. Bargaining Power of Suppliers
- 4.1.2. Bargaining Power of Buyers
- 4.1.3. Threat of New Entrants
- 4.1.4. Threat of Substitutes
- 4.1.5. Competitive Rivalry
- 4.2. PESTEL analysis
- 4.3. BCG Analysis
- 4.3.1. Stars (High Growth, High Market Share)
- 4.3.2. Cash Cows (Low Growth, High Market Share)
- 4.3.3. Question Mark (High Growth, Low Market Share)
- 4.3.4. Dogs (Low Growth, Low Market Share)
- 4.4. Ansoff Matrix Analysis
- 4.5. Supply Chain Analysis
- 4.6. Regulatory Landscape
- 4.7. Current Market Potential and Opportunity Assessment (TAM–SAM–SOM Framework)
- 4.8. DMV Analyst Note
- 4.1. Porters Five Forces
- 5. Market Analysis, Insights and Forecast 2021-2033
- 5.1. Market Analysis, Insights and Forecast - by Function
- 5.1.1. Fungicide
- 5.1.2. Herbicide
- 5.1.3. Insecticide
- 5.1.4. Molluscicide
- 5.1.5. Nematicide
- 5.2. Market Analysis, Insights and Forecast - by Application Mode
- 5.2.1. Chemigation
- 5.2.2. Foliar
- 5.2.3. Fumigation
- 5.2.4. Seed Treatment
- 5.2.5. Soil Treatment
- 5.3. Market Analysis, Insights and Forecast - by Crop Type
- 5.3.1. Commercial Crops
- 5.3.2. Fruits & Vegetables
- 5.3.3. Grains & Cereals
- 5.3.4. Pulses & Oilseeds
- 5.3.5. Turf & Ornamental
- 5.4. Market Analysis, Insights and Forecast - by Function
- 5.4.1. Fungicide
- 5.4.2. Herbicide
- 5.4.3. Insecticide
- 5.4.4. Molluscicide
- 5.4.5. Nematicide
- 5.5. Market Analysis, Insights and Forecast - by Application Mode
- 5.5.1. Chemigation
- 5.5.2. Foliar
- 5.5.3. Fumigation
- 5.5.4. Seed Treatment
- 5.5.5. Soil Treatment
- 5.6. Market Analysis, Insights and Forecast - by Crop Type
- 5.6.1. Commercial Crops
- 5.6.2. Fruits & Vegetables
- 5.6.3. Grains & Cereals
- 5.6.4. Pulses & Oilseeds
- 5.6.5. Turf & Ornamental
- 5.7. Market Analysis, Insights and Forecast - by Region
- 5.7.1. U.S.
- 5.1. Market Analysis, Insights and Forecast - by Function
- 6. U.S. Crop Protection Chemicals Industry Analysis, Insights and Forecast, 2021-2033
- 6.1. Market Analysis, Insights and Forecast - by Function
- 6.1.1. Fungicide
- 6.1.2. Herbicide
- 6.1.3. Insecticide
- 6.1.4. Molluscicide
- 6.1.5. Nematicide
- 6.2. Market Analysis, Insights and Forecast - by Application Mode
- 6.2.1. Chemigation
- 6.2.2. Foliar
- 6.2.3. Fumigation
- 6.2.4. Seed Treatment
- 6.2.5. Soil Treatment
- 6.3. Market Analysis, Insights and Forecast - by Crop Type
- 6.3.1. Commercial Crops
- 6.3.2. Fruits & Vegetables
- 6.3.3. Grains & Cereals
- 6.3.4. Pulses & Oilseeds
- 6.3.5. Turf & Ornamental
- 6.4. Market Analysis, Insights and Forecast - by Function
- 6.4.1. Fungicide
- 6.4.2. Herbicide
- 6.4.3. Insecticide
- 6.4.4. Molluscicide
- 6.4.5. Nematicide
- 6.5. Market Analysis, Insights and Forecast - by Application Mode
- 6.5.1. Chemigation
- 6.5.2. Foliar
- 6.5.3. Fumigation
- 6.5.4. Seed Treatment
- 6.5.5. Soil Treatment
- 6.6. Market Analysis, Insights and Forecast - by Crop Type
- 6.6.1. Commercial Crops
- 6.6.2. Fruits & Vegetables
- 6.6.3. Grains & Cereals
- 6.6.4. Pulses & Oilseeds
- 6.6.5. Turf & Ornamental
- 6.1. Market Analysis, Insights and Forecast - by Function
- 7. Competitive Analysis
- 7.1. Company Profiles
- 7.1.1 Sumitomo Chemical Co Ltd
- 7.1.1.1. Company Overview
- 7.1.1.2. Products
- 7.1.1.3. Company Financials
- 7.1.1.4. SWOT Analysis
- 7.1.2 American Vanguard Corporation
- 7.1.2.1. Company Overview
- 7.1.2.2. Products
- 7.1.2.3. Company Financials
- 7.1.2.4. SWOT Analysis
- 7.1.3 ADAMA Agricultural Solutions Ltd
- 7.1.3.1. Company Overview
- 7.1.3.2. Products
- 7.1.3.3. Company Financials
- 7.1.3.4. SWOT Analysis
- 7.1.4 Bayer AG
- 7.1.4.1. Company Overview
- 7.1.4.2. Products
- 7.1.4.3. Company Financials
- 7.1.4.4. SWOT Analysis
- 7.1.5 Syngenta Group
- 7.1.5.1. Company Overview
- 7.1.5.2. Products
- 7.1.5.3. Company Financials
- 7.1.5.4. SWOT Analysis
- 7.1.6 BASF SE
- 7.1.6.1. Company Overview
- 7.1.6.2. Products
- 7.1.6.3. Company Financials
- 7.1.6.4. SWOT Analysis
- 7.1.7 FMC Corporation
- 7.1.7.1. Company Overview
- 7.1.7.2. Products
- 7.1.7.3. Company Financials
- 7.1.7.4. SWOT Analysis
- 7.1.8 UPL Limite
- 7.1.8.1. Company Overview
- 7.1.8.2. Products
- 7.1.8.3. Company Financials
- 7.1.8.4. SWOT Analysis
- 7.1.9 Corteva Agriscience
- 7.1.9.1. Company Overview
- 7.1.9.2. Products
- 7.1.9.3. Company Financials
- 7.1.9.4. SWOT Analysis
- 7.1.10 Nufarm Ltd
- 7.1.10.1. Company Overview
- 7.1.10.2. Products
- 7.1.10.3. Company Financials
- 7.1.10.4. SWOT Analysis
- 7.1.1 Sumitomo Chemical Co Ltd
- 7.2. Market Entropy
- 7.2.1 Company's Key Areas Served
- 7.2.2 Recent Developments
- 7.3. Company Market Share Analysis 2025
- 7.3.1 Top 5 Companies Market Share Analysis
- 7.3.2 Top 3 Companies Market Share Analysis
- 7.4. List of Potential Customers
- 8. Research Methodology
List of Figures
- Figure 1: U.S. Crop Protection Chemicals Industry Revenue Breakdown (billion, %) by Product 2025 & 2033
- Figure 2: U.S. Crop Protection Chemicals Industry Share (%) by Company 2025
List of Tables
- Table 1: U.S. Crop Protection Chemicals Industry Revenue billion Forecast, by Function 2020 & 2033
- Table 2: U.S. Crop Protection Chemicals Industry Volume Kiloton Forecast, by Function 2020 & 2033
- Table 3: U.S. Crop Protection Chemicals Industry Revenue billion Forecast, by Application Mode 2020 & 2033
- Table 4: U.S. Crop Protection Chemicals Industry Volume Kiloton Forecast, by Application Mode 2020 & 2033
- Table 5: U.S. Crop Protection Chemicals Industry Revenue billion Forecast, by Crop Type 2020 & 2033
- Table 6: U.S. Crop Protection Chemicals Industry Volume Kiloton Forecast, by Crop Type 2020 & 2033
- Table 7: U.S. Crop Protection Chemicals Industry Revenue billion Forecast, by Function 2020 & 2033
- Table 8: U.S. Crop Protection Chemicals Industry Volume Kiloton Forecast, by Function 2020 & 2033
- Table 9: U.S. Crop Protection Chemicals Industry Revenue billion Forecast, by Application Mode 2020 & 2033
- Table 10: U.S. Crop Protection Chemicals Industry Volume Kiloton Forecast, by Application Mode 2020 & 2033
- Table 11: U.S. Crop Protection Chemicals Industry Revenue billion Forecast, by Crop Type 2020 & 2033
- Table 12: U.S. Crop Protection Chemicals Industry Volume Kiloton Forecast, by Crop Type 2020 & 2033
- Table 13: U.S. Crop Protection Chemicals Industry Revenue billion Forecast, by Region 2020 & 2033
- Table 14: U.S. Crop Protection Chemicals Industry Volume Kiloton Forecast, by Region 2020 & 2033
- Table 15: U.S. Crop Protection Chemicals Industry Revenue billion Forecast, by Function 2020 & 2033
- Table 16: U.S. Crop Protection Chemicals Industry Volume Kiloton Forecast, by Function 2020 & 2033
- Table 17: U.S. Crop Protection Chemicals Industry Revenue billion Forecast, by Application Mode 2020 & 2033
- Table 18: U.S. Crop Protection Chemicals Industry Volume Kiloton Forecast, by Application Mode 2020 & 2033
- Table 19: U.S. Crop Protection Chemicals Industry Revenue billion Forecast, by Crop Type 2020 & 2033
- Table 20: U.S. Crop Protection Chemicals Industry Volume Kiloton Forecast, by Crop Type 2020 & 2033
- Table 21: U.S. Crop Protection Chemicals Industry Revenue billion Forecast, by Function 2020 & 2033
- Table 22: U.S. Crop Protection Chemicals Industry Volume Kiloton Forecast, by Function 2020 & 2033
- Table 23: U.S. Crop Protection Chemicals Industry Revenue billion Forecast, by Application Mode 2020 & 2033
- Table 24: U.S. Crop Protection Chemicals Industry Volume Kiloton Forecast, by Application Mode 2020 & 2033
- Table 25: U.S. Crop Protection Chemicals Industry Revenue billion Forecast, by Crop Type 2020 & 2033
- Table 26: U.S. Crop Protection Chemicals Industry Volume Kiloton Forecast, by Crop Type 2020 & 2033
- Table 27: U.S. Crop Protection Chemicals Industry Revenue billion Forecast, by Country 2020 & 2033
- Table 28: U.S. Crop Protection Chemicals Industry Volume Kiloton Forecast, by Country 2020 & 2033
Frequently Asked Questions
1. What is the projected Compound Annual Growth Rate (CAGR) of the U.S. Crop Protection Chemicals Industry?
The projected CAGR is approximately 5%.
2. Which companies are prominent players in the U.S. Crop Protection Chemicals Industry?
Key companies in the market include Sumitomo Chemical Co Ltd, American Vanguard Corporation, ADAMA Agricultural Solutions Ltd, Bayer AG, Syngenta Group, BASF SE, FMC Corporation, UPL Limite, Corteva Agriscience, Nufarm Ltd.
3. What are the main segments of the U.S. Crop Protection Chemicals Industry?
The market segments include Function, Application Mode, Crop Type, Function, Application Mode, Crop Type.
4. Can you provide details about the market size?
The market size is estimated to be USD 83.32 billion as of 2022.
5. What are some drivers contributing to market growth?
Seed Treatment As A Solution To Enhance Yield; Growing Awareness For Seed Treatment Among The Farmers; Rising Trend Of Organic Farming.
6. What are the notable trends driving market growth?
Rise in weed infestations. shortage of labor. increased wages. and need for higher food production may drive the herbicide market in the country.
7. Are there any restraints impacting market growth?
Limitations Across Farm-Level Seed Treatment; Rising Environmental Concerns.
8. Can you provide examples of recent developments in the market?
April 2023: Nufarm launched a new liquid formulation fungicide, Tourney EZ, exclusively for turf and ornamental crops based on customer demand, which further strengthens the company's role in turf and ornamental crop protection.March 2023: AMVAC launched a portfolio of herbicides, including Impact Core and Sinate, to combat weed resistance in maize.January 2023: Bayer formed a new partnership with Oerth Bio to enhance crop protection technology and create more eco-friendly crop protection solutions.
9. What pricing options are available for accessing the report?
Pricing options include single-user, multi-user, and enterprise licenses priced at USD 3800, USD 4500, and USD 5800 respectively.
10. Is the market size provided in terms of value or volume?
The market size is provided in terms of value, measured in billion and volume, measured in Kiloton.
11. Are there any specific market keywords associated with the report?
Yes, the market keyword associated with the report is "U.S. Crop Protection Chemicals Industry," which aids in identifying and referencing the specific market segment covered.
12. How do I determine which pricing option suits my needs best?
The pricing options vary based on user requirements and access needs. Individual users may opt for single-user licenses, while businesses requiring broader access may choose multi-user or enterprise licenses for cost-effective access to the report.
13. Are there any additional resources or data provided in the U.S. Crop Protection Chemicals Industry report?
While the report offers comprehensive insights, it's advisable to review the specific contents or supplementary materials provided to ascertain if additional resources or data are available.
14. How can I stay updated on further developments or reports in the U.S. Crop Protection Chemicals Industry?
To stay informed about further developments, trends, and reports in the U.S. Crop Protection Chemicals Industry, consider subscribing to industry newsletters, following relevant companies and organizations, or regularly checking reputable industry news sources and publications.
Methodology
Step 1 - Identification of Relevant Samples Size from Population Database


Step 2 - Approaches for Defining Global Market Size (Value, Volume* & Price*)

Note*: In applicable scenarios
Step 3 - Data Sources
Primary Research
- Web Analytics
- Survey Reports
- Research Institute
- Latest Research Reports
- Opinion Leaders
Secondary Research
- Annual Reports
- White Paper
- Latest Press Release
- Industry Association
- Paid Database
- Investor Presentations

Step 4 - Data Triangulation
Involves using different sources of information in order to increase the validity of a study
These sources are likely to be stakeholders in a program - participants, other researchers, program staff, other community members, and so on.
Then we put all data in single framework & apply various statistical tools to find out the dynamic on the market.
During the analysis stage, feedback from the stakeholder groups would be compared to determine areas of agreement as well as areas of divergence