

Key Insights
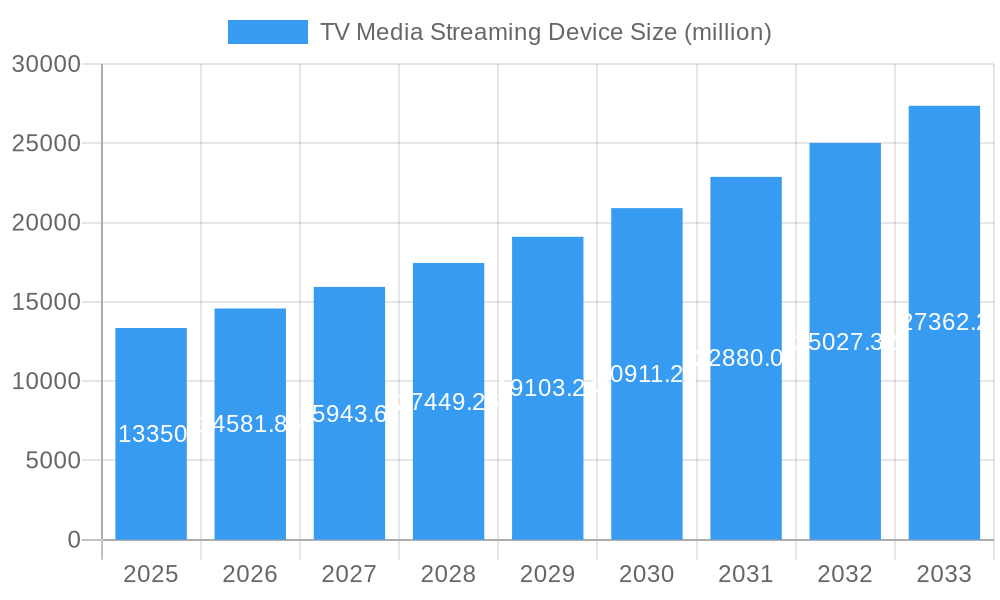
The global TV media streaming device market is poised for significant expansion, projected to reach a market size of $145.87 billion by 2025. The market is expected to witness a Compound Annual Growth Rate (CAGR) of 8.4% from 2025 to 2033. This growth trajectory is underpinned by several key drivers. The increasing availability and affordability of high-speed internet are expanding the reach of streaming services to a wider consumer base. A notable trend is the ongoing shift away from traditional cable subscriptions towards streaming platforms, driven by the appeal of on-demand content and a diverse array of programming. Technological advancements, including the development of ultra-high-definition (4K and 8K) resolution devices, improved user interfaces, and seamless integration with smart home ecosystems, are also significant contributors to market expansion. Intense competition among leading manufacturers such as Roku, Google, Apple, Amazon, and others is fostering innovation and driving competitive pricing, ultimately benefiting consumers.
TV Media Streaming Device Market Size (In Billion)
Despite the positive outlook, the market confronts certain challenges. Varying levels of global internet penetration, particularly in emerging economies, and concerns surrounding data privacy and security for streaming devices present potential limitations. Furthermore, escalating content licensing costs for streaming providers could influence pricing strategies and potentially impede growth if not effectively managed. Nevertheless, the long-term forecast for the TV media streaming device market remains optimistic, propelled by continuous technological innovation, evolving consumer preferences for digital entertainment, and the persistent migration towards on-demand media consumption. Granular market insights are expected to emerge from detailed segmentation analysis, likely encompassing device types, pricing strategies, and functional features, offering targeted opportunities for market expansion.
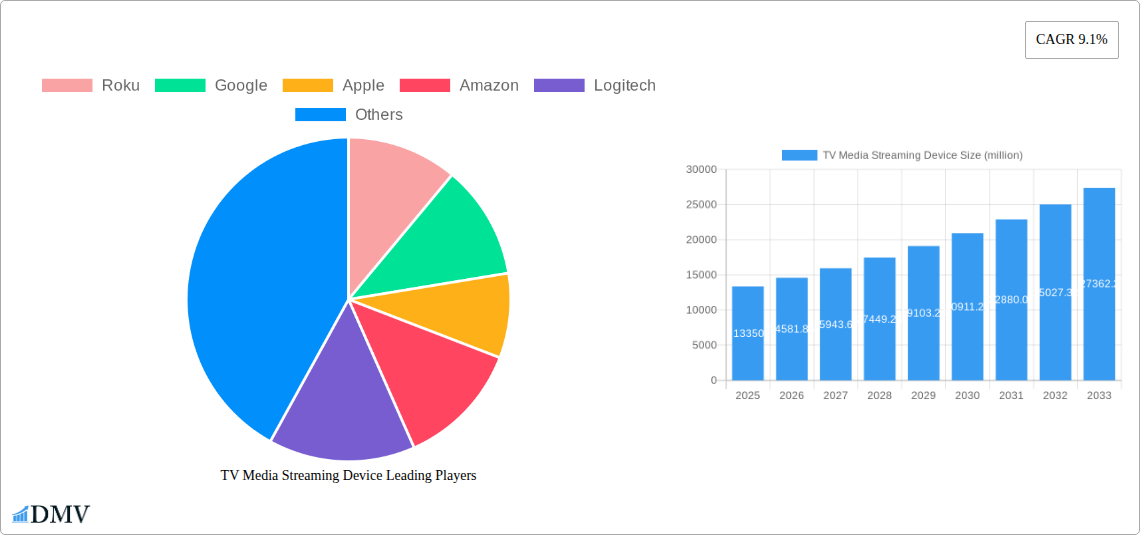
TV Media Streaming Device Company Market Share
TV Media Streaming Device Market Report: A Comprehensive Analysis (2019-2033)
This insightful report delivers a comprehensive analysis of the global TV Media Streaming Device market, providing a detailed overview of market dynamics, key players, and future growth prospects. The study period covers 2019-2033, with 2025 as the base and estimated year. This report is crucial for stakeholders seeking to understand the evolving landscape of this multi-billion dollar industry, projected to reach xx million units by 2033.
TV Media Streaming Device Market Composition & Trends
This section evaluates the competitive landscape, innovation drivers, regulatory factors, and market trends within the TV Media Streaming Device market. The market, valued at $xx million in 2024, is characterized by intense competition among major players like Roku, Google, Apple, Amazon, and others. Market share distribution reveals a concentrated landscape, with the top five players holding approximately 70% of the market share in 2024.
- Market Concentration: High, with the top 5 companies controlling ~70% market share in 2024.
- Innovation Catalysts: Advancements in streaming technology (4K, 8K, HDR), AI-powered features, and integration with smart home ecosystems.
- Regulatory Landscape: Varying regulations across geographies concerning data privacy and content licensing impact market strategies.
- Substitute Products: Traditional cable TV, although declining, remains a significant substitute.
- End-User Profiles: The market caters to a diverse range of consumers, from cord-cutters to traditional TV viewers seeking enhanced streaming options. The average age of users is declining year by year.
- M&A Activities: Significant M&A activity observed in the historical period (2019-2024), with total deal values exceeding $xx million, primarily focused on enhancing content libraries and technological capabilities. Examples include [Insert specific examples of M&A deals with values if available, otherwise state "Examples unavailable due to data confidentiality"].
TV Media Streaming Device Industry Evolution
The TV Media Streaming Device market has experienced explosive growth during the historical period (2019-2024), driven by factors such as rising internet penetration, increasing affordability of devices, and a growing preference for on-demand content. The market witnessed a Compound Annual Growth Rate (CAGR) of xx% during 2019-2024. This trajectory is projected to continue, albeit at a slightly moderated pace, during the forecast period (2025-2033), reaching an estimated market size of xx million units by 2033.
Technological advancements, such as the proliferation of 4K and 8K resolution streaming, support for high dynamic range (HDR) video, and the integration of voice assistants, have significantly enhanced the user experience. Furthermore, the rising adoption of smart TVs, many of which integrate streaming capabilities directly, is further bolstering market growth. Consumer demand is shifting towards devices offering superior video quality, seamless user interfaces, and robust application ecosystems. The integration of features like personalized recommendations and cross-device compatibility are key factors influencing consumer purchasing decisions.
Leading Regions, Countries, or Segments in TV Media Streaming Device
The North American market leads globally in TV Media Streaming Device adoption, driven by high internet penetration, high disposable incomes, and a mature streaming content ecosystem.
- Key Drivers in North America:
- High internet and broadband penetration.
- Strong consumer preference for on-demand entertainment.
- Early adoption of new technologies.
- High levels of investment in streaming infrastructure.
- Favorable regulatory environment.
Other regions such as Western Europe, Asia-Pacific (especially India and China), and Latin America are demonstrating robust growth, though at varying rates. The growth in these regions is primarily driven by factors such as increasing internet accessibility, rising disposable incomes, and the expanding availability of affordable streaming devices and content.
TV Media Streaming Device Product Innovations
Recent innovations focus on enhancing user experience through features such as improved image processing technologies (e.g., AI-powered upscaling), enhanced voice control capabilities, seamless multi-device integration, and advanced gaming features. Manufacturers are actively differentiating themselves through unique selling propositions like specialized audio enhancements, superior build quality, and enhanced user interface designs. The integration of advanced connectivity options like Wi-Fi 6E is also becoming increasingly prevalent.
Propelling Factors for TV Media Streaming Device Growth
The market's growth is fueled by several key factors: the increasing affordability of devices; the rise of over-the-top (OTT) streaming services; the growing demand for high-quality video content; the expansion of broadband internet access globally; and technological advancements driving improvements in image quality, processing power, and user interface design. Government initiatives supporting digital infrastructure development in emerging markets further contribute to this growth.
Obstacles in the TV Media Streaming Device Market
Market growth faces challenges such as varying regulatory landscapes concerning content licensing and data privacy, potential supply chain disruptions affecting component availability, and intensifying competition among established and emerging players. These factors can influence pricing strategies, product availability, and overall market expansion. The dominance of a few key players also creates barriers to entry for smaller players.
Future Opportunities in TV Media Streaming Device
Future opportunities lie in the expansion into untapped markets, particularly in developing regions with growing internet penetration and rising disposable incomes. The development of next-generation technologies like 8K resolution streaming, advanced AI features, and integration with extended reality (XR) devices present significant growth potential. Moreover, the increasing demand for personalized content recommendations and innovative user interfaces presents further opportunities for product differentiation and market expansion.
Key Developments in TV Media Streaming Device Industry
- 2024 Q4: Amazon announced the launch of its new Fire TV Stick 4K Max with enhanced features.
- 2023 Q3: Roku partnered with a major content provider to expand its streaming library.
- 2022 Q2: Google integrated advanced AI features into its Chromecast with Google TV.
- [Add more key developments with dates as available]
Strategic TV Media Streaming Device Market Forecast
The TV Media Streaming Device market is poised for continued growth driven by technological advancements, evolving consumer preferences, and expanding global internet access. The market's future is bright, particularly with the emergence of new technologies and applications. Continued innovation in areas such as AI-powered features, 8K streaming, and advanced gaming integration will be key drivers in shaping the market landscape over the forecast period (2025-2033). The projected market value by 2033 underscores the significant potential for growth and investment within this dynamic sector.
TV Media Streaming Device Segmentation
-
1. Application
- 1.1. Online Sales
- 1.2. Offline Sales
-
2. Types
- 2.1. Streaming Box
- 2.2. Streaming Stick
TV Media Streaming Device Segmentation By Geography
-
1. North America
- 1.1. United States
- 1.2. Canada
- 1.3. Mexico
-
2. South America
- 2.1. Brazil
- 2.2. Argentina
- 2.3. Rest of South America
-
3. Europe
- 3.1. United Kingdom
- 3.2. Germany
- 3.3. France
- 3.4. Italy
- 3.5. Spain
- 3.6. Russia
- 3.7. Benelux
- 3.8. Nordics
- 3.9. Rest of Europe
-
4. Middle East & Africa
- 4.1. Turkey
- 4.2. Israel
- 4.3. GCC
- 4.4. North Africa
- 4.5. South Africa
- 4.6. Rest of Middle East & Africa
-
5. Asia Pacific
- 5.1. China
- 5.2. India
- 5.3. Japan
- 5.4. South Korea
- 5.5. ASEAN
- 5.6. Oceania
- 5.7. Rest of Asia Pacific
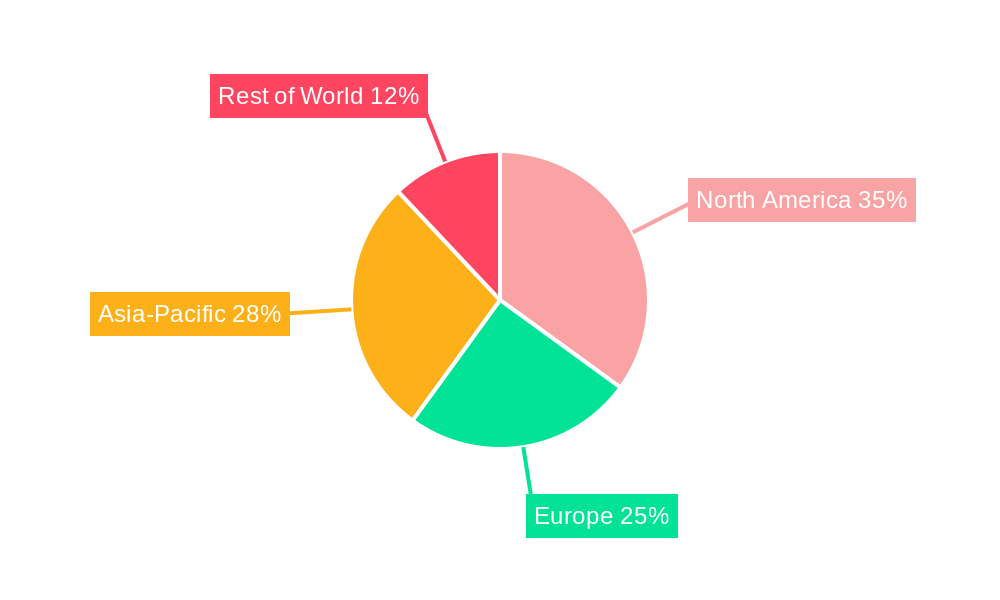
TV Media Streaming Device Regional Market Share
Geographic Coverage of TV Media Streaming Device
TV Media Streaming Device REPORT HIGHLIGHTS
| Aspects | Details |
|---|---|
| Study Period | 2020-2034 |
| Base Year | 2025 |
| Estimated Year | 2026 |
| Forecast Period | 2026-2034 |
| Historical Period | 2020-2025 |
| Growth Rate | CAGR of 8.4% from 2020-2034 |
| Segmentation |
|
Table of Contents
- 1. Introduction
- 1.1. Research Scope
- 1.2. Market Segmentation
- 1.3. Research Objective
- 1.4. Definitions and Assumptions
- 2. Executive Summary
- 2.1. Market Snapshot
- 3. Market Dynamics
- 3.1. Market Drivers
- 3.2. Market Restrains
- 3.3. Market Trends
- 3.4. Market Opportunities
- 4. Market Factor Analysis
- 4.1. Porters Five Forces
- 4.1.1. Bargaining Power of Suppliers
- 4.1.2. Bargaining Power of Buyers
- 4.1.3. Threat of New Entrants
- 4.1.4. Threat of Substitutes
- 4.1.5. Competitive Rivalry
- 4.2. PESTEL analysis
- 4.3. BCG Analysis
- 4.3.1. Stars (High Growth, High Market Share)
- 4.3.2. Cash Cows (Low Growth, High Market Share)
- 4.3.3. Question Mark (High Growth, Low Market Share)
- 4.3.4. Dogs (Low Growth, Low Market Share)
- 4.4. Ansoff Matrix Analysis
- 4.5. Supply Chain Analysis
- 4.6. Regulatory Landscape
- 4.7. Current Market Potential and Opportunity Assessment (TAM–SAM–SOM Framework)
- 4.8. DMV Analyst Note
- 4.1. Porters Five Forces
- 5. Market Analysis, Insights and Forecast 2021-2033
- 5.1. Market Analysis, Insights and Forecast - by Application
- 5.1.1. Online Sales
- 5.1.2. Offline Sales
- 5.2. Market Analysis, Insights and Forecast - by Types
- 5.2.1. Streaming Box
- 5.2.2. Streaming Stick
- 5.3. Market Analysis, Insights and Forecast - by Region
- 5.3.1. North America
- 5.3.2. South America
- 5.3.3. Europe
- 5.3.4. Middle East & Africa
- 5.3.5. Asia Pacific
- 5.1. Market Analysis, Insights and Forecast - by Application
- 6. Global TV Media Streaming Device Analysis, Insights and Forecast, 2021-2033
- 6.1. Market Analysis, Insights and Forecast - by Application
- 6.1.1. Online Sales
- 6.1.2. Offline Sales
- 6.2. Market Analysis, Insights and Forecast - by Types
- 6.2.1. Streaming Box
- 6.2.2. Streaming Stick
- 6.1. Market Analysis, Insights and Forecast - by Application
- 7. North America TV Media Streaming Device Analysis, Insights and Forecast, 2020-2032
- 7.1. Market Analysis, Insights and Forecast - by Application
- 7.1.1. Online Sales
- 7.1.2. Offline Sales
- 7.2. Market Analysis, Insights and Forecast - by Types
- 7.2.1. Streaming Box
- 7.2.2. Streaming Stick
- 7.1. Market Analysis, Insights and Forecast - by Application
- 8. South America TV Media Streaming Device Analysis, Insights and Forecast, 2020-2032
- 8.1. Market Analysis, Insights and Forecast - by Application
- 8.1.1. Online Sales
- 8.1.2. Offline Sales
- 8.2. Market Analysis, Insights and Forecast - by Types
- 8.2.1. Streaming Box
- 8.2.2. Streaming Stick
- 8.1. Market Analysis, Insights and Forecast - by Application
- 9. Europe TV Media Streaming Device Analysis, Insights and Forecast, 2020-2032
- 9.1. Market Analysis, Insights and Forecast - by Application
- 9.1.1. Online Sales
- 9.1.2. Offline Sales
- 9.2. Market Analysis, Insights and Forecast - by Types
- 9.2.1. Streaming Box
- 9.2.2. Streaming Stick
- 9.1. Market Analysis, Insights and Forecast - by Application
- 10. Middle East & Africa TV Media Streaming Device Analysis, Insights and Forecast, 2020-2032
- 10.1. Market Analysis, Insights and Forecast - by Application
- 10.1.1. Online Sales
- 10.1.2. Offline Sales
- 10.2. Market Analysis, Insights and Forecast - by Types
- 10.2.1. Streaming Box
- 10.2.2. Streaming Stick
- 10.1. Market Analysis, Insights and Forecast - by Application
- 11. Asia Pacific TV Media Streaming Device Analysis, Insights and Forecast, 2020-2032
- 11.1. Market Analysis, Insights and Forecast - by Application
- 11.1.1. Online Sales
- 11.1.2. Offline Sales
- 11.2. Market Analysis, Insights and Forecast - by Types
- 11.2.1. Streaming Box
- 11.2.2. Streaming Stick
- 11.1. Market Analysis, Insights and Forecast - by Application
- 12. Competitive Analysis
- 12.1. Company Profiles
- 12.1.1 Roku
- 12.1.1.1. Company Overview
- 12.1.1.2. Products
- 12.1.1.3. Company Financials
- 12.1.1.4. SWOT Analysis
- 12.1.2 Google
- 12.1.2.1. Company Overview
- 12.1.2.2. Products
- 12.1.2.3. Company Financials
- 12.1.2.4. SWOT Analysis
- 12.1.3 Apple
- 12.1.3.1. Company Overview
- 12.1.3.2. Products
- 12.1.3.3. Company Financials
- 12.1.3.4. SWOT Analysis
- 12.1.4 Amazon
- 12.1.4.1. Company Overview
- 12.1.4.2. Products
- 12.1.4.3. Company Financials
- 12.1.4.4. SWOT Analysis
- 12.1.5 Logitech
- 12.1.5.1. Company Overview
- 12.1.5.2. Products
- 12.1.5.3. Company Financials
- 12.1.5.4. SWOT Analysis
- 12.1.6 Intel
- 12.1.6.1. Company Overview
- 12.1.6.2. Products
- 12.1.6.3. Company Financials
- 12.1.6.4. SWOT Analysis
- 12.1.7 Nvidia
- 12.1.7.1. Company Overview
- 12.1.7.2. Products
- 12.1.7.3. Company Financials
- 12.1.7.4. SWOT Analysis
- 12.1.8 Xiaomi
- 12.1.8.1. Company Overview
- 12.1.8.2. Products
- 12.1.8.3. Company Financials
- 12.1.8.4. SWOT Analysis
- 12.1.1 Roku
- 12.2. Market Entropy
- 12.2.1 Company's Key Areas Served
- 12.2.2 Recent Developments
- 12.3. Company Market Share Analysis 2025
- 12.3.1 Top 5 Companies Market Share Analysis
- 12.3.2 Top 3 Companies Market Share Analysis
- 12.4. List of Potential Customers
- 13. Research Methodology
List of Figures
- Figure 1: Global TV Media Streaming Device Revenue Breakdown (billion, %) by Region 2025 & 2033
- Figure 2: North America TV Media Streaming Device Revenue (billion), by Application 2025 & 2033
- Figure 3: North America TV Media Streaming Device Revenue Share (%), by Application 2025 & 2033
- Figure 4: North America TV Media Streaming Device Revenue (billion), by Types 2025 & 2033
- Figure 5: North America TV Media Streaming Device Revenue Share (%), by Types 2025 & 2033
- Figure 6: North America TV Media Streaming Device Revenue (billion), by Country 2025 & 2033
- Figure 7: North America TV Media Streaming Device Revenue Share (%), by Country 2025 & 2033
- Figure 8: South America TV Media Streaming Device Revenue (billion), by Application 2025 & 2033
- Figure 9: South America TV Media Streaming Device Revenue Share (%), by Application 2025 & 2033
- Figure 10: South America TV Media Streaming Device Revenue (billion), by Types 2025 & 2033
- Figure 11: South America TV Media Streaming Device Revenue Share (%), by Types 2025 & 2033
- Figure 12: South America TV Media Streaming Device Revenue (billion), by Country 2025 & 2033
- Figure 13: South America TV Media Streaming Device Revenue Share (%), by Country 2025 & 2033
- Figure 14: Europe TV Media Streaming Device Revenue (billion), by Application 2025 & 2033
- Figure 15: Europe TV Media Streaming Device Revenue Share (%), by Application 2025 & 2033
- Figure 16: Europe TV Media Streaming Device Revenue (billion), by Types 2025 & 2033
- Figure 17: Europe TV Media Streaming Device Revenue Share (%), by Types 2025 & 2033
- Figure 18: Europe TV Media Streaming Device Revenue (billion), by Country 2025 & 2033
- Figure 19: Europe TV Media Streaming Device Revenue Share (%), by Country 2025 & 2033
- Figure 20: Middle East & Africa TV Media Streaming Device Revenue (billion), by Application 2025 & 2033
- Figure 21: Middle East & Africa TV Media Streaming Device Revenue Share (%), by Application 2025 & 2033
- Figure 22: Middle East & Africa TV Media Streaming Device Revenue (billion), by Types 2025 & 2033
- Figure 23: Middle East & Africa TV Media Streaming Device Revenue Share (%), by Types 2025 & 2033
- Figure 24: Middle East & Africa TV Media Streaming Device Revenue (billion), by Country 2025 & 2033
- Figure 25: Middle East & Africa TV Media Streaming Device Revenue Share (%), by Country 2025 & 2033
- Figure 26: Asia Pacific TV Media Streaming Device Revenue (billion), by Application 2025 & 2033
- Figure 27: Asia Pacific TV Media Streaming Device Revenue Share (%), by Application 2025 & 2033
- Figure 28: Asia Pacific TV Media Streaming Device Revenue (billion), by Types 2025 & 2033
- Figure 29: Asia Pacific TV Media Streaming Device Revenue Share (%), by Types 2025 & 2033
- Figure 30: Asia Pacific TV Media Streaming Device Revenue (billion), by Country 2025 & 2033
- Figure 31: Asia Pacific TV Media Streaming Device Revenue Share (%), by Country 2025 & 2033
List of Tables
- Table 1: Global TV Media Streaming Device Revenue billion Forecast, by Application 2020 & 2033
- Table 2: Global TV Media Streaming Device Revenue billion Forecast, by Types 2020 & 2033
- Table 3: Global TV Media Streaming Device Revenue billion Forecast, by Region 2020 & 2033
- Table 4: Global TV Media Streaming Device Revenue billion Forecast, by Application 2020 & 2033
- Table 5: Global TV Media Streaming Device Revenue billion Forecast, by Types 2020 & 2033
- Table 6: Global TV Media Streaming Device Revenue billion Forecast, by Country 2020 & 2033
- Table 7: United States TV Media Streaming Device Revenue (billion) Forecast, by Application 2020 & 2033
- Table 8: Canada TV Media Streaming Device Revenue (billion) Forecast, by Application 2020 & 2033
- Table 9: Mexico TV Media Streaming Device Revenue (billion) Forecast, by Application 2020 & 2033
- Table 10: Global TV Media Streaming Device Revenue billion Forecast, by Application 2020 & 2033
- Table 11: Global TV Media Streaming Device Revenue billion Forecast, by Types 2020 & 2033
- Table 12: Global TV Media Streaming Device Revenue billion Forecast, by Country 2020 & 2033
- Table 13: Brazil TV Media Streaming Device Revenue (billion) Forecast, by Application 2020 & 2033
- Table 14: Argentina TV Media Streaming Device Revenue (billion) Forecast, by Application 2020 & 2033
- Table 15: Rest of South America TV Media Streaming Device Revenue (billion) Forecast, by Application 2020 & 2033
- Table 16: Global TV Media Streaming Device Revenue billion Forecast, by Application 2020 & 2033
- Table 17: Global TV Media Streaming Device Revenue billion Forecast, by Types 2020 & 2033
- Table 18: Global TV Media Streaming Device Revenue billion Forecast, by Country 2020 & 2033
- Table 19: United Kingdom TV Media Streaming Device Revenue (billion) Forecast, by Application 2020 & 2033
- Table 20: Germany TV Media Streaming Device Revenue (billion) Forecast, by Application 2020 & 2033
- Table 21: France TV Media Streaming Device Revenue (billion) Forecast, by Application 2020 & 2033
- Table 22: Italy TV Media Streaming Device Revenue (billion) Forecast, by Application 2020 & 2033
- Table 23: Spain TV Media Streaming Device Revenue (billion) Forecast, by Application 2020 & 2033
- Table 24: Russia TV Media Streaming Device Revenue (billion) Forecast, by Application 2020 & 2033
- Table 25: Benelux TV Media Streaming Device Revenue (billion) Forecast, by Application 2020 & 2033
- Table 26: Nordics TV Media Streaming Device Revenue (billion) Forecast, by Application 2020 & 2033
- Table 27: Rest of Europe TV Media Streaming Device Revenue (billion) Forecast, by Application 2020 & 2033
- Table 28: Global TV Media Streaming Device Revenue billion Forecast, by Application 2020 & 2033
- Table 29: Global TV Media Streaming Device Revenue billion Forecast, by Types 2020 & 2033
- Table 30: Global TV Media Streaming Device Revenue billion Forecast, by Country 2020 & 2033
- Table 31: Turkey TV Media Streaming Device Revenue (billion) Forecast, by Application 2020 & 2033
- Table 32: Israel TV Media Streaming Device Revenue (billion) Forecast, by Application 2020 & 2033
- Table 33: GCC TV Media Streaming Device Revenue (billion) Forecast, by Application 2020 & 2033
- Table 34: North Africa TV Media Streaming Device Revenue (billion) Forecast, by Application 2020 & 2033
- Table 35: South Africa TV Media Streaming Device Revenue (billion) Forecast, by Application 2020 & 2033
- Table 36: Rest of Middle East & Africa TV Media Streaming Device Revenue (billion) Forecast, by Application 2020 & 2033
- Table 37: Global TV Media Streaming Device Revenue billion Forecast, by Application 2020 & 2033
- Table 38: Global TV Media Streaming Device Revenue billion Forecast, by Types 2020 & 2033
- Table 39: Global TV Media Streaming Device Revenue billion Forecast, by Country 2020 & 2033
- Table 40: China TV Media Streaming Device Revenue (billion) Forecast, by Application 2020 & 2033
- Table 41: India TV Media Streaming Device Revenue (billion) Forecast, by Application 2020 & 2033
- Table 42: Japan TV Media Streaming Device Revenue (billion) Forecast, by Application 2020 & 2033
- Table 43: South Korea TV Media Streaming Device Revenue (billion) Forecast, by Application 2020 & 2033
- Table 44: ASEAN TV Media Streaming Device Revenue (billion) Forecast, by Application 2020 & 2033
- Table 45: Oceania TV Media Streaming Device Revenue (billion) Forecast, by Application 2020 & 2033
- Table 46: Rest of Asia Pacific TV Media Streaming Device Revenue (billion) Forecast, by Application 2020 & 2033
Frequently Asked Questions
1. What is the projected Compound Annual Growth Rate (CAGR) of the TV Media Streaming Device?
The projected CAGR is approximately 8.4%.
2. Which companies are prominent players in the TV Media Streaming Device?
Key companies in the market include Roku, Google, Apple, Amazon, Logitech, Intel, Nvidia, Xiaomi.
3. What are the main segments of the TV Media Streaming Device?
The market segments include Application, Types.
4. Can you provide details about the market size?
The market size is estimated to be USD 145.87 billion as of 2022.
5. What are some drivers contributing to market growth?
N/A
6. What are the notable trends driving market growth?
N/A
7. Are there any restraints impacting market growth?
N/A
8. Can you provide examples of recent developments in the market?
N/A
9. What pricing options are available for accessing the report?
Pricing options include single-user, multi-user, and enterprise licenses priced at USD 4900.00, USD 7350.00, and USD 9800.00 respectively.
10. Is the market size provided in terms of value or volume?
The market size is provided in terms of value, measured in billion.
11. Are there any specific market keywords associated with the report?
Yes, the market keyword associated with the report is "TV Media Streaming Device," which aids in identifying and referencing the specific market segment covered.
12. How do I determine which pricing option suits my needs best?
The pricing options vary based on user requirements and access needs. Individual users may opt for single-user licenses, while businesses requiring broader access may choose multi-user or enterprise licenses for cost-effective access to the report.
13. Are there any additional resources or data provided in the TV Media Streaming Device report?
While the report offers comprehensive insights, it's advisable to review the specific contents or supplementary materials provided to ascertain if additional resources or data are available.
14. How can I stay updated on further developments or reports in the TV Media Streaming Device?
To stay informed about further developments, trends, and reports in the TV Media Streaming Device, consider subscribing to industry newsletters, following relevant companies and organizations, or regularly checking reputable industry news sources and publications.
Methodology
Step 1 - Identification of Relevant Samples Size from Population Database


Step 2 - Approaches for Defining Global Market Size (Value, Volume* & Price*)

Note*: In applicable scenarios
Step 3 - Data Sources
Primary Research
- Web Analytics
- Survey Reports
- Research Institute
- Latest Research Reports
- Opinion Leaders
Secondary Research
- Annual Reports
- White Paper
- Latest Press Release
- Industry Association
- Paid Database
- Investor Presentations

Step 4 - Data Triangulation
Involves using different sources of information in order to increase the validity of a study
These sources are likely to be stakeholders in a program - participants, other researchers, program staff, other community members, and so on.
Then we put all data in single framework & apply various statistical tools to find out the dynamic on the market.
During the analysis stage, feedback from the stakeholder groups would be compared to determine areas of agreement as well as areas of divergence