

Key Insights
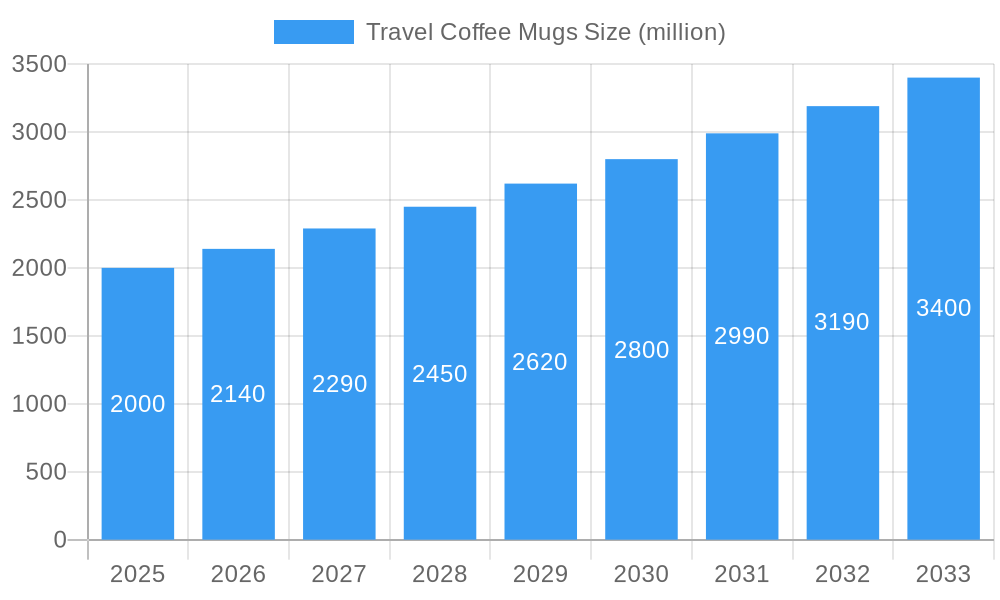
The travel coffee mug market is experiencing robust growth, driven by increasing consumer demand for eco-friendly and convenient solutions for on-the-go coffee consumption. The market, estimated at $2 billion in 2025, is projected to expand at a Compound Annual Growth Rate (CAGR) of 7% from 2025 to 2033, reaching an estimated value of $3.5 billion by 2033. This expansion is fueled by several key factors: the rising popularity of specialty coffee, increased awareness of environmental sustainability (reducing disposable cup waste), and the growing adoption of remote work and active lifestyles. Consumers are increasingly seeking durable, high-quality travel mugs that offer superior insulation, leak-proof designs, and aesthetically pleasing features. Major players like Yeti, Hydro Flask, and Stanley are leveraging strong brand recognition and innovative product designs to capture significant market share. However, the market faces challenges, including intense competition, fluctuating material costs, and evolving consumer preferences. The market segmentation reveals strong demand across various materials (stainless steel, ceramic, plastic), sizes, and price points, catering to diverse consumer needs and preferences.
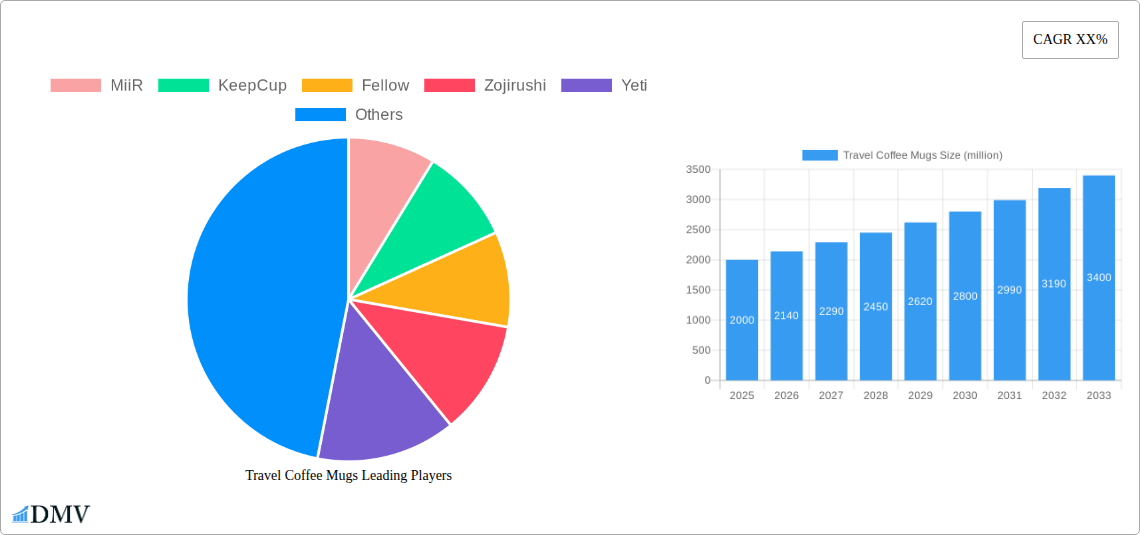
Travel Coffee Mugs Market Size (In Billion)
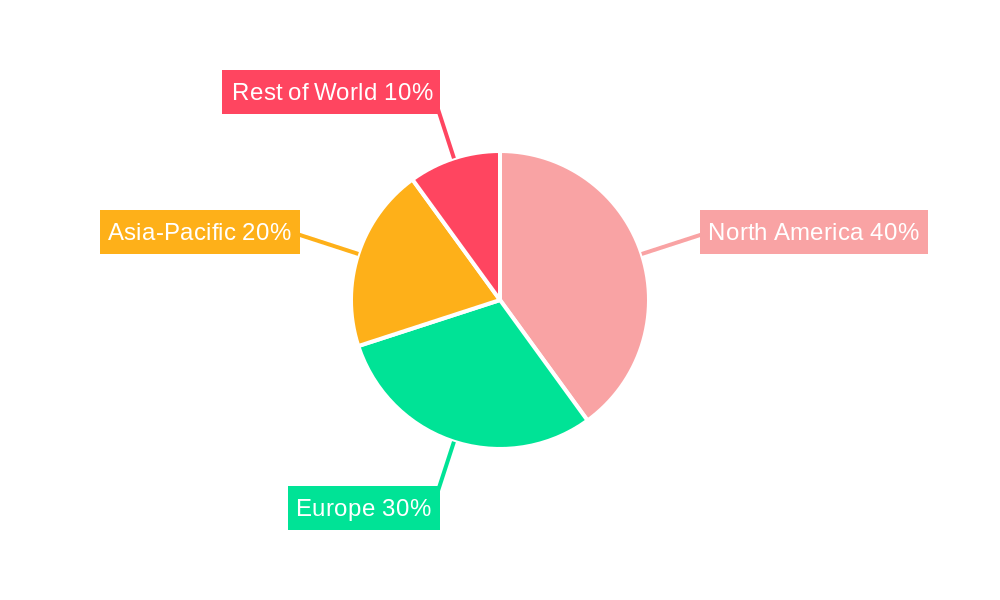
The geographic distribution of the market shows significant regional variations, with North America and Europe currently dominating due to high coffee consumption rates and strong environmental consciousness. However, Asia-Pacific is poised for significant growth in the coming years due to rising disposable incomes and a growing middle class embracing Western coffee culture. Further market segmentation by product features (insulation levels, lids, sizes) is crucial for understanding specific consumer preferences and identifying potential niches for growth. Key market trends indicate an increasing demand for sustainable materials, smart technologies (temperature control, connectivity), and personalized customization options. Manufacturers are responding by incorporating innovative designs and materials, improving product durability, and focusing on enhancing the consumer experience to maintain market competitiveness. This continued innovation and focus on meeting evolving consumer needs are key drivers behind the projected sustained growth of the travel coffee mug market.
Travel Coffee Mugs Company Market Share
Travel Coffee Mugs Market Report: 2019-2033 - A Comprehensive Analysis of a Multi-Million Dollar Industry
This insightful report provides a comprehensive analysis of the global travel coffee mugs market, projecting a market value exceeding $XX million by 2033. Covering the period from 2019 to 2033, with a base year of 2025 and a forecast period spanning 2025-2033, this report is essential for stakeholders seeking to understand the current market dynamics and future growth potential. It meticulously analyzes key trends, competitive landscapes, and emerging opportunities within this dynamic sector. This study leverages extensive data analysis to provide actionable insights for informed decision-making.
Travel Coffee Mugs Market Composition & Trends
The global travel coffee mug market, valued at $XX million in 2025, displays a moderately fragmented landscape. Key players like MiiR, KeepCup, Fellow, Zojirushi, Yeti, Hydro Flask, Kinto, Frank Green, Firebelly, Camelbak, Purist, Contigo, Stanley, Brumate, Oxo, Nespresso, Argos, Harris Scarfe, Salt&Pepper, and Thermos compete fiercely, resulting in a dynamic market share distribution. While precise market share figures for each company require further detailed analysis, the market is characterized by a mix of established brands and emerging players.
Market Concentration: The market is moderately concentrated, with the top five players holding approximately XX% of the market share in 2025. This concentration is expected to shift slightly by 2033, with new entrants and strategic alliances influencing the landscape.
Innovation Catalysts: Growing consumer demand for sustainable and eco-friendly products, coupled with technological advancements in insulation and material science, are driving innovation.
Regulatory Landscape: Regulations surrounding single-use plastics are creating a favorable environment for reusable travel coffee mugs. Specific regional regulations vary and need to be accounted for within regional market analysis.
Substitute Products: While reusable water bottles and thermoses provide some competition, the convenience and specific design features of travel coffee mugs maintain their market dominance.
End-User Profiles: The primary end-users are professionals, students, commuters, and outdoor enthusiasts who value convenience and portability.
M&A Activities: The historical period (2019-2024) saw a limited number of significant M&A activities in the travel coffee mug market. The total value of these deals is estimated at $XX million. A rise in this value is expected during the forecast period fueled by strategic acquisitions.
Travel Coffee Mugs Industry Evolution
The travel coffee mug market has witnessed a consistent growth trajectory from 2019 to 2024, with a Compound Annual Growth Rate (CAGR) of XX%. This growth is primarily driven by increasing consumer awareness of environmental sustainability and a preference for convenient, on-the-go coffee consumption. Technological advancements, such as improved insulation technology, the introduction of self-heating mugs, and the development of durable, lightweight materials have further fueled market expansion. Changing consumer preferences towards premiumization and personalization are also significant factors, with consumers increasingly seeking travel mugs that reflect their individual style and preferences. This trend is further highlighted by the increasing popularity of customized or limited-edition travel mug designs. The projected CAGR for 2025-2033 is estimated at XX%, indicating continued strong growth in this market. Adoption rates of sustainable and technologically advanced mugs are expected to increase significantly, boosting overall market expansion. The increasing integration of smart technology, such as temperature control and connectivity features, will also impact market trends.
Leading Regions, Countries, or Segments in Travel Coffee Mugs
The North American region maintains its position as the leading market for travel coffee mugs, driven by high disposable incomes and a strong preference for coffee culture.
Key Drivers in North America:
- High coffee consumption rates.
- Strong environmental consciousness among consumers.
- Significant investments in product innovation and marketing.
- Favorable regulatory environment supporting reusable products.
The dominance of North America can be attributed to several factors, including a strong café culture, high disposable income levels, a focus on convenience and on-the-go lifestyles, and increasing environmental awareness. The region's established supply chains and robust consumer demand have also created a fertile ground for market growth. In contrast, other regions show slower growth due to varying consumer purchasing power and coffee consumption habits.
Travel Coffee Mugs Product Innovations
Recent product innovations focus on enhanced insulation, durability, and ergonomic design. Features like leak-proof lids, vacuum insulation for temperature retention, and innovative materials like sustainable bamboo or recycled plastics are driving sales. Smart features like integrated temperature displays are also emerging in premium segments, further differentiating offerings and appealing to tech-savvy consumers. These innovations contribute to improved customer experience, prompting higher purchase intent and customer retention.
Propelling Factors for Travel Coffee Mugs Growth
Several factors are driving the growth of the travel coffee mug market. Firstly, the increasing awareness of environmental sustainability is prompting consumers to opt for reusable alternatives to disposable cups. Secondly, rising disposable incomes, particularly in developing economies, increase demand for convenient and high-quality products. Thirdly, technological advancements in insulation and materials offer enhanced user experience and drive purchase intent.
Obstacles in the Travel Coffee Mugs Market
The primary obstacles are fluctuating raw material prices impacting production costs and potential supply chain disruptions. Furthermore, intense competition and the emergence of substitute products present challenges for market share retention. Finally, stringent quality and safety regulations in various regions necessitate compliance measures, impacting operational costs.
Future Opportunities in Travel Coffee Mugs
Emerging opportunities lie in expanding into new markets with growing coffee cultures, particularly in Asia and Africa. Further technological advancements, such as self-cleaning mechanisms and improved integration with smart devices, offer significant potential for innovation. Furthermore, customization and personalization options are expected to drive sales growth and increase customer engagement.
Major Players in the Travel Coffee Mugs Ecosystem
- MiiR
- KeepCup
- Fellow
- Zojirushi
- Yeti
- Hydro Flask
- Kinto
- Frank Green
- Firebelly
- Camelbak
- Purist
- Contigo
- Stanley
- Brumate
- Oxo
- Nespresso
- Argos
- Harris Scarfe
- Salt&Pepper
- Thermos
Key Developments in Travel Coffee Mugs Industry
- 2022 Q3: MiiR launched a new line of sustainable travel mugs made from recycled materials.
- 2023 Q1: Yeti introduced a smart travel mug with temperature control features.
- 2024 Q2: A strategic alliance formed between KeepCup and a major coffee chain, resulting in co-branded travel mugs. (Further details regarding specific alliances and product launches will be added during the completion of the report)
Strategic Travel Coffee Mugs Market Forecast
The travel coffee mug market is poised for continued growth, driven by increasing demand for eco-friendly products and technological advancements. The predicted CAGR of XX% from 2025-2033 points towards a substantial market expansion, with significant opportunities for both established and emerging players. Innovation in materials, design, and functionality will remain key to success. Specific regional growth trajectories and market penetration strategies will require further individual assessment.
Travel Coffee Mugs Segmentation
-
1. Application
- 1.1. Hot Coffee
- 1.2. Cold Coffee
-
2. Types
- 2.1. Stainless Steel
- 2.2. Ceramics
- 2.3. Other
Travel Coffee Mugs Segmentation By Geography
-
1. North America
- 1.1. United States
- 1.2. Canada
- 1.3. Mexico
-
2. South America
- 2.1. Brazil
- 2.2. Argentina
- 2.3. Rest of South America
-
3. Europe
- 3.1. United Kingdom
- 3.2. Germany
- 3.3. France
- 3.4. Italy
- 3.5. Spain
- 3.6. Russia
- 3.7. Benelux
- 3.8. Nordics
- 3.9. Rest of Europe
-
4. Middle East & Africa
- 4.1. Turkey
- 4.2. Israel
- 4.3. GCC
- 4.4. North Africa
- 4.5. South Africa
- 4.6. Rest of Middle East & Africa
-
5. Asia Pacific
- 5.1. China
- 5.2. India
- 5.3. Japan
- 5.4. South Korea
- 5.5. ASEAN
- 5.6. Oceania
- 5.7. Rest of Asia Pacific
Travel Coffee Mugs Regional Market Share
Geographic Coverage of Travel Coffee Mugs
Travel Coffee Mugs REPORT HIGHLIGHTS
| Aspects | Details |
|---|---|
| Study Period | 2020-2034 |
| Base Year | 2025 |
| Estimated Year | 2026 |
| Forecast Period | 2026-2034 |
| Historical Period | 2020-2025 |
| Growth Rate | CAGR of 7.2% from 2020-2034 |
| Segmentation |
|
Table of Contents
- 1. Introduction
- 1.1. Research Scope
- 1.2. Market Segmentation
- 1.3. Research Methodology
- 1.4. Definitions and Assumptions
- 2. Executive Summary
- 2.1. Introduction
- 3. Market Dynamics
- 3.1. Introduction
- 3.2. Market Drivers
- 3.3. Market Restrains
- 3.4. Market Trends
- 4. Market Factor Analysis
- 4.1. Porters Five Forces
- 4.2. Supply/Value Chain
- 4.3. PESTEL analysis
- 4.4. Market Entropy
- 4.5. Patent/Trademark Analysis
- 5. Global Travel Coffee Mugs Analysis, Insights and Forecast, 2020-2032
- 5.1. Market Analysis, Insights and Forecast - by Application
- 5.1.1. Hot Coffee
- 5.1.2. Cold Coffee
- 5.2. Market Analysis, Insights and Forecast - by Types
- 5.2.1. Stainless Steel
- 5.2.2. Ceramics
- 5.2.3. Other
- 5.3. Market Analysis, Insights and Forecast - by Region
- 5.3.1. North America
- 5.3.2. South America
- 5.3.3. Europe
- 5.3.4. Middle East & Africa
- 5.3.5. Asia Pacific
- 5.1. Market Analysis, Insights and Forecast - by Application
- 6. North America Travel Coffee Mugs Analysis, Insights and Forecast, 2020-2032
- 6.1. Market Analysis, Insights and Forecast - by Application
- 6.1.1. Hot Coffee
- 6.1.2. Cold Coffee
- 6.2. Market Analysis, Insights and Forecast - by Types
- 6.2.1. Stainless Steel
- 6.2.2. Ceramics
- 6.2.3. Other
- 6.1. Market Analysis, Insights and Forecast - by Application
- 7. South America Travel Coffee Mugs Analysis, Insights and Forecast, 2020-2032
- 7.1. Market Analysis, Insights and Forecast - by Application
- 7.1.1. Hot Coffee
- 7.1.2. Cold Coffee
- 7.2. Market Analysis, Insights and Forecast - by Types
- 7.2.1. Stainless Steel
- 7.2.2. Ceramics
- 7.2.3. Other
- 7.1. Market Analysis, Insights and Forecast - by Application
- 8. Europe Travel Coffee Mugs Analysis, Insights and Forecast, 2020-2032
- 8.1. Market Analysis, Insights and Forecast - by Application
- 8.1.1. Hot Coffee
- 8.1.2. Cold Coffee
- 8.2. Market Analysis, Insights and Forecast - by Types
- 8.2.1. Stainless Steel
- 8.2.2. Ceramics
- 8.2.3. Other
- 8.1. Market Analysis, Insights and Forecast - by Application
- 9. Middle East & Africa Travel Coffee Mugs Analysis, Insights and Forecast, 2020-2032
- 9.1. Market Analysis, Insights and Forecast - by Application
- 9.1.1. Hot Coffee
- 9.1.2. Cold Coffee
- 9.2. Market Analysis, Insights and Forecast - by Types
- 9.2.1. Stainless Steel
- 9.2.2. Ceramics
- 9.2.3. Other
- 9.1. Market Analysis, Insights and Forecast - by Application
- 10. Asia Pacific Travel Coffee Mugs Analysis, Insights and Forecast, 2020-2032
- 10.1. Market Analysis, Insights and Forecast - by Application
- 10.1.1. Hot Coffee
- 10.1.2. Cold Coffee
- 10.2. Market Analysis, Insights and Forecast - by Types
- 10.2.1. Stainless Steel
- 10.2.2. Ceramics
- 10.2.3. Other
- 10.1. Market Analysis, Insights and Forecast - by Application
- 11. Competitive Analysis
- 11.1. Global Market Share Analysis 2025
- 11.2. Company Profiles
- 11.2.1 MiiR
- 11.2.1.1. Overview
- 11.2.1.2. Products
- 11.2.1.3. SWOT Analysis
- 11.2.1.4. Recent Developments
- 11.2.1.5. Financials (Based on Availability)
- 11.2.2 KeepCup
- 11.2.2.1. Overview
- 11.2.2.2. Products
- 11.2.2.3. SWOT Analysis
- 11.2.2.4. Recent Developments
- 11.2.2.5. Financials (Based on Availability)
- 11.2.3 Fellow
- 11.2.3.1. Overview
- 11.2.3.2. Products
- 11.2.3.3. SWOT Analysis
- 11.2.3.4. Recent Developments
- 11.2.3.5. Financials (Based on Availability)
- 11.2.4 Zojirushi
- 11.2.4.1. Overview
- 11.2.4.2. Products
- 11.2.4.3. SWOT Analysis
- 11.2.4.4. Recent Developments
- 11.2.4.5. Financials (Based on Availability)
- 11.2.5 Yeti
- 11.2.5.1. Overview
- 11.2.5.2. Products
- 11.2.5.3. SWOT Analysis
- 11.2.5.4. Recent Developments
- 11.2.5.5. Financials (Based on Availability)
- 11.2.6 Hydro Flask
- 11.2.6.1. Overview
- 11.2.6.2. Products
- 11.2.6.3. SWOT Analysis
- 11.2.6.4. Recent Developments
- 11.2.6.5. Financials (Based on Availability)
- 11.2.7 Kinto
- 11.2.7.1. Overview
- 11.2.7.2. Products
- 11.2.7.3. SWOT Analysis
- 11.2.7.4. Recent Developments
- 11.2.7.5. Financials (Based on Availability)
- 11.2.8 Frank Green
- 11.2.8.1. Overview
- 11.2.8.2. Products
- 11.2.8.3. SWOT Analysis
- 11.2.8.4. Recent Developments
- 11.2.8.5. Financials (Based on Availability)
- 11.2.9 Firebelly
- 11.2.9.1. Overview
- 11.2.9.2. Products
- 11.2.9.3. SWOT Analysis
- 11.2.9.4. Recent Developments
- 11.2.9.5. Financials (Based on Availability)
- 11.2.10 Camelbak
- 11.2.10.1. Overview
- 11.2.10.2. Products
- 11.2.10.3. SWOT Analysis
- 11.2.10.4. Recent Developments
- 11.2.10.5. Financials (Based on Availability)
- 11.2.11 Purist
- 11.2.11.1. Overview
- 11.2.11.2. Products
- 11.2.11.3. SWOT Analysis
- 11.2.11.4. Recent Developments
- 11.2.11.5. Financials (Based on Availability)
- 11.2.12 Contigo
- 11.2.12.1. Overview
- 11.2.12.2. Products
- 11.2.12.3. SWOT Analysis
- 11.2.12.4. Recent Developments
- 11.2.12.5. Financials (Based on Availability)
- 11.2.13 Stanley
- 11.2.13.1. Overview
- 11.2.13.2. Products
- 11.2.13.3. SWOT Analysis
- 11.2.13.4. Recent Developments
- 11.2.13.5. Financials (Based on Availability)
- 11.2.14 Brumate
- 11.2.14.1. Overview
- 11.2.14.2. Products
- 11.2.14.3. SWOT Analysis
- 11.2.14.4. Recent Developments
- 11.2.14.5. Financials (Based on Availability)
- 11.2.15 Oxo
- 11.2.15.1. Overview
- 11.2.15.2. Products
- 11.2.15.3. SWOT Analysis
- 11.2.15.4. Recent Developments
- 11.2.15.5. Financials (Based on Availability)
- 11.2.16 Nespresso
- 11.2.16.1. Overview
- 11.2.16.2. Products
- 11.2.16.3. SWOT Analysis
- 11.2.16.4. Recent Developments
- 11.2.16.5. Financials (Based on Availability)
- 11.2.17 Argos
- 11.2.17.1. Overview
- 11.2.17.2. Products
- 11.2.17.3. SWOT Analysis
- 11.2.17.4. Recent Developments
- 11.2.17.5. Financials (Based on Availability)
- 11.2.18 Harris Scarfe
- 11.2.18.1. Overview
- 11.2.18.2. Products
- 11.2.18.3. SWOT Analysis
- 11.2.18.4. Recent Developments
- 11.2.18.5. Financials (Based on Availability)
- 11.2.19 Salt&Pepper
- 11.2.19.1. Overview
- 11.2.19.2. Products
- 11.2.19.3. SWOT Analysis
- 11.2.19.4. Recent Developments
- 11.2.19.5. Financials (Based on Availability)
- 11.2.20 Thermos
- 11.2.20.1. Overview
- 11.2.20.2. Products
- 11.2.20.3. SWOT Analysis
- 11.2.20.4. Recent Developments
- 11.2.20.5. Financials (Based on Availability)
- 11.2.1 MiiR
List of Figures
- Figure 1: Global Travel Coffee Mugs Revenue Breakdown (undefined, %) by Region 2025 & 2033
- Figure 2: Global Travel Coffee Mugs Volume Breakdown (K, %) by Region 2025 & 2033
- Figure 3: North America Travel Coffee Mugs Revenue (undefined), by Application 2025 & 2033
- Figure 4: North America Travel Coffee Mugs Volume (K), by Application 2025 & 2033
- Figure 5: North America Travel Coffee Mugs Revenue Share (%), by Application 2025 & 2033
- Figure 6: North America Travel Coffee Mugs Volume Share (%), by Application 2025 & 2033
- Figure 7: North America Travel Coffee Mugs Revenue (undefined), by Types 2025 & 2033
- Figure 8: North America Travel Coffee Mugs Volume (K), by Types 2025 & 2033
- Figure 9: North America Travel Coffee Mugs Revenue Share (%), by Types 2025 & 2033
- Figure 10: North America Travel Coffee Mugs Volume Share (%), by Types 2025 & 2033
- Figure 11: North America Travel Coffee Mugs Revenue (undefined), by Country 2025 & 2033
- Figure 12: North America Travel Coffee Mugs Volume (K), by Country 2025 & 2033
- Figure 13: North America Travel Coffee Mugs Revenue Share (%), by Country 2025 & 2033
- Figure 14: North America Travel Coffee Mugs Volume Share (%), by Country 2025 & 2033
- Figure 15: South America Travel Coffee Mugs Revenue (undefined), by Application 2025 & 2033
- Figure 16: South America Travel Coffee Mugs Volume (K), by Application 2025 & 2033
- Figure 17: South America Travel Coffee Mugs Revenue Share (%), by Application 2025 & 2033
- Figure 18: South America Travel Coffee Mugs Volume Share (%), by Application 2025 & 2033
- Figure 19: South America Travel Coffee Mugs Revenue (undefined), by Types 2025 & 2033
- Figure 20: South America Travel Coffee Mugs Volume (K), by Types 2025 & 2033
- Figure 21: South America Travel Coffee Mugs Revenue Share (%), by Types 2025 & 2033
- Figure 22: South America Travel Coffee Mugs Volume Share (%), by Types 2025 & 2033
- Figure 23: South America Travel Coffee Mugs Revenue (undefined), by Country 2025 & 2033
- Figure 24: South America Travel Coffee Mugs Volume (K), by Country 2025 & 2033
- Figure 25: South America Travel Coffee Mugs Revenue Share (%), by Country 2025 & 2033
- Figure 26: South America Travel Coffee Mugs Volume Share (%), by Country 2025 & 2033
- Figure 27: Europe Travel Coffee Mugs Revenue (undefined), by Application 2025 & 2033
- Figure 28: Europe Travel Coffee Mugs Volume (K), by Application 2025 & 2033
- Figure 29: Europe Travel Coffee Mugs Revenue Share (%), by Application 2025 & 2033
- Figure 30: Europe Travel Coffee Mugs Volume Share (%), by Application 2025 & 2033
- Figure 31: Europe Travel Coffee Mugs Revenue (undefined), by Types 2025 & 2033
- Figure 32: Europe Travel Coffee Mugs Volume (K), by Types 2025 & 2033
- Figure 33: Europe Travel Coffee Mugs Revenue Share (%), by Types 2025 & 2033
- Figure 34: Europe Travel Coffee Mugs Volume Share (%), by Types 2025 & 2033
- Figure 35: Europe Travel Coffee Mugs Revenue (undefined), by Country 2025 & 2033
- Figure 36: Europe Travel Coffee Mugs Volume (K), by Country 2025 & 2033
- Figure 37: Europe Travel Coffee Mugs Revenue Share (%), by Country 2025 & 2033
- Figure 38: Europe Travel Coffee Mugs Volume Share (%), by Country 2025 & 2033
- Figure 39: Middle East & Africa Travel Coffee Mugs Revenue (undefined), by Application 2025 & 2033
- Figure 40: Middle East & Africa Travel Coffee Mugs Volume (K), by Application 2025 & 2033
- Figure 41: Middle East & Africa Travel Coffee Mugs Revenue Share (%), by Application 2025 & 2033
- Figure 42: Middle East & Africa Travel Coffee Mugs Volume Share (%), by Application 2025 & 2033
- Figure 43: Middle East & Africa Travel Coffee Mugs Revenue (undefined), by Types 2025 & 2033
- Figure 44: Middle East & Africa Travel Coffee Mugs Volume (K), by Types 2025 & 2033
- Figure 45: Middle East & Africa Travel Coffee Mugs Revenue Share (%), by Types 2025 & 2033
- Figure 46: Middle East & Africa Travel Coffee Mugs Volume Share (%), by Types 2025 & 2033
- Figure 47: Middle East & Africa Travel Coffee Mugs Revenue (undefined), by Country 2025 & 2033
- Figure 48: Middle East & Africa Travel Coffee Mugs Volume (K), by Country 2025 & 2033
- Figure 49: Middle East & Africa Travel Coffee Mugs Revenue Share (%), by Country 2025 & 2033
- Figure 50: Middle East & Africa Travel Coffee Mugs Volume Share (%), by Country 2025 & 2033
- Figure 51: Asia Pacific Travel Coffee Mugs Revenue (undefined), by Application 2025 & 2033
- Figure 52: Asia Pacific Travel Coffee Mugs Volume (K), by Application 2025 & 2033
- Figure 53: Asia Pacific Travel Coffee Mugs Revenue Share (%), by Application 2025 & 2033
- Figure 54: Asia Pacific Travel Coffee Mugs Volume Share (%), by Application 2025 & 2033
- Figure 55: Asia Pacific Travel Coffee Mugs Revenue (undefined), by Types 2025 & 2033
- Figure 56: Asia Pacific Travel Coffee Mugs Volume (K), by Types 2025 & 2033
- Figure 57: Asia Pacific Travel Coffee Mugs Revenue Share (%), by Types 2025 & 2033
- Figure 58: Asia Pacific Travel Coffee Mugs Volume Share (%), by Types 2025 & 2033
- Figure 59: Asia Pacific Travel Coffee Mugs Revenue (undefined), by Country 2025 & 2033
- Figure 60: Asia Pacific Travel Coffee Mugs Volume (K), by Country 2025 & 2033
- Figure 61: Asia Pacific Travel Coffee Mugs Revenue Share (%), by Country 2025 & 2033
- Figure 62: Asia Pacific Travel Coffee Mugs Volume Share (%), by Country 2025 & 2033
List of Tables
- Table 1: Global Travel Coffee Mugs Revenue undefined Forecast, by Application 2020 & 2033
- Table 2: Global Travel Coffee Mugs Volume K Forecast, by Application 2020 & 2033
- Table 3: Global Travel Coffee Mugs Revenue undefined Forecast, by Types 2020 & 2033
- Table 4: Global Travel Coffee Mugs Volume K Forecast, by Types 2020 & 2033
- Table 5: Global Travel Coffee Mugs Revenue undefined Forecast, by Region 2020 & 2033
- Table 6: Global Travel Coffee Mugs Volume K Forecast, by Region 2020 & 2033
- Table 7: Global Travel Coffee Mugs Revenue undefined Forecast, by Application 2020 & 2033
- Table 8: Global Travel Coffee Mugs Volume K Forecast, by Application 2020 & 2033
- Table 9: Global Travel Coffee Mugs Revenue undefined Forecast, by Types 2020 & 2033
- Table 10: Global Travel Coffee Mugs Volume K Forecast, by Types 2020 & 2033
- Table 11: Global Travel Coffee Mugs Revenue undefined Forecast, by Country 2020 & 2033
- Table 12: Global Travel Coffee Mugs Volume K Forecast, by Country 2020 & 2033
- Table 13: United States Travel Coffee Mugs Revenue (undefined) Forecast, by Application 2020 & 2033
- Table 14: United States Travel Coffee Mugs Volume (K) Forecast, by Application 2020 & 2033
- Table 15: Canada Travel Coffee Mugs Revenue (undefined) Forecast, by Application 2020 & 2033
- Table 16: Canada Travel Coffee Mugs Volume (K) Forecast, by Application 2020 & 2033
- Table 17: Mexico Travel Coffee Mugs Revenue (undefined) Forecast, by Application 2020 & 2033
- Table 18: Mexico Travel Coffee Mugs Volume (K) Forecast, by Application 2020 & 2033
- Table 19: Global Travel Coffee Mugs Revenue undefined Forecast, by Application 2020 & 2033
- Table 20: Global Travel Coffee Mugs Volume K Forecast, by Application 2020 & 2033
- Table 21: Global Travel Coffee Mugs Revenue undefined Forecast, by Types 2020 & 2033
- Table 22: Global Travel Coffee Mugs Volume K Forecast, by Types 2020 & 2033
- Table 23: Global Travel Coffee Mugs Revenue undefined Forecast, by Country 2020 & 2033
- Table 24: Global Travel Coffee Mugs Volume K Forecast, by Country 2020 & 2033
- Table 25: Brazil Travel Coffee Mugs Revenue (undefined) Forecast, by Application 2020 & 2033
- Table 26: Brazil Travel Coffee Mugs Volume (K) Forecast, by Application 2020 & 2033
- Table 27: Argentina Travel Coffee Mugs Revenue (undefined) Forecast, by Application 2020 & 2033
- Table 28: Argentina Travel Coffee Mugs Volume (K) Forecast, by Application 2020 & 2033
- Table 29: Rest of South America Travel Coffee Mugs Revenue (undefined) Forecast, by Application 2020 & 2033
- Table 30: Rest of South America Travel Coffee Mugs Volume (K) Forecast, by Application 2020 & 2033
- Table 31: Global Travel Coffee Mugs Revenue undefined Forecast, by Application 2020 & 2033
- Table 32: Global Travel Coffee Mugs Volume K Forecast, by Application 2020 & 2033
- Table 33: Global Travel Coffee Mugs Revenue undefined Forecast, by Types 2020 & 2033
- Table 34: Global Travel Coffee Mugs Volume K Forecast, by Types 2020 & 2033
- Table 35: Global Travel Coffee Mugs Revenue undefined Forecast, by Country 2020 & 2033
- Table 36: Global Travel Coffee Mugs Volume K Forecast, by Country 2020 & 2033
- Table 37: United Kingdom Travel Coffee Mugs Revenue (undefined) Forecast, by Application 2020 & 2033
- Table 38: United Kingdom Travel Coffee Mugs Volume (K) Forecast, by Application 2020 & 2033
- Table 39: Germany Travel Coffee Mugs Revenue (undefined) Forecast, by Application 2020 & 2033
- Table 40: Germany Travel Coffee Mugs Volume (K) Forecast, by Application 2020 & 2033
- Table 41: France Travel Coffee Mugs Revenue (undefined) Forecast, by Application 2020 & 2033
- Table 42: France Travel Coffee Mugs Volume (K) Forecast, by Application 2020 & 2033
- Table 43: Italy Travel Coffee Mugs Revenue (undefined) Forecast, by Application 2020 & 2033
- Table 44: Italy Travel Coffee Mugs Volume (K) Forecast, by Application 2020 & 2033
- Table 45: Spain Travel Coffee Mugs Revenue (undefined) Forecast, by Application 2020 & 2033
- Table 46: Spain Travel Coffee Mugs Volume (K) Forecast, by Application 2020 & 2033
- Table 47: Russia Travel Coffee Mugs Revenue (undefined) Forecast, by Application 2020 & 2033
- Table 48: Russia Travel Coffee Mugs Volume (K) Forecast, by Application 2020 & 2033
- Table 49: Benelux Travel Coffee Mugs Revenue (undefined) Forecast, by Application 2020 & 2033
- Table 50: Benelux Travel Coffee Mugs Volume (K) Forecast, by Application 2020 & 2033
- Table 51: Nordics Travel Coffee Mugs Revenue (undefined) Forecast, by Application 2020 & 2033
- Table 52: Nordics Travel Coffee Mugs Volume (K) Forecast, by Application 2020 & 2033
- Table 53: Rest of Europe Travel Coffee Mugs Revenue (undefined) Forecast, by Application 2020 & 2033
- Table 54: Rest of Europe Travel Coffee Mugs Volume (K) Forecast, by Application 2020 & 2033
- Table 55: Global Travel Coffee Mugs Revenue undefined Forecast, by Application 2020 & 2033
- Table 56: Global Travel Coffee Mugs Volume K Forecast, by Application 2020 & 2033
- Table 57: Global Travel Coffee Mugs Revenue undefined Forecast, by Types 2020 & 2033
- Table 58: Global Travel Coffee Mugs Volume K Forecast, by Types 2020 & 2033
- Table 59: Global Travel Coffee Mugs Revenue undefined Forecast, by Country 2020 & 2033
- Table 60: Global Travel Coffee Mugs Volume K Forecast, by Country 2020 & 2033
- Table 61: Turkey Travel Coffee Mugs Revenue (undefined) Forecast, by Application 2020 & 2033
- Table 62: Turkey Travel Coffee Mugs Volume (K) Forecast, by Application 2020 & 2033
- Table 63: Israel Travel Coffee Mugs Revenue (undefined) Forecast, by Application 2020 & 2033
- Table 64: Israel Travel Coffee Mugs Volume (K) Forecast, by Application 2020 & 2033
- Table 65: GCC Travel Coffee Mugs Revenue (undefined) Forecast, by Application 2020 & 2033
- Table 66: GCC Travel Coffee Mugs Volume (K) Forecast, by Application 2020 & 2033
- Table 67: North Africa Travel Coffee Mugs Revenue (undefined) Forecast, by Application 2020 & 2033
- Table 68: North Africa Travel Coffee Mugs Volume (K) Forecast, by Application 2020 & 2033
- Table 69: South Africa Travel Coffee Mugs Revenue (undefined) Forecast, by Application 2020 & 2033
- Table 70: South Africa Travel Coffee Mugs Volume (K) Forecast, by Application 2020 & 2033
- Table 71: Rest of Middle East & Africa Travel Coffee Mugs Revenue (undefined) Forecast, by Application 2020 & 2033
- Table 72: Rest of Middle East & Africa Travel Coffee Mugs Volume (K) Forecast, by Application 2020 & 2033
- Table 73: Global Travel Coffee Mugs Revenue undefined Forecast, by Application 2020 & 2033
- Table 74: Global Travel Coffee Mugs Volume K Forecast, by Application 2020 & 2033
- Table 75: Global Travel Coffee Mugs Revenue undefined Forecast, by Types 2020 & 2033
- Table 76: Global Travel Coffee Mugs Volume K Forecast, by Types 2020 & 2033
- Table 77: Global Travel Coffee Mugs Revenue undefined Forecast, by Country 2020 & 2033
- Table 78: Global Travel Coffee Mugs Volume K Forecast, by Country 2020 & 2033
- Table 79: China Travel Coffee Mugs Revenue (undefined) Forecast, by Application 2020 & 2033
- Table 80: China Travel Coffee Mugs Volume (K) Forecast, by Application 2020 & 2033
- Table 81: India Travel Coffee Mugs Revenue (undefined) Forecast, by Application 2020 & 2033
- Table 82: India Travel Coffee Mugs Volume (K) Forecast, by Application 2020 & 2033
- Table 83: Japan Travel Coffee Mugs Revenue (undefined) Forecast, by Application 2020 & 2033
- Table 84: Japan Travel Coffee Mugs Volume (K) Forecast, by Application 2020 & 2033
- Table 85: South Korea Travel Coffee Mugs Revenue (undefined) Forecast, by Application 2020 & 2033
- Table 86: South Korea Travel Coffee Mugs Volume (K) Forecast, by Application 2020 & 2033
- Table 87: ASEAN Travel Coffee Mugs Revenue (undefined) Forecast, by Application 2020 & 2033
- Table 88: ASEAN Travel Coffee Mugs Volume (K) Forecast, by Application 2020 & 2033
- Table 89: Oceania Travel Coffee Mugs Revenue (undefined) Forecast, by Application 2020 & 2033
- Table 90: Oceania Travel Coffee Mugs Volume (K) Forecast, by Application 2020 & 2033
- Table 91: Rest of Asia Pacific Travel Coffee Mugs Revenue (undefined) Forecast, by Application 2020 & 2033
- Table 92: Rest of Asia Pacific Travel Coffee Mugs Volume (K) Forecast, by Application 2020 & 2033
Frequently Asked Questions
1. What is the projected Compound Annual Growth Rate (CAGR) of the Travel Coffee Mugs?
The projected CAGR is approximately 7.2%.
2. Which companies are prominent players in the Travel Coffee Mugs?
Key companies in the market include MiiR, KeepCup, Fellow, Zojirushi, Yeti, Hydro Flask, Kinto, Frank Green, Firebelly, Camelbak, Purist, Contigo, Stanley, Brumate, Oxo, Nespresso, Argos, Harris Scarfe, Salt&Pepper, Thermos.
3. What are the main segments of the Travel Coffee Mugs?
The market segments include Application, Types.
4. Can you provide details about the market size?
The market size is estimated to be USD XXX N/A as of 2022.
5. What are some drivers contributing to market growth?
N/A
6. What are the notable trends driving market growth?
N/A
7. Are there any restraints impacting market growth?
N/A
8. Can you provide examples of recent developments in the market?
N/A
9. What pricing options are available for accessing the report?
Pricing options include single-user, multi-user, and enterprise licenses priced at USD 3950.00, USD 5925.00, and USD 7900.00 respectively.
10. Is the market size provided in terms of value or volume?
The market size is provided in terms of value, measured in N/A and volume, measured in K.
11. Are there any specific market keywords associated with the report?
Yes, the market keyword associated with the report is "Travel Coffee Mugs," which aids in identifying and referencing the specific market segment covered.
12. How do I determine which pricing option suits my needs best?
The pricing options vary based on user requirements and access needs. Individual users may opt for single-user licenses, while businesses requiring broader access may choose multi-user or enterprise licenses for cost-effective access to the report.
13. Are there any additional resources or data provided in the Travel Coffee Mugs report?
While the report offers comprehensive insights, it's advisable to review the specific contents or supplementary materials provided to ascertain if additional resources or data are available.
14. How can I stay updated on further developments or reports in the Travel Coffee Mugs?
To stay informed about further developments, trends, and reports in the Travel Coffee Mugs, consider subscribing to industry newsletters, following relevant companies and organizations, or regularly checking reputable industry news sources and publications.
Methodology
Step 1 - Identification of Relevant Samples Size from Population Database


Step 2 - Approaches for Defining Global Market Size (Value, Volume* & Price*)

Note*: In applicable scenarios
Step 3 - Data Sources
Primary Research
- Web Analytics
- Survey Reports
- Research Institute
- Latest Research Reports
- Opinion Leaders
Secondary Research
- Annual Reports
- White Paper
- Latest Press Release
- Industry Association
- Paid Database
- Investor Presentations

Step 4 - Data Triangulation
Involves using different sources of information in order to increase the validity of a study
These sources are likely to be stakeholders in a program - participants, other researchers, program staff, other community members, and so on.
Then we put all data in single framework & apply various statistical tools to find out the dynamic on the market.
During the analysis stage, feedback from the stakeholder groups would be compared to determine areas of agreement as well as areas of divergence