

Key Insights
The global trash cans and wastebaskets market is poised for steady growth, projected to reach a substantial market size of $7,069.3 million by 2025, expanding at a Compound Annual Growth Rate (CAGR) of 4.1% through 2033. This robust expansion is fueled by an increasing global emphasis on waste management and hygiene, driven by rising urbanization, growing environmental consciousness, and stricter waste disposal regulations across both residential and commercial sectors. The demand for innovative and aesthetically pleasing waste solutions, particularly in urban construction, shopping malls, and office buildings, is a significant growth enabler. Furthermore, the proliferation of smart waste bins with features like automatic opening and odor control is contributing to market dynamism. The "Wheeled / Mobile Type" segment is expected to lead the market due to its convenience and versatility in various settings, while the "Wheel-free Type" will cater to specific space-constrained or design-focused applications. Key players like Rubbermaid, Newell Brands, and Simplehuman are actively investing in product development and expanding their distribution networks to capitalize on these burgeoning opportunities.
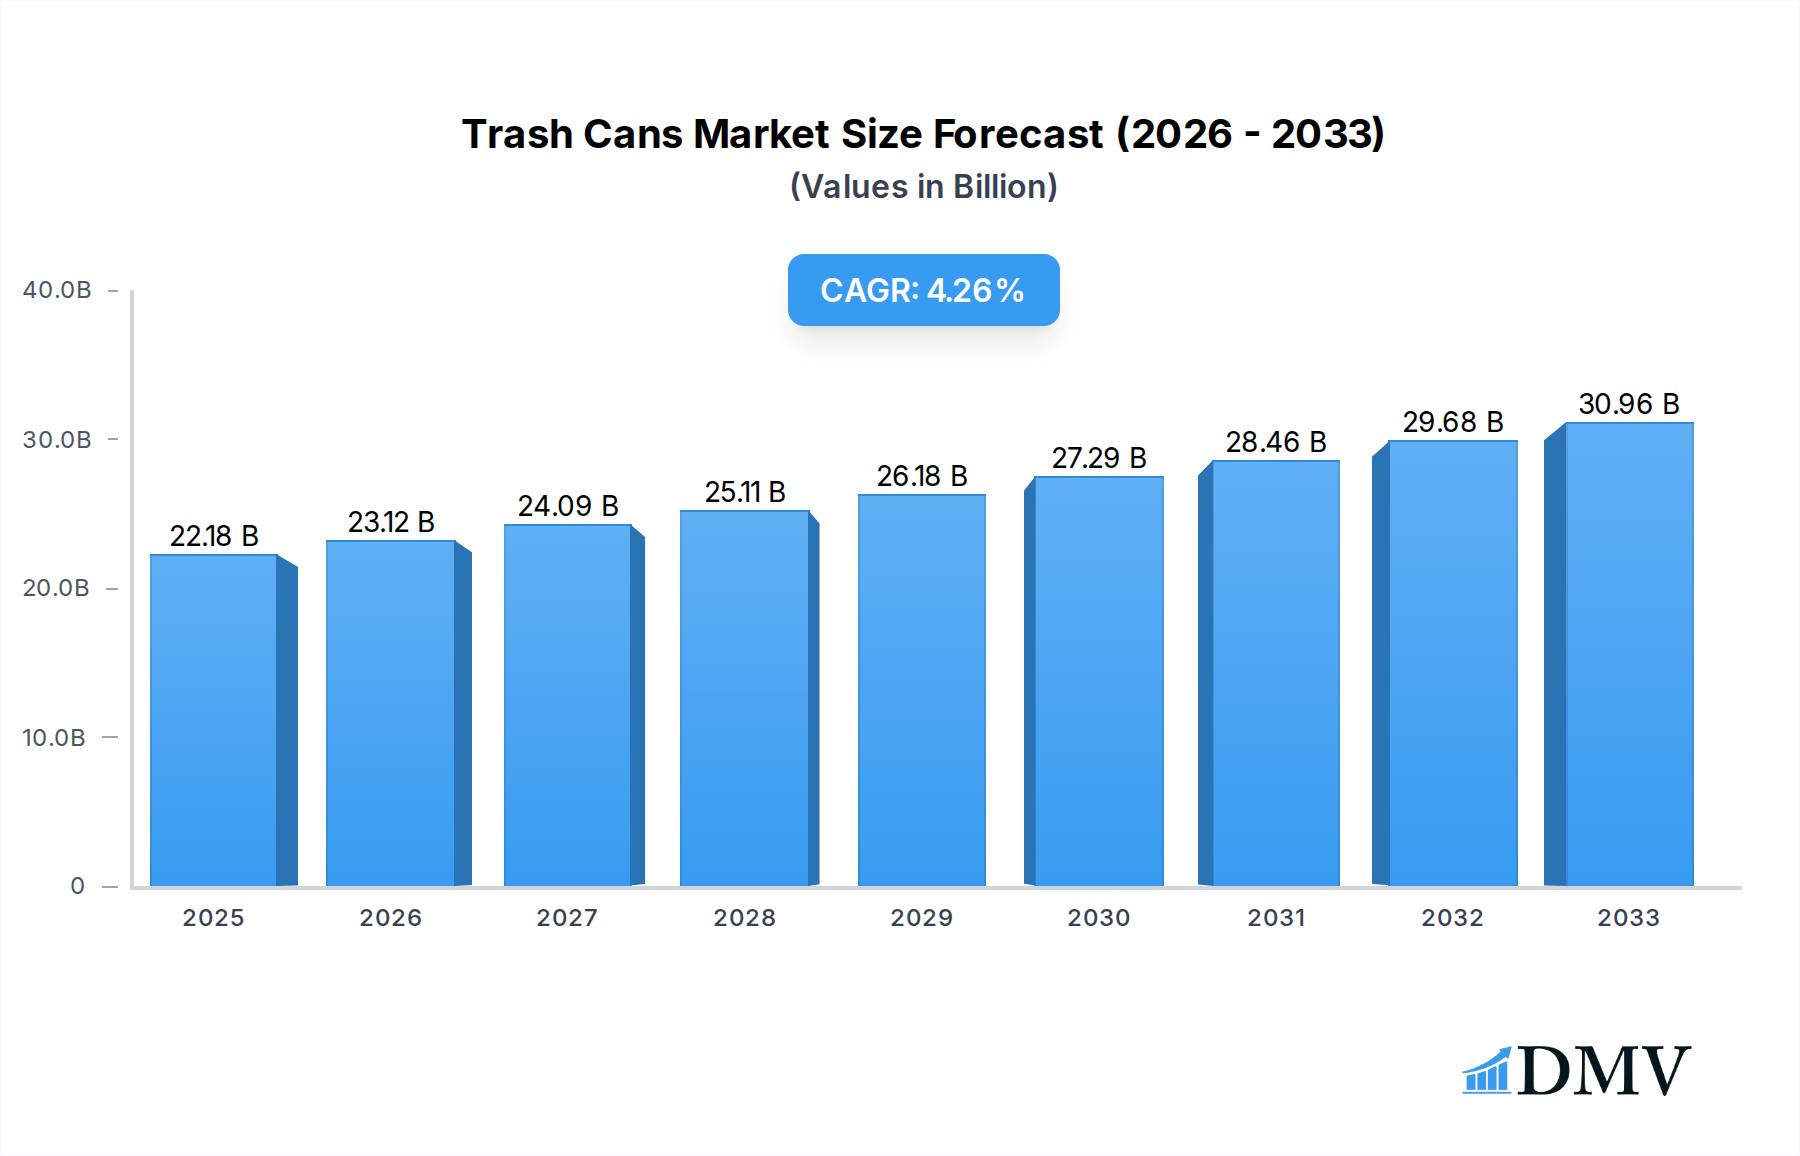
Trash Cans & Wastebaskets Market Size (In Billion)
The market's growth trajectory, however, is not without its challenges. While the overall demand is strong, factors such as the rising cost of raw materials, particularly plastics, and intense competition within the fragmented industry can exert pressure on profit margins. Nevertheless, the persistent need for efficient waste disposal solutions in diverse environments, from homes to factories, coupled with the ongoing development of eco-friendly and sustainable waste management products, will continue to propel the market forward. Emerging economies in Asia Pacific and the Middle East & Africa present significant untapped potential due to rapid industrialization and increasing disposable incomes, driving the adoption of modern waste management practices. The market's resilience is underpinned by its essential nature and the continuous adaptation of product offerings to meet evolving consumer needs and regulatory landscapes.

Trash Cans & Wastebaskets Company Market Share
Trash Cans & Wastebaskets Market Composition & Trends
The global trash cans and wastebaskets market is characterized by a moderate level of concentration, with several large players and a significant number of smaller, regional manufacturers. Key innovation catalysts include the drive for sustainable materials, smart waste management solutions, and enhanced user convenience. Regulatory landscapes, particularly concerning waste disposal and recycling, are increasingly influencing product design and material choices. Substitute products, such as industrial-scale waste management systems and reusable containers, exist but do not directly compete with the core consumer and commercial wastebasket market. End-user profiles vary significantly, from individual households seeking aesthetically pleasing and functional bins to commercial entities requiring durable and high-capacity solutions. Mergers and acquisitions (M&A) are strategic moves to expand product portfolios, gain market share, and acquire technological capabilities. For instance, significant M&A activity has been observed in the smart waste solutions segment. We project the total M&A deal value in this sector to reach approximately $500 million within the forecast period. The market share distribution is expected to see a gradual shift, with established brands maintaining significant influence, while innovative newcomers carve out niches.
Trash Cans & Wastebaskets Industry Evolution
The trash cans and wastebaskets industry has undergone a substantial evolution, driven by an escalating global emphasis on sanitation, environmental consciousness, and urban development. Over the study period of 2019–2033, the market has witnessed a consistent upward trajectory in growth, fueled by increasing population density and a growing awareness of waste management's crucial role in public health and environmental sustainability. From a historical perspective, the early years of this period (2019–2024) saw steady growth, underpinned by the fundamental demand for basic waste disposal solutions across residential, commercial, and public spaces. The base year of 2025 marks a pivotal point, with an estimated market value of $15,000 million, reflecting the cumulative expansion and the embedding of waste management as a critical urban infrastructure component.
Technological advancements have been a significant catalyst. The introduction of smart wastebaskets, equipped with sensors for fill level monitoring, odor control, and even solar-powered compacting capabilities, has begun to reshape the market, particularly in urban and commercial applications. These innovations address efficiency concerns for waste collection services and enhance user experience. Adoption metrics for these advanced solutions, while still nascent, are projected to grow at a Compound Annual Growth Rate (CAGR) of approximately 15% during the forecast period of 2025–2033.
Shifting consumer demands have also played a crucial role. Beyond mere functionality, consumers are increasingly seeking wastebaskets that are aesthetically pleasing, durable, and made from sustainable or recycled materials. This has led to a diversification of product designs, materials (from traditional plastics to stainless steel, bamboo, and recycled plastics), and features like touchless operation for improved hygiene. The restaurant and home segments, in particular, have shown a strong preference for stylish and odor-resistant options. The global market is forecast to reach an impressive $25,000 million by 2033, demonstrating robust growth driven by these multifaceted factors. The estimated market value for 2025 stands at $15,000 million, with a projected CAGR of around 6% from the base year through the forecast period.
Leading Regions, Countries, or Segments in Trash Cans & Wastebaskets
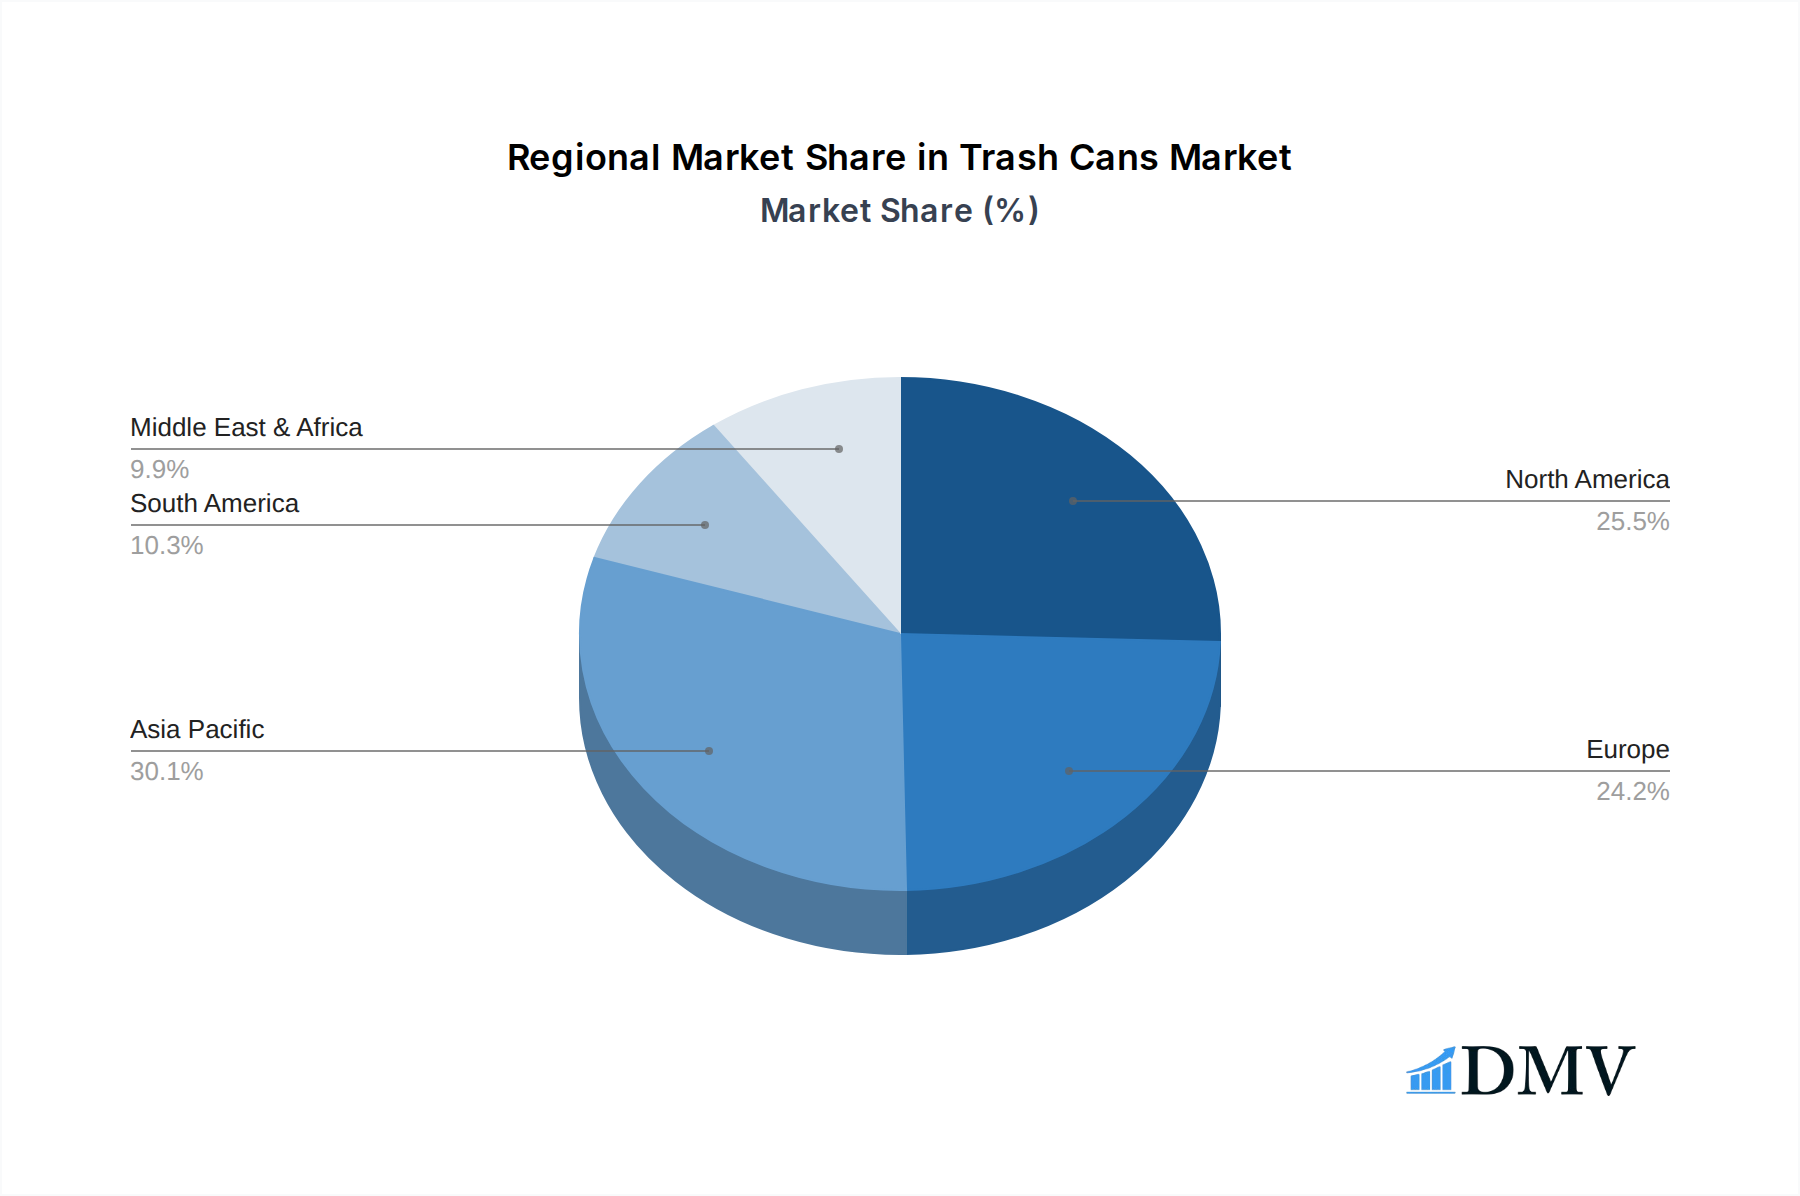
The global trash cans and wastebaskets market is characterized by distinct regional strengths and segment dominance. North America, with its high disposable incomes, strong emphasis on hygiene, and advanced waste management infrastructure, currently leads the market. The United States, in particular, is a significant contributor due to a large residential sector, extensive commercial operations, and a proactive approach to waste reduction and recycling initiatives. The urban construction and office building segments in this region are driving substantial demand for sophisticated waste and recycling solutions, including smart bins and integrated waste management systems.
In terms of application segments, the Home and Office Building sectors are demonstrably the largest contributors to overall market revenue. The home segment benefits from widespread consumer adoption of various wastebasket types, from basic kitchen bins to specialized recycling containers. The office building segment's dominance is fueled by ongoing commercial real estate development, stringent workplace hygiene standards, and the implementation of comprehensive recycling programs. Estimated to contribute approximately 30% to the global market share in 2025, the home segment's continued growth is supported by an increasing focus on home organization and aesthetic appeal in waste disposal solutions.
Looking at product types, Wheeled / Mobile Type wastebaskets hold a commanding market share, particularly within commercial, industrial, and urban construction applications. Their ease of maneuverability and larger capacity make them indispensable for efficient waste collection and transport. The estimated market share for wheeled wastebaskets is around 60% in 2025, driven by their practicality and cost-effectiveness in high-traffic areas. Regulatory support for efficient waste collection and public space cleanliness, coupled with significant investment trends in urban infrastructure development across leading regions, further solidify the dominance of these segments. For instance, government initiatives promoting curbside recycling programs directly boost the demand for wheeled bins.
Trash Cans & Wastebaskets Product Innovations
Product innovations in the trash cans and wastebaskets sector are increasingly focused on enhancing functionality, sustainability, and user experience. Key advancements include the integration of sensor technology for automatic lid opening and fill-level detection, promoting hygiene and optimizing waste collection routes. The use of antimicrobial materials and improved odor-control mechanisms addresses user concerns about sanitation. Furthermore, a significant trend is the incorporation of sustainable materials, such as recycled plastics and bio-based composites, appealing to environmentally conscious consumers and businesses. Performance metrics are being enhanced through durable construction, user-friendly designs, and energy-efficient features in smart wastebaskets.
Propelling Factors for Trash Cans & Wastebaskets Growth
Several key factors are propelling the growth of the trash cans and wastebaskets market. Growing global urbanization and population expansion directly translate to increased demand for waste management solutions across residential, commercial, and public spaces. Heightened awareness of environmental sustainability and the imperative for effective waste segregation and recycling are driving the adoption of specialized bins and smart waste technologies. Government regulations mandating improved sanitation and waste disposal practices, particularly in developing economies, further stimulate market expansion. Economic development also leads to higher disposable incomes, enabling consumers and businesses to invest in more advanced and aesthetically pleasing waste solutions.
Obstacles in the Trash Cans & Wastebaskets Market
Despite robust growth, the trash cans and wastebaskets market faces several obstacles. Fluctuations in raw material prices, particularly for plastics and metals, can impact manufacturing costs and profitability. Intense competition from both established brands and numerous smaller players leads to price pressures and challenges in achieving significant market differentiation. Emerging regulatory hurdles related to product disposal and the use of certain materials can necessitate costly product redesigns. Supply chain disruptions, as witnessed in recent global events, can also affect production timelines and inventory management, leading to potential delays in product availability and increased logistical expenses.
Future Opportunities in Trash Cans & Wastebaskets
Emerging opportunities in the trash cans and wastebaskets market are abundant, driven by technological advancements and evolving consumer preferences. The burgeoning smart waste management sector presents a significant avenue for growth, with potential for AI integration for waste analytics and optimized collection. The increasing demand for sustainable and eco-friendly products opens doors for manufacturers focusing on recycled materials and biodegradable options. Emerging markets in Asia and Africa, with their rapidly urbanizing populations and developing waste management infrastructures, offer substantial untapped potential. Furthermore, niche applications, such as specialized bins for hospitals and laboratories requiring enhanced hygiene features, represent areas for targeted product development and market penetration.
Major Players in the Trash Cans & Wastebaskets Ecosystem
- Rubbermaid
- Hefty (Reynolds Consumer Products LLC)
- Newell Brands
- Toter (Wastequip, LLC.)
- EKO
- Simplehuman
- Abfallbehaelter & Container Weber GmbH & Co. KG
- Wesco
- ALDA SA
- Craemer
- Carlisle FoodService Products
- Plastik Gogić
- Urbaniere
- Fujian Nashida Electronic Incorporated
- Sterilite
- ESE
- Straight Ltd
- Hangzhou Bosheen Household Technology
- Glasdon
- MUJI
- Busch System
- Continental Commercial Products
- ASVEL
- Hefty (Reynolds Consumer Products)
- Helesi
- CHAHUA
Key Developments in Trash Cans & Wastebaskets Industry
- 2023: Launch of advanced sensor-equipped smart waste bins by EKO, enhancing waste management efficiency in commercial spaces.
- 2023: Newell Brands acquires a specialized manufacturer of sustainable waste solutions, expanding its eco-friendly product portfolio.
- 2022: Reynolds Consumer Products LLC (Hefty) introduces a new line of recycled plastic wastebaskets, aligning with growing consumer demand for sustainable options.
- 2022: Toter (Wastequip, LLC.) expands its heavy-duty wheeled waste container offerings for municipal waste collection.
- 2021: Simplehuman unveils innovative kitchen wastebaskets with advanced odor control and touchless technology.
- 2021: Glasdon launches new public realm waste and recycling bins with improved aesthetics and functionality.
- 2020: Fujian Nashida Electronic Incorporated focuses on developing solar-powered smart waste bins for public spaces.
- 2019: Major focus on developing antimicrobial surfaces for wastebaskets in the healthcare and food service sectors.
Strategic Trash Cans & Wastebaskets Market Forecast
The strategic trash cans and wastebaskets market forecast indicates continued robust growth driven by a confluence of technological innovation, environmental consciousness, and global urbanization. The increasing adoption of smart waste management solutions, promising greater efficiency and data-driven insights, will be a significant growth catalyst. Furthermore, the persistent demand for sustainable and aesthetically pleasing products across residential and commercial segments will shape product development and market strategies. Emerging economies, with their expanding urban populations and developing infrastructure, present substantial opportunities for market penetration. Investments in innovative materials and advanced manufacturing processes will further enhance product performance and market appeal, underpinning a positive long-term market outlook.
Trash Cans & Wastebaskets Segmentation
-
1. Application
- 1.1. Home
- 1.2. Restaurant
- 1.3. Urban Construction
- 1.4. Shopping Mall
- 1.5. Office Building and Factory
- 1.6. Other
-
2. Types
- 2.1. Wheeled / Mobile Type
- 2.2. Wheel-free Type
Trash Cans & Wastebaskets Segmentation By Geography
-
1. North America
- 1.1. United States
- 1.2. Canada
- 1.3. Mexico
-
2. South America
- 2.1. Brazil
- 2.2. Argentina
- 2.3. Rest of South America
-
3. Europe
- 3.1. United Kingdom
- 3.2. Germany
- 3.3. France
- 3.4. Italy
- 3.5. Spain
- 3.6. Russia
- 3.7. Benelux
- 3.8. Nordics
- 3.9. Rest of Europe
-
4. Middle East & Africa
- 4.1. Turkey
- 4.2. Israel
- 4.3. GCC
- 4.4. North Africa
- 4.5. South Africa
- 4.6. Rest of Middle East & Africa
-
5. Asia Pacific
- 5.1. China
- 5.2. India
- 5.3. Japan
- 5.4. South Korea
- 5.5. ASEAN
- 5.6. Oceania
- 5.7. Rest of Asia Pacific
Trash Cans & Wastebaskets Regional Market Share
Geographic Coverage of Trash Cans & Wastebaskets
Trash Cans & Wastebaskets REPORT HIGHLIGHTS
| Aspects | Details |
|---|---|
| Study Period | 2020-2034 |
| Base Year | 2025 |
| Estimated Year | 2026 |
| Forecast Period | 2026-2034 |
| Historical Period | 2020-2025 |
| Growth Rate | CAGR of 4.3% from 2020-2034 |
| Segmentation |
|
Table of Contents
- 1. Introduction
- 1.1. Research Scope
- 1.2. Market Segmentation
- 1.3. Research Objective
- 1.4. Definitions and Assumptions
- 2. Executive Summary
- 2.1. Market Snapshot
- 3. Market Dynamics
- 3.1. Market Drivers
- 3.2. Market Restrains
- 3.3. Market Trends
- 3.4. Market Opportunities
- 4. Market Factor Analysis
- 4.1. Porters Five Forces
- 4.1.1. Bargaining Power of Suppliers
- 4.1.2. Bargaining Power of Buyers
- 4.1.3. Threat of New Entrants
- 4.1.4. Threat of Substitutes
- 4.1.5. Competitive Rivalry
- 4.2. PESTEL analysis
- 4.3. BCG Analysis
- 4.3.1. Stars (High Growth, High Market Share)
- 4.3.2. Cash Cows (Low Growth, High Market Share)
- 4.3.3. Question Mark (High Growth, Low Market Share)
- 4.3.4. Dogs (Low Growth, Low Market Share)
- 4.4. Ansoff Matrix Analysis
- 4.5. Supply Chain Analysis
- 4.6. Regulatory Landscape
- 4.7. Current Market Potential and Opportunity Assessment (TAM–SAM–SOM Framework)
- 4.8. DMV Analyst Note
- 4.1. Porters Five Forces
- 5. Market Analysis, Insights and Forecast 2021-2033
- 5.1. Market Analysis, Insights and Forecast - by Application
- 5.1.1. Home
- 5.1.2. Restaurant
- 5.1.3. Urban Construction
- 5.1.4. Shopping Mall
- 5.1.5. Office Building and Factory
- 5.1.6. Other
- 5.2. Market Analysis, Insights and Forecast - by Types
- 5.2.1. Wheeled / Mobile Type
- 5.2.2. Wheel-free Type
- 5.3. Market Analysis, Insights and Forecast - by Region
- 5.3.1. North America
- 5.3.2. South America
- 5.3.3. Europe
- 5.3.4. Middle East & Africa
- 5.3.5. Asia Pacific
- 5.1. Market Analysis, Insights and Forecast - by Application
- 6. Global Trash Cans & Wastebaskets Analysis, Insights and Forecast, 2021-2033
- 6.1. Market Analysis, Insights and Forecast - by Application
- 6.1.1. Home
- 6.1.2. Restaurant
- 6.1.3. Urban Construction
- 6.1.4. Shopping Mall
- 6.1.5. Office Building and Factory
- 6.1.6. Other
- 6.2. Market Analysis, Insights and Forecast - by Types
- 6.2.1. Wheeled / Mobile Type
- 6.2.2. Wheel-free Type
- 6.1. Market Analysis, Insights and Forecast - by Application
- 7. North America Trash Cans & Wastebaskets Analysis, Insights and Forecast, 2020-2032
- 7.1. Market Analysis, Insights and Forecast - by Application
- 7.1.1. Home
- 7.1.2. Restaurant
- 7.1.3. Urban Construction
- 7.1.4. Shopping Mall
- 7.1.5. Office Building and Factory
- 7.1.6. Other
- 7.2. Market Analysis, Insights and Forecast - by Types
- 7.2.1. Wheeled / Mobile Type
- 7.2.2. Wheel-free Type
- 7.1. Market Analysis, Insights and Forecast - by Application
- 8. South America Trash Cans & Wastebaskets Analysis, Insights and Forecast, 2020-2032
- 8.1. Market Analysis, Insights and Forecast - by Application
- 8.1.1. Home
- 8.1.2. Restaurant
- 8.1.3. Urban Construction
- 8.1.4. Shopping Mall
- 8.1.5. Office Building and Factory
- 8.1.6. Other
- 8.2. Market Analysis, Insights and Forecast - by Types
- 8.2.1. Wheeled / Mobile Type
- 8.2.2. Wheel-free Type
- 8.1. Market Analysis, Insights and Forecast - by Application
- 9. Europe Trash Cans & Wastebaskets Analysis, Insights and Forecast, 2020-2032
- 9.1. Market Analysis, Insights and Forecast - by Application
- 9.1.1. Home
- 9.1.2. Restaurant
- 9.1.3. Urban Construction
- 9.1.4. Shopping Mall
- 9.1.5. Office Building and Factory
- 9.1.6. Other
- 9.2. Market Analysis, Insights and Forecast - by Types
- 9.2.1. Wheeled / Mobile Type
- 9.2.2. Wheel-free Type
- 9.1. Market Analysis, Insights and Forecast - by Application
- 10. Middle East & Africa Trash Cans & Wastebaskets Analysis, Insights and Forecast, 2020-2032
- 10.1. Market Analysis, Insights and Forecast - by Application
- 10.1.1. Home
- 10.1.2. Restaurant
- 10.1.3. Urban Construction
- 10.1.4. Shopping Mall
- 10.1.5. Office Building and Factory
- 10.1.6. Other
- 10.2. Market Analysis, Insights and Forecast - by Types
- 10.2.1. Wheeled / Mobile Type
- 10.2.2. Wheel-free Type
- 10.1. Market Analysis, Insights and Forecast - by Application
- 11. Asia Pacific Trash Cans & Wastebaskets Analysis, Insights and Forecast, 2020-2032
- 11.1. Market Analysis, Insights and Forecast - by Application
- 11.1.1. Home
- 11.1.2. Restaurant
- 11.1.3. Urban Construction
- 11.1.4. Shopping Mall
- 11.1.5. Office Building and Factory
- 11.1.6. Other
- 11.2. Market Analysis, Insights and Forecast - by Types
- 11.2.1. Wheeled / Mobile Type
- 11.2.2. Wheel-free Type
- 11.1. Market Analysis, Insights and Forecast - by Application
- 12. Competitive Analysis
- 12.1. Company Profiles
- 12.1.1 Rubbermaid
- 12.1.1.1. Company Overview
- 12.1.1.2. Products
- 12.1.1.3. Company Financials
- 12.1.1.4. SWOT Analysis
- 12.1.2 Hefty (Reynolds Consumer Products LLC)
- 12.1.2.1. Company Overview
- 12.1.2.2. Products
- 12.1.2.3. Company Financials
- 12.1.2.4. SWOT Analysis
- 12.1.3 Newell Brands
- 12.1.3.1. Company Overview
- 12.1.3.2. Products
- 12.1.3.3. Company Financials
- 12.1.3.4. SWOT Analysis
- 12.1.4 Toter (Wastequip
- 12.1.4.1. Company Overview
- 12.1.4.2. Products
- 12.1.4.3. Company Financials
- 12.1.4.4. SWOT Analysis
- 12.1.5 LLC.)
- 12.1.5.1. Company Overview
- 12.1.5.2. Products
- 12.1.5.3. Company Financials
- 12.1.5.4. SWOT Analysis
- 12.1.6 EKO
- 12.1.6.1. Company Overview
- 12.1.6.2. Products
- 12.1.6.3. Company Financials
- 12.1.6.4. SWOT Analysis
- 12.1.7 Simplehuman
- 12.1.7.1. Company Overview
- 12.1.7.2. Products
- 12.1.7.3. Company Financials
- 12.1.7.4. SWOT Analysis
- 12.1.8 Abfallbehaelter & Container Weber GmbH & Co. KG
- 12.1.8.1. Company Overview
- 12.1.8.2. Products
- 12.1.8.3. Company Financials
- 12.1.8.4. SWOT Analysis
- 12.1.9 Wesco
- 12.1.9.1. Company Overview
- 12.1.9.2. Products
- 12.1.9.3. Company Financials
- 12.1.9.4. SWOT Analysis
- 12.1.10 ALDA SA
- 12.1.10.1. Company Overview
- 12.1.10.2. Products
- 12.1.10.3. Company Financials
- 12.1.10.4. SWOT Analysis
- 12.1.11 Craemer
- 12.1.11.1. Company Overview
- 12.1.11.2. Products
- 12.1.11.3. Company Financials
- 12.1.11.4. SWOT Analysis
- 12.1.12 Carlisle FoodService Products
- 12.1.12.1. Company Overview
- 12.1.12.2. Products
- 12.1.12.3. Company Financials
- 12.1.12.4. SWOT Analysis
- 12.1.13 Plastik Gogić
- 12.1.13.1. Company Overview
- 12.1.13.2. Products
- 12.1.13.3. Company Financials
- 12.1.13.4. SWOT Analysis
- 12.1.14 Urbaniere
- 12.1.14.1. Company Overview
- 12.1.14.2. Products
- 12.1.14.3. Company Financials
- 12.1.14.4. SWOT Analysis
- 12.1.15 Fujian Nashida Electronic Incorporated
- 12.1.15.1. Company Overview
- 12.1.15.2. Products
- 12.1.15.3. Company Financials
- 12.1.15.4. SWOT Analysis
- 12.1.16 Sterilite
- 12.1.16.1. Company Overview
- 12.1.16.2. Products
- 12.1.16.3. Company Financials
- 12.1.16.4. SWOT Analysis
- 12.1.17 ESE
- 12.1.17.1. Company Overview
- 12.1.17.2. Products
- 12.1.17.3. Company Financials
- 12.1.17.4. SWOT Analysis
- 12.1.18 Straight Ltd
- 12.1.18.1. Company Overview
- 12.1.18.2. Products
- 12.1.18.3. Company Financials
- 12.1.18.4. SWOT Analysis
- 12.1.19 Hangzhou Bosheen Household Technology
- 12.1.19.1. Company Overview
- 12.1.19.2. Products
- 12.1.19.3. Company Financials
- 12.1.19.4. SWOT Analysis
- 12.1.20 Glasdon
- 12.1.20.1. Company Overview
- 12.1.20.2. Products
- 12.1.20.3. Company Financials
- 12.1.20.4. SWOT Analysis
- 12.1.21 MUJI
- 12.1.21.1. Company Overview
- 12.1.21.2. Products
- 12.1.21.3. Company Financials
- 12.1.21.4. SWOT Analysis
- 12.1.22 Busch System
- 12.1.22.1. Company Overview
- 12.1.22.2. Products
- 12.1.22.3. Company Financials
- 12.1.22.4. SWOT Analysis
- 12.1.23 Continental Commercial Products
- 12.1.23.1. Company Overview
- 12.1.23.2. Products
- 12.1.23.3. Company Financials
- 12.1.23.4. SWOT Analysis
- 12.1.24 ASVEL
- 12.1.24.1. Company Overview
- 12.1.24.2. Products
- 12.1.24.3. Company Financials
- 12.1.24.4. SWOT Analysis
- 12.1.25 Hefty (Reynolds Consumer Products)
- 12.1.25.1. Company Overview
- 12.1.25.2. Products
- 12.1.25.3. Company Financials
- 12.1.25.4. SWOT Analysis
- 12.1.26 Helesi
- 12.1.26.1. Company Overview
- 12.1.26.2. Products
- 12.1.26.3. Company Financials
- 12.1.26.4. SWOT Analysis
- 12.1.27 CHAHUA
- 12.1.27.1. Company Overview
- 12.1.27.2. Products
- 12.1.27.3. Company Financials
- 12.1.27.4. SWOT Analysis
- 12.1.1 Rubbermaid
- 12.2. Market Entropy
- 12.2.1 Company's Key Areas Served
- 12.2.2 Recent Developments
- 12.3. Company Market Share Analysis 2025
- 12.3.1 Top 5 Companies Market Share Analysis
- 12.3.2 Top 3 Companies Market Share Analysis
- 12.4. List of Potential Customers
- 13. Research Methodology
List of Figures
- Figure 1: Global Trash Cans & Wastebaskets Revenue Breakdown (undefined, %) by Region 2025 & 2033
- Figure 2: North America Trash Cans & Wastebaskets Revenue (undefined), by Application 2025 & 2033
- Figure 3: North America Trash Cans & Wastebaskets Revenue Share (%), by Application 2025 & 2033
- Figure 4: North America Trash Cans & Wastebaskets Revenue (undefined), by Types 2025 & 2033
- Figure 5: North America Trash Cans & Wastebaskets Revenue Share (%), by Types 2025 & 2033
- Figure 6: North America Trash Cans & Wastebaskets Revenue (undefined), by Country 2025 & 2033
- Figure 7: North America Trash Cans & Wastebaskets Revenue Share (%), by Country 2025 & 2033
- Figure 8: South America Trash Cans & Wastebaskets Revenue (undefined), by Application 2025 & 2033
- Figure 9: South America Trash Cans & Wastebaskets Revenue Share (%), by Application 2025 & 2033
- Figure 10: South America Trash Cans & Wastebaskets Revenue (undefined), by Types 2025 & 2033
- Figure 11: South America Trash Cans & Wastebaskets Revenue Share (%), by Types 2025 & 2033
- Figure 12: South America Trash Cans & Wastebaskets Revenue (undefined), by Country 2025 & 2033
- Figure 13: South America Trash Cans & Wastebaskets Revenue Share (%), by Country 2025 & 2033
- Figure 14: Europe Trash Cans & Wastebaskets Revenue (undefined), by Application 2025 & 2033
- Figure 15: Europe Trash Cans & Wastebaskets Revenue Share (%), by Application 2025 & 2033
- Figure 16: Europe Trash Cans & Wastebaskets Revenue (undefined), by Types 2025 & 2033
- Figure 17: Europe Trash Cans & Wastebaskets Revenue Share (%), by Types 2025 & 2033
- Figure 18: Europe Trash Cans & Wastebaskets Revenue (undefined), by Country 2025 & 2033
- Figure 19: Europe Trash Cans & Wastebaskets Revenue Share (%), by Country 2025 & 2033
- Figure 20: Middle East & Africa Trash Cans & Wastebaskets Revenue (undefined), by Application 2025 & 2033
- Figure 21: Middle East & Africa Trash Cans & Wastebaskets Revenue Share (%), by Application 2025 & 2033
- Figure 22: Middle East & Africa Trash Cans & Wastebaskets Revenue (undefined), by Types 2025 & 2033
- Figure 23: Middle East & Africa Trash Cans & Wastebaskets Revenue Share (%), by Types 2025 & 2033
- Figure 24: Middle East & Africa Trash Cans & Wastebaskets Revenue (undefined), by Country 2025 & 2033
- Figure 25: Middle East & Africa Trash Cans & Wastebaskets Revenue Share (%), by Country 2025 & 2033
- Figure 26: Asia Pacific Trash Cans & Wastebaskets Revenue (undefined), by Application 2025 & 2033
- Figure 27: Asia Pacific Trash Cans & Wastebaskets Revenue Share (%), by Application 2025 & 2033
- Figure 28: Asia Pacific Trash Cans & Wastebaskets Revenue (undefined), by Types 2025 & 2033
- Figure 29: Asia Pacific Trash Cans & Wastebaskets Revenue Share (%), by Types 2025 & 2033
- Figure 30: Asia Pacific Trash Cans & Wastebaskets Revenue (undefined), by Country 2025 & 2033
- Figure 31: Asia Pacific Trash Cans & Wastebaskets Revenue Share (%), by Country 2025 & 2033
List of Tables
- Table 1: Global Trash Cans & Wastebaskets Revenue undefined Forecast, by Application 2020 & 2033
- Table 2: Global Trash Cans & Wastebaskets Revenue undefined Forecast, by Types 2020 & 2033
- Table 3: Global Trash Cans & Wastebaskets Revenue undefined Forecast, by Region 2020 & 2033
- Table 4: Global Trash Cans & Wastebaskets Revenue undefined Forecast, by Application 2020 & 2033
- Table 5: Global Trash Cans & Wastebaskets Revenue undefined Forecast, by Types 2020 & 2033
- Table 6: Global Trash Cans & Wastebaskets Revenue undefined Forecast, by Country 2020 & 2033
- Table 7: United States Trash Cans & Wastebaskets Revenue (undefined) Forecast, by Application 2020 & 2033
- Table 8: Canada Trash Cans & Wastebaskets Revenue (undefined) Forecast, by Application 2020 & 2033
- Table 9: Mexico Trash Cans & Wastebaskets Revenue (undefined) Forecast, by Application 2020 & 2033
- Table 10: Global Trash Cans & Wastebaskets Revenue undefined Forecast, by Application 2020 & 2033
- Table 11: Global Trash Cans & Wastebaskets Revenue undefined Forecast, by Types 2020 & 2033
- Table 12: Global Trash Cans & Wastebaskets Revenue undefined Forecast, by Country 2020 & 2033
- Table 13: Brazil Trash Cans & Wastebaskets Revenue (undefined) Forecast, by Application 2020 & 2033
- Table 14: Argentina Trash Cans & Wastebaskets Revenue (undefined) Forecast, by Application 2020 & 2033
- Table 15: Rest of South America Trash Cans & Wastebaskets Revenue (undefined) Forecast, by Application 2020 & 2033
- Table 16: Global Trash Cans & Wastebaskets Revenue undefined Forecast, by Application 2020 & 2033
- Table 17: Global Trash Cans & Wastebaskets Revenue undefined Forecast, by Types 2020 & 2033
- Table 18: Global Trash Cans & Wastebaskets Revenue undefined Forecast, by Country 2020 & 2033
- Table 19: United Kingdom Trash Cans & Wastebaskets Revenue (undefined) Forecast, by Application 2020 & 2033
- Table 20: Germany Trash Cans & Wastebaskets Revenue (undefined) Forecast, by Application 2020 & 2033
- Table 21: France Trash Cans & Wastebaskets Revenue (undefined) Forecast, by Application 2020 & 2033
- Table 22: Italy Trash Cans & Wastebaskets Revenue (undefined) Forecast, by Application 2020 & 2033
- Table 23: Spain Trash Cans & Wastebaskets Revenue (undefined) Forecast, by Application 2020 & 2033
- Table 24: Russia Trash Cans & Wastebaskets Revenue (undefined) Forecast, by Application 2020 & 2033
- Table 25: Benelux Trash Cans & Wastebaskets Revenue (undefined) Forecast, by Application 2020 & 2033
- Table 26: Nordics Trash Cans & Wastebaskets Revenue (undefined) Forecast, by Application 2020 & 2033
- Table 27: Rest of Europe Trash Cans & Wastebaskets Revenue (undefined) Forecast, by Application 2020 & 2033
- Table 28: Global Trash Cans & Wastebaskets Revenue undefined Forecast, by Application 2020 & 2033
- Table 29: Global Trash Cans & Wastebaskets Revenue undefined Forecast, by Types 2020 & 2033
- Table 30: Global Trash Cans & Wastebaskets Revenue undefined Forecast, by Country 2020 & 2033
- Table 31: Turkey Trash Cans & Wastebaskets Revenue (undefined) Forecast, by Application 2020 & 2033
- Table 32: Israel Trash Cans & Wastebaskets Revenue (undefined) Forecast, by Application 2020 & 2033
- Table 33: GCC Trash Cans & Wastebaskets Revenue (undefined) Forecast, by Application 2020 & 2033
- Table 34: North Africa Trash Cans & Wastebaskets Revenue (undefined) Forecast, by Application 2020 & 2033
- Table 35: South Africa Trash Cans & Wastebaskets Revenue (undefined) Forecast, by Application 2020 & 2033
- Table 36: Rest of Middle East & Africa Trash Cans & Wastebaskets Revenue (undefined) Forecast, by Application 2020 & 2033
- Table 37: Global Trash Cans & Wastebaskets Revenue undefined Forecast, by Application 2020 & 2033
- Table 38: Global Trash Cans & Wastebaskets Revenue undefined Forecast, by Types 2020 & 2033
- Table 39: Global Trash Cans & Wastebaskets Revenue undefined Forecast, by Country 2020 & 2033
- Table 40: China Trash Cans & Wastebaskets Revenue (undefined) Forecast, by Application 2020 & 2033
- Table 41: India Trash Cans & Wastebaskets Revenue (undefined) Forecast, by Application 2020 & 2033
- Table 42: Japan Trash Cans & Wastebaskets Revenue (undefined) Forecast, by Application 2020 & 2033
- Table 43: South Korea Trash Cans & Wastebaskets Revenue (undefined) Forecast, by Application 2020 & 2033
- Table 44: ASEAN Trash Cans & Wastebaskets Revenue (undefined) Forecast, by Application 2020 & 2033
- Table 45: Oceania Trash Cans & Wastebaskets Revenue (undefined) Forecast, by Application 2020 & 2033
- Table 46: Rest of Asia Pacific Trash Cans & Wastebaskets Revenue (undefined) Forecast, by Application 2020 & 2033
Frequently Asked Questions
1. What is the projected Compound Annual Growth Rate (CAGR) of the Trash Cans & Wastebaskets?
The projected CAGR is approximately 4.3%.
2. Which companies are prominent players in the Trash Cans & Wastebaskets?
Key companies in the market include Rubbermaid, Hefty (Reynolds Consumer Products LLC), Newell Brands, Toter (Wastequip, LLC.), EKO, Simplehuman, Abfallbehaelter & Container Weber GmbH & Co. KG, Wesco, ALDA SA, Craemer, Carlisle FoodService Products, Plastik Gogić, Urbaniere, Fujian Nashida Electronic Incorporated, Sterilite, ESE, Straight Ltd, Hangzhou Bosheen Household Technology, Glasdon, MUJI, Busch System, Continental Commercial Products, ASVEL, Hefty (Reynolds Consumer Products), Helesi, CHAHUA.
3. What are the main segments of the Trash Cans & Wastebaskets?
The market segments include Application, Types.
4. Can you provide details about the market size?
The market size is estimated to be USD XXX N/A as of 2022.
5. What are some drivers contributing to market growth?
N/A
6. What are the notable trends driving market growth?
N/A
7. Are there any restraints impacting market growth?
N/A
8. Can you provide examples of recent developments in the market?
N/A
9. What pricing options are available for accessing the report?
Pricing options include single-user, multi-user, and enterprise licenses priced at USD 4900.00, USD 7350.00, and USD 9800.00 respectively.
10. Is the market size provided in terms of value or volume?
The market size is provided in terms of value, measured in N/A.
11. Are there any specific market keywords associated with the report?
Yes, the market keyword associated with the report is "Trash Cans & Wastebaskets," which aids in identifying and referencing the specific market segment covered.
12. How do I determine which pricing option suits my needs best?
The pricing options vary based on user requirements and access needs. Individual users may opt for single-user licenses, while businesses requiring broader access may choose multi-user or enterprise licenses for cost-effective access to the report.
13. Are there any additional resources or data provided in the Trash Cans & Wastebaskets report?
While the report offers comprehensive insights, it's advisable to review the specific contents or supplementary materials provided to ascertain if additional resources or data are available.
14. How can I stay updated on further developments or reports in the Trash Cans & Wastebaskets?
To stay informed about further developments, trends, and reports in the Trash Cans & Wastebaskets, consider subscribing to industry newsletters, following relevant companies and organizations, or regularly checking reputable industry news sources and publications.
Methodology
Step 1 - Identification of Relevant Samples Size from Population Database


Step 2 - Approaches for Defining Global Market Size (Value, Volume* & Price*)

Note*: In applicable scenarios
Step 3 - Data Sources
Primary Research
- Web Analytics
- Survey Reports
- Research Institute
- Latest Research Reports
- Opinion Leaders
Secondary Research
- Annual Reports
- White Paper
- Latest Press Release
- Industry Association
- Paid Database
- Investor Presentations

Step 4 - Data Triangulation
Involves using different sources of information in order to increase the validity of a study
These sources are likely to be stakeholders in a program - participants, other researchers, program staff, other community members, and so on.
Then we put all data in single framework & apply various statistical tools to find out the dynamic on the market.
During the analysis stage, feedback from the stakeholder groups would be compared to determine areas of agreement as well as areas of divergence