

Key Insights
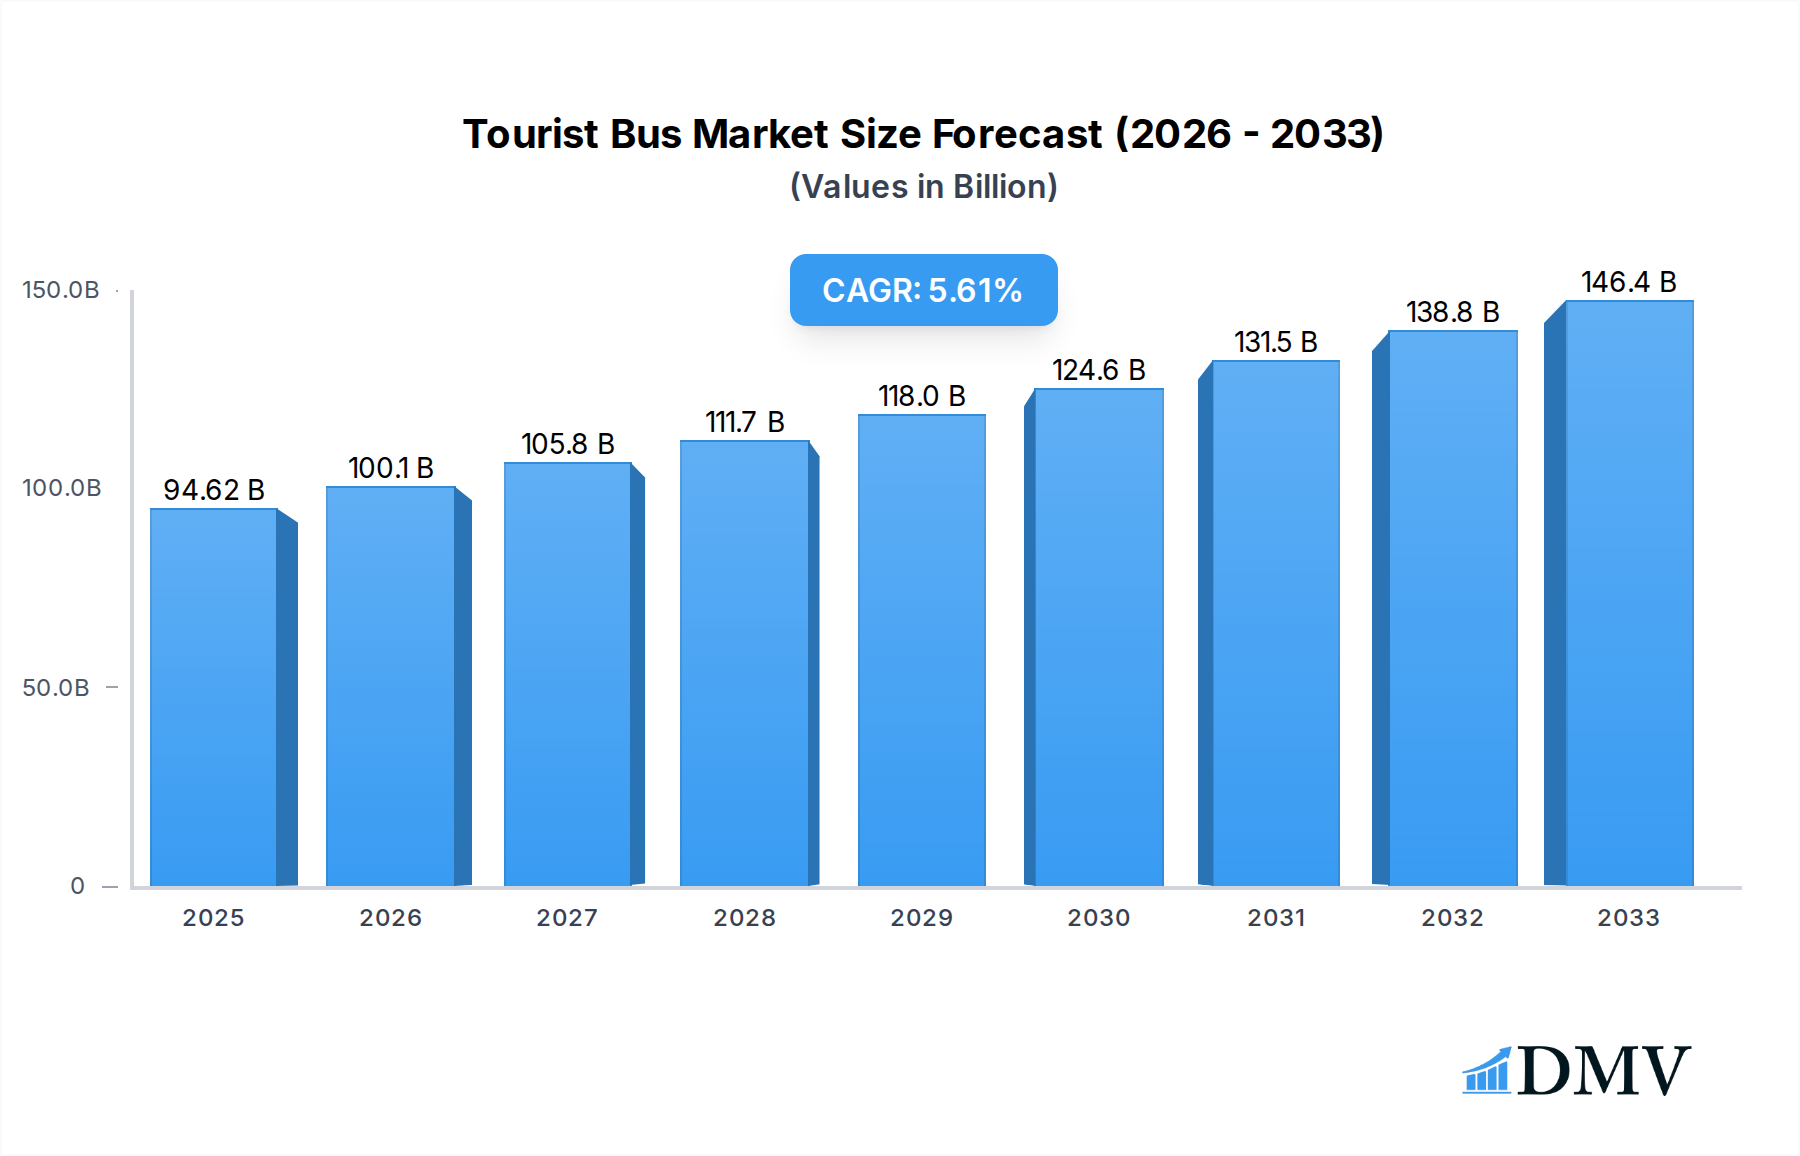
The global tourist bus market is poised for substantial growth, projected to reach USD 94.62 billion in 2025, with a compelling Compound Annual Growth Rate (CAGR) of 5.8% anticipated over the forecast period of 2025-2033. This expansion is primarily fueled by a resurgent global tourism industry and an increasing preference for organized group travel. Key drivers include the rising disposable incomes in emerging economies, leading to greater outbound tourism, and the continuous development of new tourist destinations. Furthermore, governments worldwide are investing in tourism infrastructure, including dedicated bus lanes and improved road networks, which further bolsters the market's upward trajectory. The demand for comfortable, safe, and technologically advanced tourist buses is also a significant contributor, pushing manufacturers to innovate in areas such as fuel efficiency and passenger amenities. The market is segmented by application into Commercial and Private Charter, with the former likely dominating due to established tour operators and large-scale event transportation.

Tourist Bus Market Size (In Billion)
The evolving landscape of tourist bus technology, particularly the rise of Electric Power and Hybrid Power options, represents a significant trend set to reshape the market. While Fuel Power buses will continue to hold a substantial share, environmental regulations and a growing consumer preference for sustainable travel are accelerating the adoption of greener alternatives. This shift presents both opportunities and challenges for manufacturers, requiring significant investment in research and development. Restraints, such as the high initial cost of electric and hybrid buses, alongside the need for charging infrastructure development, may temper the pace of adoption in certain regions. However, the long-term cost savings on fuel and maintenance, coupled with government incentives for eco-friendly transportation, are expected to mitigate these challenges. Major players like Zhengzhou Yutong Bus, Daimler, and BYD are actively investing in these new technologies, indicating a strong competitive push towards sustainable tourist bus solutions.
Tourist Bus Company Market Share
Tourist Bus Market Composition & Trends
The global tourist bus market is characterized by a dynamic landscape, with significant consolidation and fierce competition among key players. The study period, from 2019 to 2033, encompassing a historical analysis from 2019-2024, a base year of 2025, and a forecast period of 2025-2033, reveals evolving market shares and strategic maneuvers. Innovation catalysts, ranging from the adoption of electric powertrains to advanced safety features, are continuously reshaping product offerings. Regulatory frameworks, particularly concerning emissions standards and passenger safety, play a pivotal role in dictating market entry and product development. Substitute products, such as high-speed rail and short-haul flights, present a constant competitive pressure, influencing the demand for tourist bus services. End-user profiles are diversifying, with increased demand from tour operators, private charter services, and corporate event organizers. Mergers and acquisitions (M&A) activities are significant, with estimated deal values in the billions, aimed at expanding market reach, acquiring new technologies, and strengthening competitive positions. For instance, the M&A landscape might have seen transactions exceeding 5 billion in recent years, reflecting the industry's consolidation drive. Market share distribution is heavily influenced by the performance of leading manufacturers and their ability to adapt to emerging trends, with established brands like Zhengzhou Yutong Bus and Daimler consistently holding substantial portions of the market.
- Market Concentration: Moderately concentrated with a few dominant global players, but with emerging regional strengths.
- Innovation Catalysts: Electric powertrains, advanced driver-assistance systems (ADAS), enhanced passenger comfort features, and sustainable manufacturing processes.
- Regulatory Landscapes: Stringent emission norms (e.g., Euro VI, EPA standards), safety regulations for passenger transport, and incentives for zero-emission vehicles.
- Substitute Products: High-speed rail, budget airlines, ride-sharing services for shorter distances.
- End-User Profiles: Tour operators, group travel agencies, corporate event organizers, educational institutions, private charter services.
- M&A Activities: Strategic acquisitions to gain market share, technology, or expand product portfolios, with significant deal values potentially reaching 3 billion annually.
Tourist Bus Industry Evolution
The tourist bus industry is undergoing a profound transformation, driven by a confluence of technological advancements, evolving consumer preferences, and a growing global emphasis on sustainability. Over the study period (2019-2033), market growth trajectories have been significantly influenced by the increasing demand for convenient and comfortable group travel experiences. Technological advancements are at the forefront of this evolution, with a noticeable shift towards Electric Power and Hybrid Power bus types. This transition is not merely about environmental consciousness; it also addresses operational cost reductions through lower fuel expenses and reduced maintenance needs, especially for fleet operators. The adoption of electric tourist buses, for example, has seen a considerable upward trend, with projections indicating a substantial increase in their market share by the base year of 2025 and a robust growth rate of approximately 15% during the forecast period (2025-2033).
Shifting consumer demands are also playing a crucial role. Modern travelers, whether for leisure or business, expect enhanced onboard amenities, seamless connectivity, and a premium travel experience. This has spurred manufacturers to incorporate features such as Wi-Fi, charging ports, advanced infotainment systems, and ergonomically designed seating. The resurgence of tourism post-pandemic has further amplified the need for efficient and reliable transportation solutions, directly benefiting the tourist bus sector. Furthermore, governments worldwide are actively promoting the adoption of cleaner transportation technologies through subsidies, tax incentives, and stringent emission regulations, creating a favorable market environment for eco-friendly tourist buses. The industry's ability to innovate and adapt to these changing dynamics, particularly in areas like battery technology and charging infrastructure for electric buses, will be critical in sustaining its growth momentum. The historical period (2019-2024) saw initial investments in these areas, laying the groundwork for the accelerated adoption observed in the forecast period.
Leading Regions, Countries, or Segments in Tourist Bus
The global tourist bus market exhibits distinct regional dominance and segment leadership, driven by a combination of economic factors, tourism infrastructure, and policy support. Europe and Asia-Pacific currently represent the leading regions, owing to their well-established tourism industries and proactive adoption of advanced bus technologies. Within these regions, countries like Germany, France, China, and India are significant contributors to market growth. The Commercial application segment, which encompasses tour operators and public transport services catering to tourists, is the largest and most influential, driven by higher fleet volumes and consistent demand. In contrast, the Private Charter segment, while smaller, offers higher profit margins per vehicle and caters to a niche but growing demand for personalized travel experiences.
- Leading Region: Europe: Characterized by mature tourism markets, stringent environmental regulations favoring electric mobility, and a strong presence of key manufacturers like Daimler and Volvo. Investment trends are heavily geared towards fleet modernization with a focus on emission reduction.
- Leading Country: China: Dominates in terms of manufacturing volume and domestic demand, with companies like Zhengzhou Yutong Bus and King Long United Automotive leading the charge. Government initiatives promoting electric vehicle adoption are a significant driver.
- Dominant Application Segment: Commercial: High demand from tour operators, travel agencies, and intercity transport services, necessitating reliable and cost-effective fleet solutions. This segment's growth is directly tied to the overall health of the tourism industry.
- Emerging Segment: Private Charter: Growing demand for customized group travel for corporate events, special occasions, and niche tourism experiences. This segment is increasingly seeking premium features and specialized vehicle designs.
- Type Dominance Trend: Fuel Power still dominates, but Electric Power is rapidly gaining traction. While traditional Fuel Power buses continue to hold a significant market share due to established infrastructure and lower upfront costs, the rapid advancements in battery technology and government incentives are propelling the growth of Electric Power tourist buses. Hybrid Power offers a transitional solution, bridging the gap between conventional and fully electric options. Regulatory support for cleaner technologies, such as carbon emission targets and subsidies for electric vehicles, is a key driver influencing this shift. For example, initiatives to reduce urban air pollution in major tourist destinations are encouraging the deployment of zero-emission buses.
Tourist Bus Product Innovations
Tourist bus product innovations are consistently enhancing passenger experience and operational efficiency. Leading manufacturers are integrating advanced safety features like autonomous emergency braking, lane-keeping assist, and 360-degree camera systems. The adoption of lightweight materials and aerodynamic designs contributes to improved fuel efficiency, while sophisticated climate control and entertainment systems elevate passenger comfort. In the realm of propulsion, advancements in battery technology are enabling longer ranges and faster charging times for electric tourist buses, making them increasingly viable for longer routes. The integration of smart technologies, including real-time tracking, diagnostics, and passenger information systems, further optimizes fleet management and service delivery.
Propelling Factors for Tourist Bus Growth
Several key factors are propelling the growth of the tourist bus market. Firstly, the global resurgence of tourism and increasing disposable incomes are driving higher demand for group travel. Secondly, technological advancements in electric and hybrid powertrains, coupled with improving battery life and decreasing costs, are making these sustainable options more attractive. Thirdly, supportive government policies, including subsidies for eco-friendly vehicles and stricter emission regulations, are encouraging the adoption of cleaner tourist buses. Finally, the growing trend of experiential travel and the need for convenient, group-friendly transportation solutions further bolster the market's expansion. For instance, initiatives like the European Green Deal are directly influencing fleet upgrades.
Obstacles in the Tourist Bus Market
Despite robust growth, the tourist bus market faces several obstacles. High upfront costs for advanced technologies, particularly electric buses, can be a deterrent for some operators, despite long-term operational savings. The availability and charging infrastructure for electric tourist buses remain a concern in many regions, limiting their deployment on extensive routes. Supply chain disruptions, as seen in recent years, can lead to increased manufacturing costs and extended delivery times for vehicles and components. Furthermore, evolving regulatory landscapes, while often supportive of green initiatives, can also introduce compliance challenges and additional expenses for manufacturers and operators alike. Intense competition and price sensitivity among certain customer segments also pose a challenge.
Future Opportunities in Tourist Bus
The future of the tourist bus market is ripe with opportunities. The increasing demand for sustainable tourism presents a significant opportunity for electric and hydrogen-powered tourist buses, especially in eco-conscious destinations. The expansion of tourism into emerging markets, coupled with infrastructure development, will create new avenues for growth. Innovations in autonomous driving technology could revolutionize fleet management and operational efficiency. Furthermore, the growing trend of personalized travel and bespoke tour packages will drive demand for specialized and luxury tourist bus offerings, catering to higher-end market segments. The development of integrated mobility solutions, connecting tourist buses with other forms of transport, also holds promise.
Major Players in the Tourist Bus Ecosystem
- Zhengzhou Yutong Bus
- Daimler
- Solaris Bus & Coach
- Volvo
- Ashok Leyland
- BYD
- New Flyer
- Otokar
- Scania
- Tata Motors
- King Long United Automotive
- Zhongtong Bus
- Zhuhai Guangtong Bus
- Nanjing Golden Dragon Bus
- DFAC
- CRRC
- Beiqi Foton Motor
- ANKAI
- Gillig
- Collins Industries
- Starcraft Bus
- Trans Tech
- IC Bus
- Thomas Built Buses
- Blue Bird Corporation
- Girardin Minibus
- Lion Bus
- Alexander Dennis
- Iveco
- Ford
- FAW
- Higer Bus
- DEALER SPIKE
Key Developments in Tourist Bus Industry
- 2024 February: Solaris Bus & Coach launches a new generation of electric intercity buses with enhanced battery technology, extending operational range by an estimated 20%.
- 2023 December: Volvo Buses announces a significant investment of 1 billion in R&D for hydrogen-powered tourist coaches.
- 2023 October: BYD unveils its latest electric tourist bus model, boasting a charging time of under 2 hours for a full charge, impacting fleet turnaround times.
- 2023 August: Daimler Truck completes the acquisition of a stake in a battery technology firm, aiming to secure future battery supply for its electric bus portfolio, valued at 2 billion.
- 2022 November: Zhengzhou Yutong Bus secures a record order for 1,000 electric tourist buses from a consortium of Chinese tour operators, highlighting the strong domestic market.
- 2022 July: New Flyer Industries introduces an integrated fleet management software that optimizes route planning and energy consumption for their electric bus fleet.
- 2022 April: Alexander Dennis announces a partnership with a charging infrastructure provider to offer comprehensive charging solutions for its electric bus customers.
- 2021 September: Iveco introduces a new hybrid powertrain option for its popular tourist bus models, offering improved fuel efficiency and reduced emissions.
Strategic Tourist Bus Market Forecast
The strategic forecast for the tourist bus market is exceptionally positive, driven by persistent growth catalysts and expanding opportunities. The ongoing transition towards electric and hybrid powertrains, supported by favorable government policies and a heightened global focus on sustainability, will continue to be a primary growth driver. The increasing volume of international and domestic tourism, coupled with the desire for comfortable and efficient group transportation, ensures sustained demand for commercial and private charter services. Innovations in vehicle technology, including enhanced safety features and passenger amenities, will further stimulate market penetration. Emerging markets present significant untapped potential, while the continuous evolution of urban mobility solutions will also create new avenues for specialized tourist bus services. The market is poised for robust expansion, with a projected compound annual growth rate (CAGR) of approximately 10% during the forecast period.
Tourist Bus Segmentation
-
1. Application
- 1.1. Commercial
- 1.2. Private Charter
-
2. Type
- 2.1. Fuel Power
- 2.2. Electric Power
- 2.3. Hybrid Power
Tourist Bus Segmentation By Geography
-
1. North America
- 1.1. United States
- 1.2. Canada
- 1.3. Mexico
-
2. South America
- 2.1. Brazil
- 2.2. Argentina
- 2.3. Rest of South America
-
3. Europe
- 3.1. United Kingdom
- 3.2. Germany
- 3.3. France
- 3.4. Italy
- 3.5. Spain
- 3.6. Russia
- 3.7. Benelux
- 3.8. Nordics
- 3.9. Rest of Europe
-
4. Middle East & Africa
- 4.1. Turkey
- 4.2. Israel
- 4.3. GCC
- 4.4. North Africa
- 4.5. South Africa
- 4.6. Rest of Middle East & Africa
-
5. Asia Pacific
- 5.1. China
- 5.2. India
- 5.3. Japan
- 5.4. South Korea
- 5.5. ASEAN
- 5.6. Oceania
- 5.7. Rest of Asia Pacific
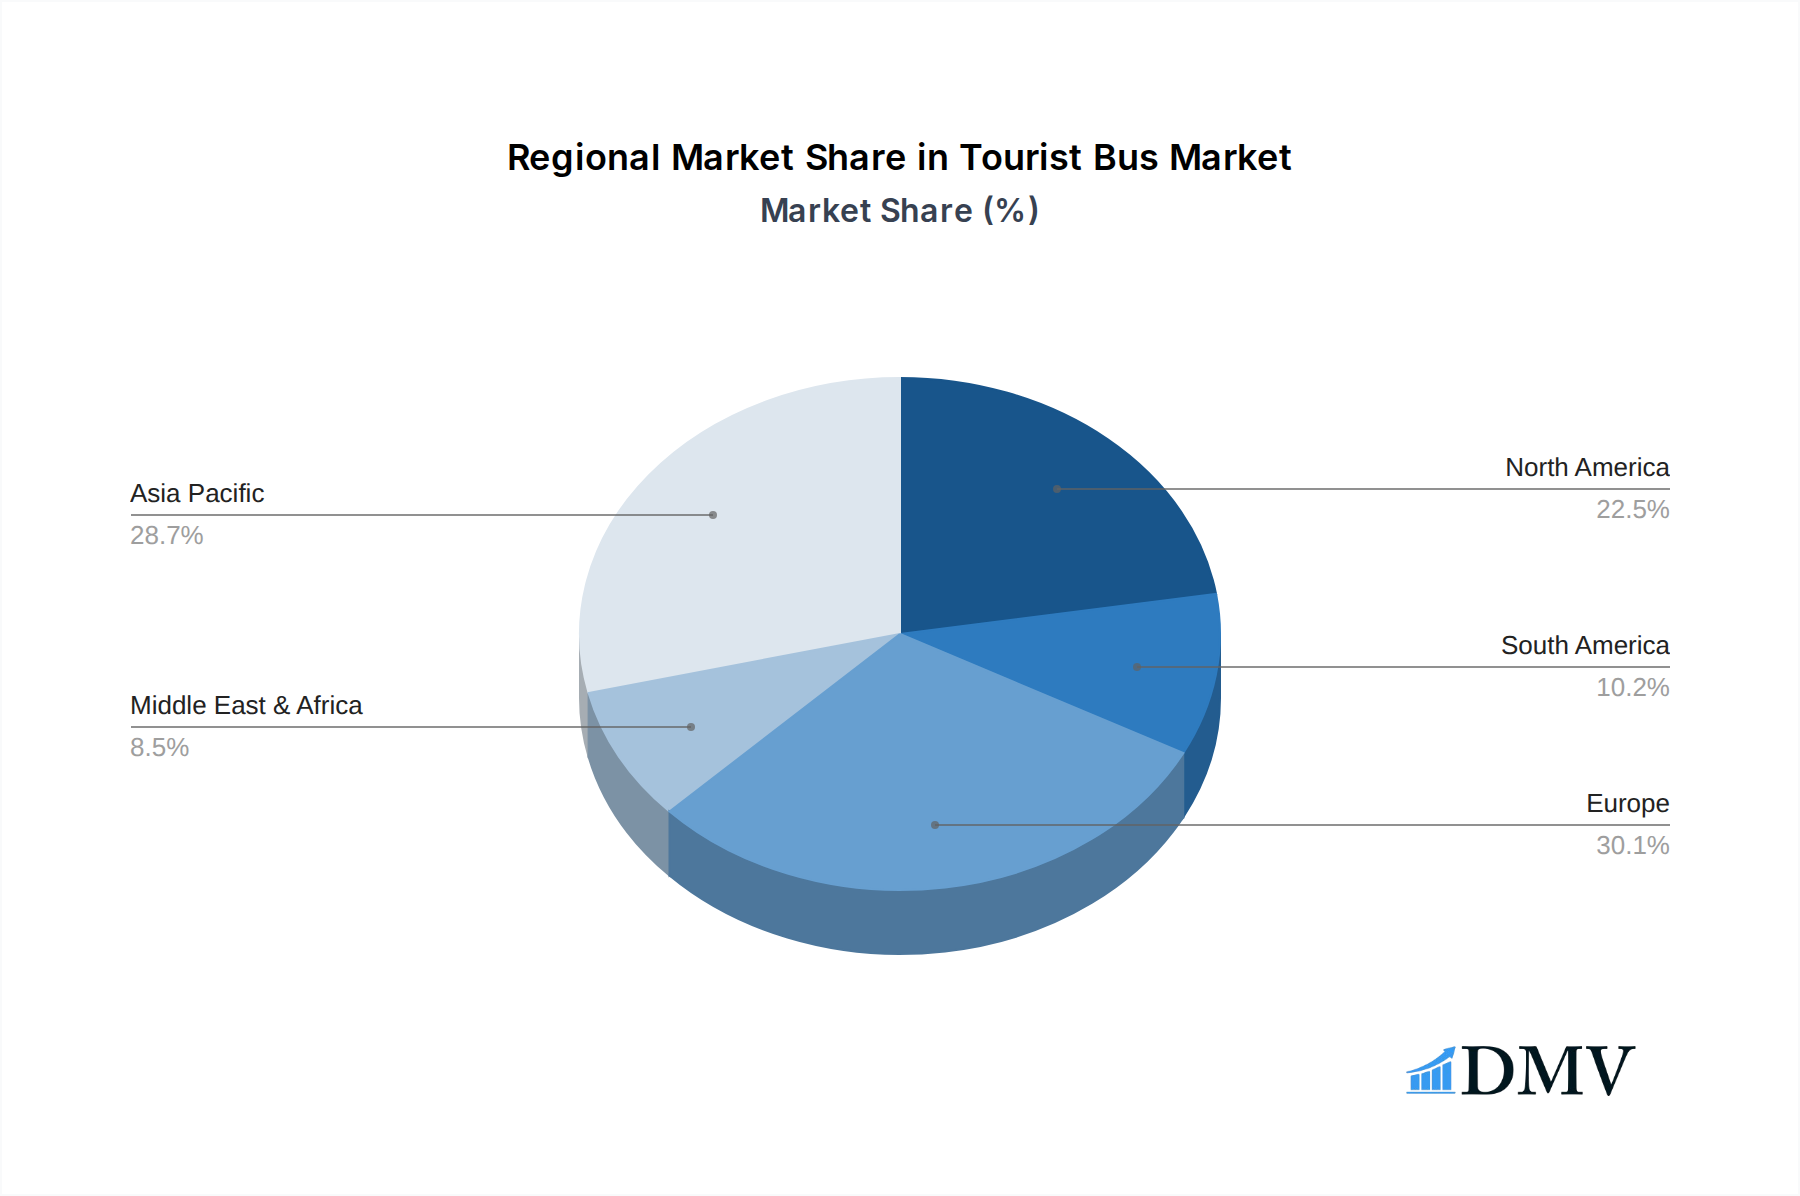
Tourist Bus Regional Market Share
Geographic Coverage of Tourist Bus
Tourist Bus REPORT HIGHLIGHTS
| Aspects | Details |
|---|---|
| Study Period | 2020-2034 |
| Base Year | 2025 |
| Estimated Year | 2026 |
| Forecast Period | 2026-2034 |
| Historical Period | 2020-2025 |
| Growth Rate | CAGR of 5.8% from 2020-2034 |
| Segmentation |
|
Table of Contents
- 1. Introduction
- 1.1. Research Scope
- 1.2. Market Segmentation
- 1.3. Research Objective
- 1.4. Definitions and Assumptions
- 2. Executive Summary
- 2.1. Market Snapshot
- 3. Market Dynamics
- 3.1. Market Drivers
- 3.2. Market Restrains
- 3.3. Market Trends
- 3.4. Market Opportunities
- 4. Market Factor Analysis
- 4.1. Porters Five Forces
- 4.1.1. Bargaining Power of Suppliers
- 4.1.2. Bargaining Power of Buyers
- 4.1.3. Threat of New Entrants
- 4.1.4. Threat of Substitutes
- 4.1.5. Competitive Rivalry
- 4.2. PESTEL analysis
- 4.3. BCG Analysis
- 4.3.1. Stars (High Growth, High Market Share)
- 4.3.2. Cash Cows (Low Growth, High Market Share)
- 4.3.3. Question Mark (High Growth, Low Market Share)
- 4.3.4. Dogs (Low Growth, Low Market Share)
- 4.4. Ansoff Matrix Analysis
- 4.5. Supply Chain Analysis
- 4.6. Regulatory Landscape
- 4.7. Current Market Potential and Opportunity Assessment (TAM–SAM–SOM Framework)
- 4.8. DMV Analyst Note
- 4.1. Porters Five Forces
- 5. Market Analysis, Insights and Forecast 2021-2033
- 5.1. Market Analysis, Insights and Forecast - by Application
- 5.1.1. Commercial
- 5.1.2. Private Charter
- 5.2. Market Analysis, Insights and Forecast - by Type
- 5.2.1. Fuel Power
- 5.2.2. Electric Power
- 5.2.3. Hybrid Power
- 5.3. Market Analysis, Insights and Forecast - by Region
- 5.3.1. North America
- 5.3.2. South America
- 5.3.3. Europe
- 5.3.4. Middle East & Africa
- 5.3.5. Asia Pacific
- 5.1. Market Analysis, Insights and Forecast - by Application
- 6. Global Tourist Bus Analysis, Insights and Forecast, 2021-2033
- 6.1. Market Analysis, Insights and Forecast - by Application
- 6.1.1. Commercial
- 6.1.2. Private Charter
- 6.2. Market Analysis, Insights and Forecast - by Type
- 6.2.1. Fuel Power
- 6.2.2. Electric Power
- 6.2.3. Hybrid Power
- 6.1. Market Analysis, Insights and Forecast - by Application
- 7. North America Tourist Bus Analysis, Insights and Forecast, 2020-2032
- 7.1. Market Analysis, Insights and Forecast - by Application
- 7.1.1. Commercial
- 7.1.2. Private Charter
- 7.2. Market Analysis, Insights and Forecast - by Type
- 7.2.1. Fuel Power
- 7.2.2. Electric Power
- 7.2.3. Hybrid Power
- 7.1. Market Analysis, Insights and Forecast - by Application
- 8. South America Tourist Bus Analysis, Insights and Forecast, 2020-2032
- 8.1. Market Analysis, Insights and Forecast - by Application
- 8.1.1. Commercial
- 8.1.2. Private Charter
- 8.2. Market Analysis, Insights and Forecast - by Type
- 8.2.1. Fuel Power
- 8.2.2. Electric Power
- 8.2.3. Hybrid Power
- 8.1. Market Analysis, Insights and Forecast - by Application
- 9. Europe Tourist Bus Analysis, Insights and Forecast, 2020-2032
- 9.1. Market Analysis, Insights and Forecast - by Application
- 9.1.1. Commercial
- 9.1.2. Private Charter
- 9.2. Market Analysis, Insights and Forecast - by Type
- 9.2.1. Fuel Power
- 9.2.2. Electric Power
- 9.2.3. Hybrid Power
- 9.1. Market Analysis, Insights and Forecast - by Application
- 10. Middle East & Africa Tourist Bus Analysis, Insights and Forecast, 2020-2032
- 10.1. Market Analysis, Insights and Forecast - by Application
- 10.1.1. Commercial
- 10.1.2. Private Charter
- 10.2. Market Analysis, Insights and Forecast - by Type
- 10.2.1. Fuel Power
- 10.2.2. Electric Power
- 10.2.3. Hybrid Power
- 10.1. Market Analysis, Insights and Forecast - by Application
- 11. Asia Pacific Tourist Bus Analysis, Insights and Forecast, 2020-2032
- 11.1. Market Analysis, Insights and Forecast - by Application
- 11.1.1. Commercial
- 11.1.2. Private Charter
- 11.2. Market Analysis, Insights and Forecast - by Type
- 11.2.1. Fuel Power
- 11.2.2. Electric Power
- 11.2.3. Hybrid Power
- 11.1. Market Analysis, Insights and Forecast - by Application
- 12. Competitive Analysis
- 12.1. Company Profiles
- 12.1.1 Zhengzhou Yutong Bus
- 12.1.1.1. Company Overview
- 12.1.1.2. Products
- 12.1.1.3. Company Financials
- 12.1.1.4. SWOT Analysis
- 12.1.2 Daimler
- 12.1.2.1. Company Overview
- 12.1.2.2. Products
- 12.1.2.3. Company Financials
- 12.1.2.4. SWOT Analysis
- 12.1.3 Solaris Bus & Coach
- 12.1.3.1. Company Overview
- 12.1.3.2. Products
- 12.1.3.3. Company Financials
- 12.1.3.4. SWOT Analysis
- 12.1.4 Volvo
- 12.1.4.1. Company Overview
- 12.1.4.2. Products
- 12.1.4.3. Company Financials
- 12.1.4.4. SWOT Analysis
- 12.1.5 Ashok Leyland
- 12.1.5.1. Company Overview
- 12.1.5.2. Products
- 12.1.5.3. Company Financials
- 12.1.5.4. SWOT Analysis
- 12.1.6 BYD
- 12.1.6.1. Company Overview
- 12.1.6.2. Products
- 12.1.6.3. Company Financials
- 12.1.6.4. SWOT Analysis
- 12.1.7 New Flyer
- 12.1.7.1. Company Overview
- 12.1.7.2. Products
- 12.1.7.3. Company Financials
- 12.1.7.4. SWOT Analysis
- 12.1.8 Otokar
- 12.1.8.1. Company Overview
- 12.1.8.2. Products
- 12.1.8.3. Company Financials
- 12.1.8.4. SWOT Analysis
- 12.1.9 Scania
- 12.1.9.1. Company Overview
- 12.1.9.2. Products
- 12.1.9.3. Company Financials
- 12.1.9.4. SWOT Analysis
- 12.1.10 Tata Motors
- 12.1.10.1. Company Overview
- 12.1.10.2. Products
- 12.1.10.3. Company Financials
- 12.1.10.4. SWOT Analysis
- 12.1.11 King Long United Automotive
- 12.1.11.1. Company Overview
- 12.1.11.2. Products
- 12.1.11.3. Company Financials
- 12.1.11.4. SWOT Analysis
- 12.1.12 Zhongtong Bus
- 12.1.12.1. Company Overview
- 12.1.12.2. Products
- 12.1.12.3. Company Financials
- 12.1.12.4. SWOT Analysis
- 12.1.13 Zhuhai Guangtong Bus
- 12.1.13.1. Company Overview
- 12.1.13.2. Products
- 12.1.13.3. Company Financials
- 12.1.13.4. SWOT Analysis
- 12.1.14 Nanjing Golden Dragon Bus
- 12.1.14.1. Company Overview
- 12.1.14.2. Products
- 12.1.14.3. Company Financials
- 12.1.14.4. SWOT Analysis
- 12.1.15 DFAC
- 12.1.15.1. Company Overview
- 12.1.15.2. Products
- 12.1.15.3. Company Financials
- 12.1.15.4. SWOT Analysis
- 12.1.16 CRRC
- 12.1.16.1. Company Overview
- 12.1.16.2. Products
- 12.1.16.3. Company Financials
- 12.1.16.4. SWOT Analysis
- 12.1.17 Beiqi Foton Motor
- 12.1.17.1. Company Overview
- 12.1.17.2. Products
- 12.1.17.3. Company Financials
- 12.1.17.4. SWOT Analysis
- 12.1.18 ANKAI
- 12.1.18.1. Company Overview
- 12.1.18.2. Products
- 12.1.18.3. Company Financials
- 12.1.18.4. SWOT Analysis
- 12.1.19 Gillig
- 12.1.19.1. Company Overview
- 12.1.19.2. Products
- 12.1.19.3. Company Financials
- 12.1.19.4. SWOT Analysis
- 12.1.20 Collins Industries
- 12.1.20.1. Company Overview
- 12.1.20.2. Products
- 12.1.20.3. Company Financials
- 12.1.20.4. SWOT Analysis
- 12.1.21 Starcraft Bus
- 12.1.21.1. Company Overview
- 12.1.21.2. Products
- 12.1.21.3. Company Financials
- 12.1.21.4. SWOT Analysis
- 12.1.22 Trans Tech
- 12.1.22.1. Company Overview
- 12.1.22.2. Products
- 12.1.22.3. Company Financials
- 12.1.22.4. SWOT Analysis
- 12.1.23 IC Bus
- 12.1.23.1. Company Overview
- 12.1.23.2. Products
- 12.1.23.3. Company Financials
- 12.1.23.4. SWOT Analysis
- 12.1.24 Thomas Built Buses
- 12.1.24.1. Company Overview
- 12.1.24.2. Products
- 12.1.24.3. Company Financials
- 12.1.24.4. SWOT Analysis
- 12.1.25 Blue Bird Corporation
- 12.1.25.1. Company Overview
- 12.1.25.2. Products
- 12.1.25.3. Company Financials
- 12.1.25.4. SWOT Analysis
- 12.1.26 Girardin Minibus
- 12.1.26.1. Company Overview
- 12.1.26.2. Products
- 12.1.26.3. Company Financials
- 12.1.26.4. SWOT Analysis
- 12.1.27 Lion Bus
- 12.1.27.1. Company Overview
- 12.1.27.2. Products
- 12.1.27.3. Company Financials
- 12.1.27.4. SWOT Analysis
- 12.1.28 Alexander Dennis
- 12.1.28.1. Company Overview
- 12.1.28.2. Products
- 12.1.28.3. Company Financials
- 12.1.28.4. SWOT Analysis
- 12.1.29 Iveco
- 12.1.29.1. Company Overview
- 12.1.29.2. Products
- 12.1.29.3. Company Financials
- 12.1.29.4. SWOT Analysis
- 12.1.30 Ford
- 12.1.30.1. Company Overview
- 12.1.30.2. Products
- 12.1.30.3. Company Financials
- 12.1.30.4. SWOT Analysis
- 12.1.31 FAW
- 12.1.31.1. Company Overview
- 12.1.31.2. Products
- 12.1.31.3. Company Financials
- 12.1.31.4. SWOT Analysis
- 12.1.32 Higer Bus
- 12.1.32.1. Company Overview
- 12.1.32.2. Products
- 12.1.32.3. Company Financials
- 12.1.32.4. SWOT Analysis
- 12.1.33 DEALER SPIKE
- 12.1.33.1. Company Overview
- 12.1.33.2. Products
- 12.1.33.3. Company Financials
- 12.1.33.4. SWOT Analysis
- 12.1.1 Zhengzhou Yutong Bus
- 12.2. Market Entropy
- 12.2.1 Company's Key Areas Served
- 12.2.2 Recent Developments
- 12.3. Company Market Share Analysis 2025
- 12.3.1 Top 5 Companies Market Share Analysis
- 12.3.2 Top 3 Companies Market Share Analysis
- 12.4. List of Potential Customers
- 13. Research Methodology
List of Figures
- Figure 1: Global Tourist Bus Revenue Breakdown (billion, %) by Region 2025 & 2033
- Figure 2: North America Tourist Bus Revenue (billion), by Application 2025 & 2033
- Figure 3: North America Tourist Bus Revenue Share (%), by Application 2025 & 2033
- Figure 4: North America Tourist Bus Revenue (billion), by Type 2025 & 2033
- Figure 5: North America Tourist Bus Revenue Share (%), by Type 2025 & 2033
- Figure 6: North America Tourist Bus Revenue (billion), by Country 2025 & 2033
- Figure 7: North America Tourist Bus Revenue Share (%), by Country 2025 & 2033
- Figure 8: South America Tourist Bus Revenue (billion), by Application 2025 & 2033
- Figure 9: South America Tourist Bus Revenue Share (%), by Application 2025 & 2033
- Figure 10: South America Tourist Bus Revenue (billion), by Type 2025 & 2033
- Figure 11: South America Tourist Bus Revenue Share (%), by Type 2025 & 2033
- Figure 12: South America Tourist Bus Revenue (billion), by Country 2025 & 2033
- Figure 13: South America Tourist Bus Revenue Share (%), by Country 2025 & 2033
- Figure 14: Europe Tourist Bus Revenue (billion), by Application 2025 & 2033
- Figure 15: Europe Tourist Bus Revenue Share (%), by Application 2025 & 2033
- Figure 16: Europe Tourist Bus Revenue (billion), by Type 2025 & 2033
- Figure 17: Europe Tourist Bus Revenue Share (%), by Type 2025 & 2033
- Figure 18: Europe Tourist Bus Revenue (billion), by Country 2025 & 2033
- Figure 19: Europe Tourist Bus Revenue Share (%), by Country 2025 & 2033
- Figure 20: Middle East & Africa Tourist Bus Revenue (billion), by Application 2025 & 2033
- Figure 21: Middle East & Africa Tourist Bus Revenue Share (%), by Application 2025 & 2033
- Figure 22: Middle East & Africa Tourist Bus Revenue (billion), by Type 2025 & 2033
- Figure 23: Middle East & Africa Tourist Bus Revenue Share (%), by Type 2025 & 2033
- Figure 24: Middle East & Africa Tourist Bus Revenue (billion), by Country 2025 & 2033
- Figure 25: Middle East & Africa Tourist Bus Revenue Share (%), by Country 2025 & 2033
- Figure 26: Asia Pacific Tourist Bus Revenue (billion), by Application 2025 & 2033
- Figure 27: Asia Pacific Tourist Bus Revenue Share (%), by Application 2025 & 2033
- Figure 28: Asia Pacific Tourist Bus Revenue (billion), by Type 2025 & 2033
- Figure 29: Asia Pacific Tourist Bus Revenue Share (%), by Type 2025 & 2033
- Figure 30: Asia Pacific Tourist Bus Revenue (billion), by Country 2025 & 2033
- Figure 31: Asia Pacific Tourist Bus Revenue Share (%), by Country 2025 & 2033
List of Tables
- Table 1: Global Tourist Bus Revenue billion Forecast, by Application 2020 & 2033
- Table 2: Global Tourist Bus Revenue billion Forecast, by Type 2020 & 2033
- Table 3: Global Tourist Bus Revenue billion Forecast, by Region 2020 & 2033
- Table 4: Global Tourist Bus Revenue billion Forecast, by Application 2020 & 2033
- Table 5: Global Tourist Bus Revenue billion Forecast, by Type 2020 & 2033
- Table 6: Global Tourist Bus Revenue billion Forecast, by Country 2020 & 2033
- Table 7: United States Tourist Bus Revenue (billion) Forecast, by Application 2020 & 2033
- Table 8: Canada Tourist Bus Revenue (billion) Forecast, by Application 2020 & 2033
- Table 9: Mexico Tourist Bus Revenue (billion) Forecast, by Application 2020 & 2033
- Table 10: Global Tourist Bus Revenue billion Forecast, by Application 2020 & 2033
- Table 11: Global Tourist Bus Revenue billion Forecast, by Type 2020 & 2033
- Table 12: Global Tourist Bus Revenue billion Forecast, by Country 2020 & 2033
- Table 13: Brazil Tourist Bus Revenue (billion) Forecast, by Application 2020 & 2033
- Table 14: Argentina Tourist Bus Revenue (billion) Forecast, by Application 2020 & 2033
- Table 15: Rest of South America Tourist Bus Revenue (billion) Forecast, by Application 2020 & 2033
- Table 16: Global Tourist Bus Revenue billion Forecast, by Application 2020 & 2033
- Table 17: Global Tourist Bus Revenue billion Forecast, by Type 2020 & 2033
- Table 18: Global Tourist Bus Revenue billion Forecast, by Country 2020 & 2033
- Table 19: United Kingdom Tourist Bus Revenue (billion) Forecast, by Application 2020 & 2033
- Table 20: Germany Tourist Bus Revenue (billion) Forecast, by Application 2020 & 2033
- Table 21: France Tourist Bus Revenue (billion) Forecast, by Application 2020 & 2033
- Table 22: Italy Tourist Bus Revenue (billion) Forecast, by Application 2020 & 2033
- Table 23: Spain Tourist Bus Revenue (billion) Forecast, by Application 2020 & 2033
- Table 24: Russia Tourist Bus Revenue (billion) Forecast, by Application 2020 & 2033
- Table 25: Benelux Tourist Bus Revenue (billion) Forecast, by Application 2020 & 2033
- Table 26: Nordics Tourist Bus Revenue (billion) Forecast, by Application 2020 & 2033
- Table 27: Rest of Europe Tourist Bus Revenue (billion) Forecast, by Application 2020 & 2033
- Table 28: Global Tourist Bus Revenue billion Forecast, by Application 2020 & 2033
- Table 29: Global Tourist Bus Revenue billion Forecast, by Type 2020 & 2033
- Table 30: Global Tourist Bus Revenue billion Forecast, by Country 2020 & 2033
- Table 31: Turkey Tourist Bus Revenue (billion) Forecast, by Application 2020 & 2033
- Table 32: Israel Tourist Bus Revenue (billion) Forecast, by Application 2020 & 2033
- Table 33: GCC Tourist Bus Revenue (billion) Forecast, by Application 2020 & 2033
- Table 34: North Africa Tourist Bus Revenue (billion) Forecast, by Application 2020 & 2033
- Table 35: South Africa Tourist Bus Revenue (billion) Forecast, by Application 2020 & 2033
- Table 36: Rest of Middle East & Africa Tourist Bus Revenue (billion) Forecast, by Application 2020 & 2033
- Table 37: Global Tourist Bus Revenue billion Forecast, by Application 2020 & 2033
- Table 38: Global Tourist Bus Revenue billion Forecast, by Type 2020 & 2033
- Table 39: Global Tourist Bus Revenue billion Forecast, by Country 2020 & 2033
- Table 40: China Tourist Bus Revenue (billion) Forecast, by Application 2020 & 2033
- Table 41: India Tourist Bus Revenue (billion) Forecast, by Application 2020 & 2033
- Table 42: Japan Tourist Bus Revenue (billion) Forecast, by Application 2020 & 2033
- Table 43: South Korea Tourist Bus Revenue (billion) Forecast, by Application 2020 & 2033
- Table 44: ASEAN Tourist Bus Revenue (billion) Forecast, by Application 2020 & 2033
- Table 45: Oceania Tourist Bus Revenue (billion) Forecast, by Application 2020 & 2033
- Table 46: Rest of Asia Pacific Tourist Bus Revenue (billion) Forecast, by Application 2020 & 2033
Frequently Asked Questions
1. What is the projected Compound Annual Growth Rate (CAGR) of the Tourist Bus?
The projected CAGR is approximately 5.8%.
2. Which companies are prominent players in the Tourist Bus?
Key companies in the market include Zhengzhou Yutong Bus, Daimler, Solaris Bus & Coach, Volvo, Ashok Leyland, BYD, New Flyer, Otokar, Scania, Tata Motors, King Long United Automotive, Zhongtong Bus, Zhuhai Guangtong Bus, Nanjing Golden Dragon Bus, DFAC, CRRC, Beiqi Foton Motor, ANKAI, Gillig, Collins Industries, Starcraft Bus, Trans Tech, IC Bus, Thomas Built Buses, Blue Bird Corporation, Girardin Minibus, Lion Bus, Alexander Dennis, Iveco, Ford, FAW, Higer Bus, DEALER SPIKE.
3. What are the main segments of the Tourist Bus?
The market segments include Application, Type.
4. Can you provide details about the market size?
The market size is estimated to be USD 94.62 billion as of 2022.
5. What are some drivers contributing to market growth?
N/A
6. What are the notable trends driving market growth?
N/A
7. Are there any restraints impacting market growth?
N/A
8. Can you provide examples of recent developments in the market?
N/A
9. What pricing options are available for accessing the report?
Pricing options include single-user, multi-user, and enterprise licenses priced at USD 2900.00, USD 4350.00, and USD 5800.00 respectively.
10. Is the market size provided in terms of value or volume?
The market size is provided in terms of value, measured in billion.
11. Are there any specific market keywords associated with the report?
Yes, the market keyword associated with the report is "Tourist Bus," which aids in identifying and referencing the specific market segment covered.
12. How do I determine which pricing option suits my needs best?
The pricing options vary based on user requirements and access needs. Individual users may opt for single-user licenses, while businesses requiring broader access may choose multi-user or enterprise licenses for cost-effective access to the report.
13. Are there any additional resources or data provided in the Tourist Bus report?
While the report offers comprehensive insights, it's advisable to review the specific contents or supplementary materials provided to ascertain if additional resources or data are available.
14. How can I stay updated on further developments or reports in the Tourist Bus?
To stay informed about further developments, trends, and reports in the Tourist Bus, consider subscribing to industry newsletters, following relevant companies and organizations, or regularly checking reputable industry news sources and publications.
Methodology
Step 1 - Identification of Relevant Samples Size from Population Database


Step 2 - Approaches for Defining Global Market Size (Value, Volume* & Price*)

Note*: In applicable scenarios
Step 3 - Data Sources
Primary Research
- Web Analytics
- Survey Reports
- Research Institute
- Latest Research Reports
- Opinion Leaders
Secondary Research
- Annual Reports
- White Paper
- Latest Press Release
- Industry Association
- Paid Database
- Investor Presentations

Step 4 - Data Triangulation
Involves using different sources of information in order to increase the validity of a study
These sources are likely to be stakeholders in a program - participants, other researchers, program staff, other community members, and so on.
Then we put all data in single framework & apply various statistical tools to find out the dynamic on the market.
During the analysis stage, feedback from the stakeholder groups would be compared to determine areas of agreement as well as areas of divergence