

Key Insights
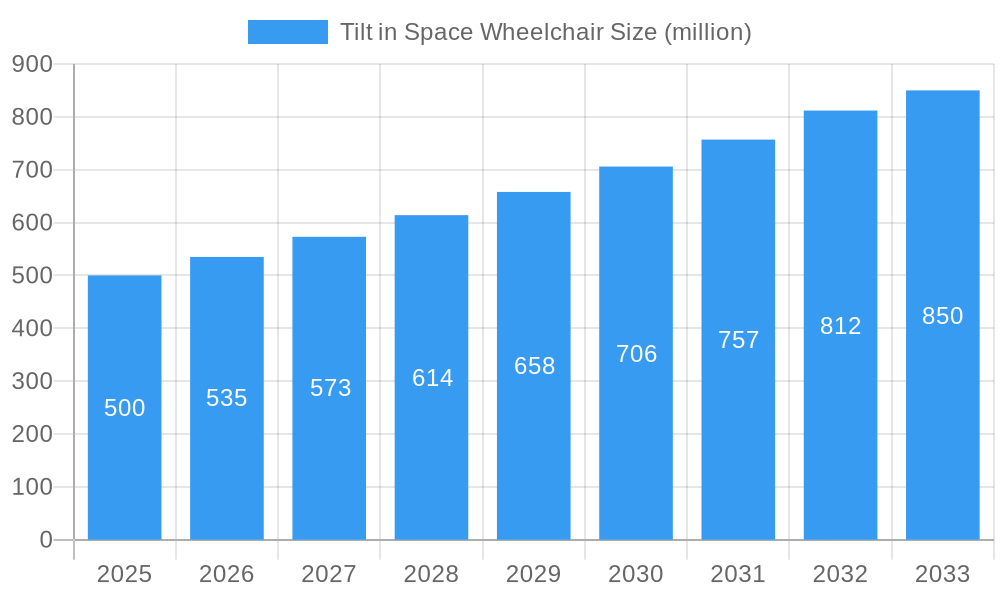
The global tilt-in-space wheelchair market is experiencing robust growth, driven by an aging population, increasing prevalence of neurological disorders, and rising demand for advanced assistive technologies. The market, estimated at $500 million in 2025, is projected to exhibit a Compound Annual Growth Rate (CAGR) of 7% from 2025 to 2033, reaching approximately $850 million by 2033. This growth is fueled by several key factors. Technological advancements are leading to lighter, more comfortable, and easier-to-maneuver tilt-in-space wheelchairs, improving user experience and increasing adoption. Furthermore, greater awareness of the benefits of these wheelchairs among healthcare professionals and patients is contributing to market expansion. The rising prevalence of conditions like cerebral palsy, multiple sclerosis, and spinal cord injuries significantly contributes to the demand for specialized wheelchairs that offer postural support and pressure relief, which are key features of tilt-in-space models. However, high costs associated with these wheelchairs and limited insurance coverage in certain regions remain significant restraints, potentially slowing market penetration in price-sensitive segments.
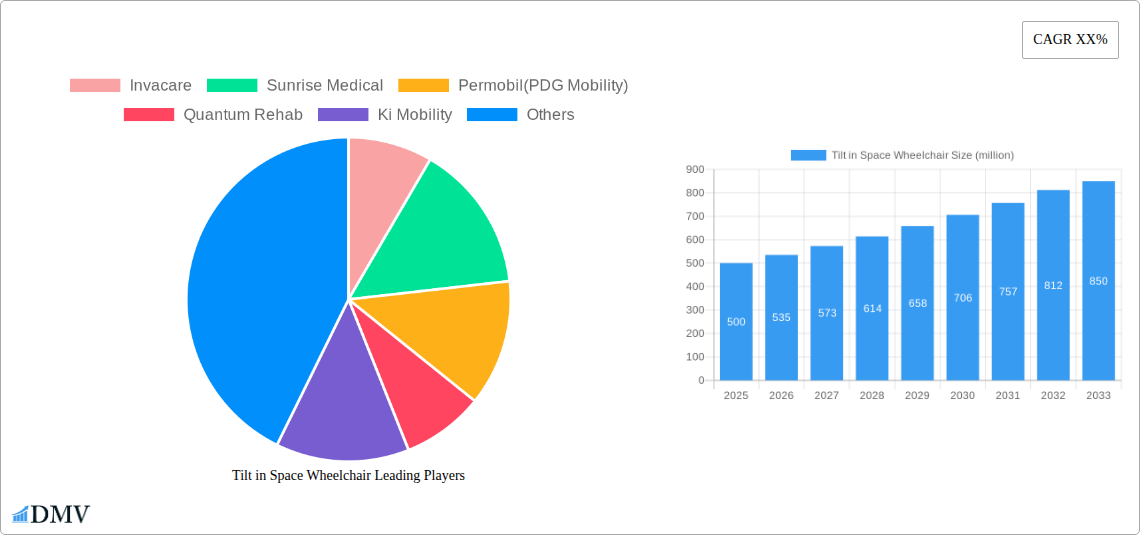
Tilt in Space Wheelchair Market Size (In Million)
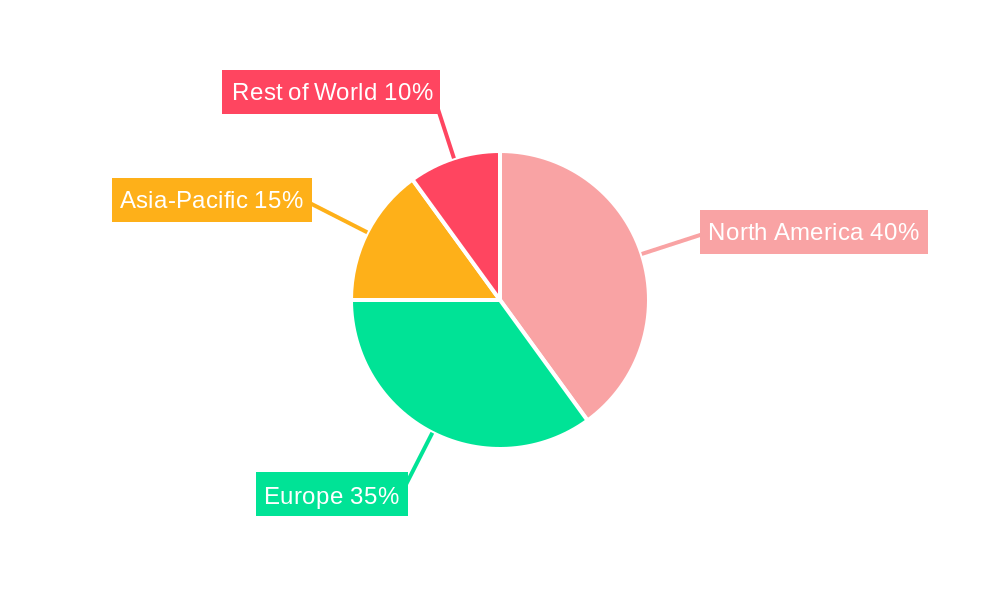
Market segmentation reveals a diverse landscape. Electric tilt-in-space wheelchairs are gaining traction owing to their enhanced functionality and user convenience, while manual models continue to cater to budget-conscious consumers. North America and Europe currently hold substantial market share, attributed to high healthcare expenditure and established assistive technology infrastructure. However, developing economies in Asia-Pacific are emerging as promising growth markets, driven by rising disposable incomes and improved healthcare accessibility. Key players like Invacare, Sunrise Medical, Permobil, and Quantum Rehab are engaged in intense competition, focusing on product innovation, strategic partnerships, and market expansion to consolidate their positions. Future growth will likely be influenced by regulatory changes, technological innovations in materials and design (e.g., lighter weight materials), and expanding healthcare insurance coverage for assistive devices.
Tilt in Space Wheelchair Company Market Share
Tilt in Space Wheelchair Market Report: A Comprehensive Analysis (2019-2033)
This insightful report provides a comprehensive analysis of the global Tilt in Space Wheelchair market, offering a detailed examination of market dynamics, technological advancements, and future growth opportunities. Valued at $XX million in 2025, the market is projected to reach $XX million by 2033, exhibiting a robust Compound Annual Growth Rate (CAGR) of XX% during the forecast period (2025-2033). This report covers the historical period (2019-2024), with 2025 serving as the base year and estimated year. The analysis encompasses key market segments, leading players, and emerging trends shaping this crucial sector of the healthcare industry. Download now to gain a strategic advantage.
Tilt in Space Wheelchair Market Composition & Trends
The global tilt in space wheelchair market exhibits a moderately concentrated landscape, with key players like Invacare, Sunrise Medical, and Permobil holding significant market share. The market share distribution in 2025 is estimated as follows: Invacare (XX%), Sunrise Medical (XX%), Permobil (XX%), and others (XX%). Innovation is a key driver, with manufacturers continually improving functionalities, materials, and design to enhance user comfort and accessibility. Regulatory landscapes vary across regions, influencing product approvals and market access. Substitute products, such as specialized seating systems, pose a competitive challenge. The primary end-users are individuals with mobility impairments, hospitals, and rehabilitation centers. M&A activity within the sector remains moderate, with total deal values exceeding $XX million in the past five years. Notable transactions include [Insert Specific M&A examples with deal values if available, otherwise state "Data unavailable"].
- Market Concentration: Moderately concentrated, dominated by a few major players.
- Innovation Catalysts: Advancements in materials, technology, and design for enhanced comfort and functionality.
- Regulatory Landscape: Varies by region, influencing market access and product approvals.
- Substitute Products: Specialized seating systems and other assistive devices.
- End-User Profile: Individuals with mobility impairments, hospitals, and rehabilitation centers.
- M&A Activity: Moderate activity, with total deal values exceeding $XX million (2019-2024).
Tilt in Space Wheelchair Industry Evolution
The tilt in space wheelchair market has experienced significant growth over the past five years, driven by increasing prevalence of mobility impairments, rising healthcare expenditure, and technological advancements. The market witnessed a CAGR of XX% from 2019 to 2024, reaching $XX million in 2024. Technological improvements, such as the incorporation of lightweight materials, advanced seating systems, and electronic controls, have significantly enhanced product functionality and user experience. Consumer demands are shifting towards customized and technologically advanced wheelchairs, creating opportunities for niche players and fostering innovation. The adoption rate of tilt-in-space wheelchairs is increasing steadily, particularly in developed nations with robust healthcare infrastructure. Future growth will be further fueled by aging populations, improved healthcare access, and rising disposable incomes in developing economies.
Leading Regions, Countries, or Segments in Tilt in Space Wheelchair
North America currently dominates the global tilt in space wheelchair market, accounting for approximately XX% of the total market value in 2025. This dominance stems from several key factors:
- High Healthcare Expenditure: Significant investments in healthcare infrastructure and assistive devices.
- Strong Regulatory Support: Favorable regulatory environment encouraging adoption and innovation.
- High Prevalence of Mobility Impairments: Growing aging population and increasing incidence of chronic diseases.
- Advanced Healthcare Infrastructure: Well-established distribution networks and healthcare professionals.
- Technological Advancement: Strong presence of manufacturers and innovation hubs.
Europe and Asia-Pacific follow, with significant growth potential driven by increasing awareness, rising disposable incomes, and improving healthcare access.
Tilt in Space Wheelchair Product Innovations
Recent innovations in tilt-in-space wheelchairs include the integration of advanced pressure-relieving systems, improved postural support mechanisms, and lightweight yet durable frame materials. These advancements significantly enhance user comfort, reduce the risk of pressure sores, and improve overall mobility. Unique selling propositions often include features such as customized seating options, electronic controls, and enhanced maneuverability. The incorporation of smart technology, including connectivity features and data tracking capabilities, is also becoming increasingly prevalent.
Propelling Factors for Tilt in Space Wheelchair Growth
Several factors are driving the growth of the tilt in space wheelchair market. These include:
- Technological Advancements: Development of lightweight, durable, and user-friendly designs.
- Rising Healthcare Expenditure: Increased investments in assistive technologies globally.
- Aging Population: The global population is aging rapidly, leading to a higher demand for mobility aids.
- Favorable Government Regulations: Support for assistive technology adoption in many regions.
Obstacles in the Tilt in Space Wheelchair Market
Despite the growth potential, the market faces several challenges:
- High Cost of Wheelchairs: The high price can limit accessibility for many individuals.
- Supply Chain Disruptions: Global supply chain issues can impact production and availability.
- Stringent Regulatory Approvals: Complex regulations can slow down product launch and market entry.
- Intense Competition: The market is characterized by intense competition among established players and emerging companies.
Future Opportunities in Tilt in Space Wheelchair
Future opportunities lie in:
- Smart Wheelchair Technology: Integration of smart features to enhance user experience and monitoring.
- Expansion into Emerging Markets: Untapped potential in developing economies with growing healthcare needs.
- Development of Customized Solutions: Tailored wheelchairs to meet diverse individual needs and preferences.
- Enhanced Durability and Lightweighting: Continued advancements in materials science to improve product longevity and ease of use.
Major Players in the Tilt in Space Wheelchair Ecosystem
- Invacare
- Sunrise Medical
- Permobil (PDG Mobility)
- Quantum Rehab
- Ki Mobility
- Ottobock
- SORG Rollstuhltechnik
- Aspire Rehab
- Broda
- Ormesa
- Inspired by Drive
- Graham-Field
- EV Rider
- Drive Medical
- Freedom Designs
- Karman Healthcare
- Progeo
- DNR Wheels
- HD Rehab
- MEYRA
Key Developments in Tilt in Space Wheelchair Industry
- 2022 Q3: Invacare launches a new line of lightweight tilt-in-space wheelchairs with improved maneuverability.
- 2021 Q4: Sunrise Medical acquires a smaller competitor, expanding its product portfolio.
- 2020 Q1: New safety regulations implemented in the European Union impacting wheelchair design and manufacturing.
- [Add more key developments with dates as available]
Strategic Tilt in Space Wheelchair Market Forecast
The tilt in space wheelchair market is poised for continued growth, driven by technological innovation, rising healthcare expenditure, and a growing elderly population. Future opportunities lie in developing smart wheelchairs, expanding into emerging markets, and customizing products to meet diverse individual needs. The market is expected to witness substantial growth in the coming years, with significant potential for market expansion and value creation for stakeholders.
Tilt in Space Wheelchair Segmentation
-
1. Application
- 1.1. Adult
- 1.2. Children
-
2. Types
- 2.1. Manual Tilt Wheelchairs
- 2.2. Power Tilt Wheelchairs
Tilt in Space Wheelchair Segmentation By Geography
-
1. North America
- 1.1. United States
- 1.2. Canada
- 1.3. Mexico
-
2. South America
- 2.1. Brazil
- 2.2. Argentina
- 2.3. Rest of South America
-
3. Europe
- 3.1. United Kingdom
- 3.2. Germany
- 3.3. France
- 3.4. Italy
- 3.5. Spain
- 3.6. Russia
- 3.7. Benelux
- 3.8. Nordics
- 3.9. Rest of Europe
-
4. Middle East & Africa
- 4.1. Turkey
- 4.2. Israel
- 4.3. GCC
- 4.4. North Africa
- 4.5. South Africa
- 4.6. Rest of Middle East & Africa
-
5. Asia Pacific
- 5.1. China
- 5.2. India
- 5.3. Japan
- 5.4. South Korea
- 5.5. ASEAN
- 5.6. Oceania
- 5.7. Rest of Asia Pacific
Tilt in Space Wheelchair Regional Market Share
Geographic Coverage of Tilt in Space Wheelchair
Tilt in Space Wheelchair REPORT HIGHLIGHTS
| Aspects | Details |
|---|---|
| Study Period | 2020-2034 |
| Base Year | 2025 |
| Estimated Year | 2026 |
| Forecast Period | 2026-2034 |
| Historical Period | 2020-2025 |
| Growth Rate | CAGR of 10.1% from 2020-2034 |
| Segmentation |
|
Table of Contents
- 1. Introduction
- 1.1. Research Scope
- 1.2. Market Segmentation
- 1.3. Research Methodology
- 1.4. Definitions and Assumptions
- 2. Executive Summary
- 2.1. Introduction
- 3. Market Dynamics
- 3.1. Introduction
- 3.2. Market Drivers
- 3.3. Market Restrains
- 3.4. Market Trends
- 4. Market Factor Analysis
- 4.1. Porters Five Forces
- 4.2. Supply/Value Chain
- 4.3. PESTEL analysis
- 4.4. Market Entropy
- 4.5. Patent/Trademark Analysis
- 5. Global Tilt in Space Wheelchair Analysis, Insights and Forecast, 2020-2032
- 5.1. Market Analysis, Insights and Forecast - by Application
- 5.1.1. Adult
- 5.1.2. Children
- 5.2. Market Analysis, Insights and Forecast - by Types
- 5.2.1. Manual Tilt Wheelchairs
- 5.2.2. Power Tilt Wheelchairs
- 5.3. Market Analysis, Insights and Forecast - by Region
- 5.3.1. North America
- 5.3.2. South America
- 5.3.3. Europe
- 5.3.4. Middle East & Africa
- 5.3.5. Asia Pacific
- 5.1. Market Analysis, Insights and Forecast - by Application
- 6. North America Tilt in Space Wheelchair Analysis, Insights and Forecast, 2020-2032
- 6.1. Market Analysis, Insights and Forecast - by Application
- 6.1.1. Adult
- 6.1.2. Children
- 6.2. Market Analysis, Insights and Forecast - by Types
- 6.2.1. Manual Tilt Wheelchairs
- 6.2.2. Power Tilt Wheelchairs
- 6.1. Market Analysis, Insights and Forecast - by Application
- 7. South America Tilt in Space Wheelchair Analysis, Insights and Forecast, 2020-2032
- 7.1. Market Analysis, Insights and Forecast - by Application
- 7.1.1. Adult
- 7.1.2. Children
- 7.2. Market Analysis, Insights and Forecast - by Types
- 7.2.1. Manual Tilt Wheelchairs
- 7.2.2. Power Tilt Wheelchairs
- 7.1. Market Analysis, Insights and Forecast - by Application
- 8. Europe Tilt in Space Wheelchair Analysis, Insights and Forecast, 2020-2032
- 8.1. Market Analysis, Insights and Forecast - by Application
- 8.1.1. Adult
- 8.1.2. Children
- 8.2. Market Analysis, Insights and Forecast - by Types
- 8.2.1. Manual Tilt Wheelchairs
- 8.2.2. Power Tilt Wheelchairs
- 8.1. Market Analysis, Insights and Forecast - by Application
- 9. Middle East & Africa Tilt in Space Wheelchair Analysis, Insights and Forecast, 2020-2032
- 9.1. Market Analysis, Insights and Forecast - by Application
- 9.1.1. Adult
- 9.1.2. Children
- 9.2. Market Analysis, Insights and Forecast - by Types
- 9.2.1. Manual Tilt Wheelchairs
- 9.2.2. Power Tilt Wheelchairs
- 9.1. Market Analysis, Insights and Forecast - by Application
- 10. Asia Pacific Tilt in Space Wheelchair Analysis, Insights and Forecast, 2020-2032
- 10.1. Market Analysis, Insights and Forecast - by Application
- 10.1.1. Adult
- 10.1.2. Children
- 10.2. Market Analysis, Insights and Forecast - by Types
- 10.2.1. Manual Tilt Wheelchairs
- 10.2.2. Power Tilt Wheelchairs
- 10.1. Market Analysis, Insights and Forecast - by Application
- 11. Competitive Analysis
- 11.1. Global Market Share Analysis 2025
- 11.2. Company Profiles
- 11.2.1 Invacare
- 11.2.1.1. Overview
- 11.2.1.2. Products
- 11.2.1.3. SWOT Analysis
- 11.2.1.4. Recent Developments
- 11.2.1.5. Financials (Based on Availability)
- 11.2.2 Sunrise Medical
- 11.2.2.1. Overview
- 11.2.2.2. Products
- 11.2.2.3. SWOT Analysis
- 11.2.2.4. Recent Developments
- 11.2.2.5. Financials (Based on Availability)
- 11.2.3 Permobil(PDG Mobility)
- 11.2.3.1. Overview
- 11.2.3.2. Products
- 11.2.3.3. SWOT Analysis
- 11.2.3.4. Recent Developments
- 11.2.3.5. Financials (Based on Availability)
- 11.2.4 Quantum Rehab
- 11.2.4.1. Overview
- 11.2.4.2. Products
- 11.2.4.3. SWOT Analysis
- 11.2.4.4. Recent Developments
- 11.2.4.5. Financials (Based on Availability)
- 11.2.5 Ki Mobility
- 11.2.5.1. Overview
- 11.2.5.2. Products
- 11.2.5.3. SWOT Analysis
- 11.2.5.4. Recent Developments
- 11.2.5.5. Financials (Based on Availability)
- 11.2.6 Ottobock
- 11.2.6.1. Overview
- 11.2.6.2. Products
- 11.2.6.3. SWOT Analysis
- 11.2.6.4. Recent Developments
- 11.2.6.5. Financials (Based on Availability)
- 11.2.7 SORG Rollstuhltechnik
- 11.2.7.1. Overview
- 11.2.7.2. Products
- 11.2.7.3. SWOT Analysis
- 11.2.7.4. Recent Developments
- 11.2.7.5. Financials (Based on Availability)
- 11.2.8 Aspire Rehab
- 11.2.8.1. Overview
- 11.2.8.2. Products
- 11.2.8.3. SWOT Analysis
- 11.2.8.4. Recent Developments
- 11.2.8.5. Financials (Based on Availability)
- 11.2.9 Broda
- 11.2.9.1. Overview
- 11.2.9.2. Products
- 11.2.9.3. SWOT Analysis
- 11.2.9.4. Recent Developments
- 11.2.9.5. Financials (Based on Availability)
- 11.2.10 Ormesa
- 11.2.10.1. Overview
- 11.2.10.2. Products
- 11.2.10.3. SWOT Analysis
- 11.2.10.4. Recent Developments
- 11.2.10.5. Financials (Based on Availability)
- 11.2.11 Inspired by Drive
- 11.2.11.1. Overview
- 11.2.11.2. Products
- 11.2.11.3. SWOT Analysis
- 11.2.11.4. Recent Developments
- 11.2.11.5. Financials (Based on Availability)
- 11.2.12 Graham-Field
- 11.2.12.1. Overview
- 11.2.12.2. Products
- 11.2.12.3. SWOT Analysis
- 11.2.12.4. Recent Developments
- 11.2.12.5. Financials (Based on Availability)
- 11.2.13 EV Rider
- 11.2.13.1. Overview
- 11.2.13.2. Products
- 11.2.13.3. SWOT Analysis
- 11.2.13.4. Recent Developments
- 11.2.13.5. Financials (Based on Availability)
- 11.2.14 Drive Medical
- 11.2.14.1. Overview
- 11.2.14.2. Products
- 11.2.14.3. SWOT Analysis
- 11.2.14.4. Recent Developments
- 11.2.14.5. Financials (Based on Availability)
- 11.2.15 Freedom Designs
- 11.2.15.1. Overview
- 11.2.15.2. Products
- 11.2.15.3. SWOT Analysis
- 11.2.15.4. Recent Developments
- 11.2.15.5. Financials (Based on Availability)
- 11.2.16 Karman Healthcare
- 11.2.16.1. Overview
- 11.2.16.2. Products
- 11.2.16.3. SWOT Analysis
- 11.2.16.4. Recent Developments
- 11.2.16.5. Financials (Based on Availability)
- 11.2.17 Progeo
- 11.2.17.1. Overview
- 11.2.17.2. Products
- 11.2.17.3. SWOT Analysis
- 11.2.17.4. Recent Developments
- 11.2.17.5. Financials (Based on Availability)
- 11.2.18 DNR Wheels
- 11.2.18.1. Overview
- 11.2.18.2. Products
- 11.2.18.3. SWOT Analysis
- 11.2.18.4. Recent Developments
- 11.2.18.5. Financials (Based on Availability)
- 11.2.19 HD Rehab
- 11.2.19.1. Overview
- 11.2.19.2. Products
- 11.2.19.3. SWOT Analysis
- 11.2.19.4. Recent Developments
- 11.2.19.5. Financials (Based on Availability)
- 11.2.20 MEYRA
- 11.2.20.1. Overview
- 11.2.20.2. Products
- 11.2.20.3. SWOT Analysis
- 11.2.20.4. Recent Developments
- 11.2.20.5. Financials (Based on Availability)
- 11.2.1 Invacare
List of Figures
- Figure 1: Global Tilt in Space Wheelchair Revenue Breakdown (undefined, %) by Region 2025 & 2033
- Figure 2: Global Tilt in Space Wheelchair Volume Breakdown (K, %) by Region 2025 & 2033
- Figure 3: North America Tilt in Space Wheelchair Revenue (undefined), by Application 2025 & 2033
- Figure 4: North America Tilt in Space Wheelchair Volume (K), by Application 2025 & 2033
- Figure 5: North America Tilt in Space Wheelchair Revenue Share (%), by Application 2025 & 2033
- Figure 6: North America Tilt in Space Wheelchair Volume Share (%), by Application 2025 & 2033
- Figure 7: North America Tilt in Space Wheelchair Revenue (undefined), by Types 2025 & 2033
- Figure 8: North America Tilt in Space Wheelchair Volume (K), by Types 2025 & 2033
- Figure 9: North America Tilt in Space Wheelchair Revenue Share (%), by Types 2025 & 2033
- Figure 10: North America Tilt in Space Wheelchair Volume Share (%), by Types 2025 & 2033
- Figure 11: North America Tilt in Space Wheelchair Revenue (undefined), by Country 2025 & 2033
- Figure 12: North America Tilt in Space Wheelchair Volume (K), by Country 2025 & 2033
- Figure 13: North America Tilt in Space Wheelchair Revenue Share (%), by Country 2025 & 2033
- Figure 14: North America Tilt in Space Wheelchair Volume Share (%), by Country 2025 & 2033
- Figure 15: South America Tilt in Space Wheelchair Revenue (undefined), by Application 2025 & 2033
- Figure 16: South America Tilt in Space Wheelchair Volume (K), by Application 2025 & 2033
- Figure 17: South America Tilt in Space Wheelchair Revenue Share (%), by Application 2025 & 2033
- Figure 18: South America Tilt in Space Wheelchair Volume Share (%), by Application 2025 & 2033
- Figure 19: South America Tilt in Space Wheelchair Revenue (undefined), by Types 2025 & 2033
- Figure 20: South America Tilt in Space Wheelchair Volume (K), by Types 2025 & 2033
- Figure 21: South America Tilt in Space Wheelchair Revenue Share (%), by Types 2025 & 2033
- Figure 22: South America Tilt in Space Wheelchair Volume Share (%), by Types 2025 & 2033
- Figure 23: South America Tilt in Space Wheelchair Revenue (undefined), by Country 2025 & 2033
- Figure 24: South America Tilt in Space Wheelchair Volume (K), by Country 2025 & 2033
- Figure 25: South America Tilt in Space Wheelchair Revenue Share (%), by Country 2025 & 2033
- Figure 26: South America Tilt in Space Wheelchair Volume Share (%), by Country 2025 & 2033
- Figure 27: Europe Tilt in Space Wheelchair Revenue (undefined), by Application 2025 & 2033
- Figure 28: Europe Tilt in Space Wheelchair Volume (K), by Application 2025 & 2033
- Figure 29: Europe Tilt in Space Wheelchair Revenue Share (%), by Application 2025 & 2033
- Figure 30: Europe Tilt in Space Wheelchair Volume Share (%), by Application 2025 & 2033
- Figure 31: Europe Tilt in Space Wheelchair Revenue (undefined), by Types 2025 & 2033
- Figure 32: Europe Tilt in Space Wheelchair Volume (K), by Types 2025 & 2033
- Figure 33: Europe Tilt in Space Wheelchair Revenue Share (%), by Types 2025 & 2033
- Figure 34: Europe Tilt in Space Wheelchair Volume Share (%), by Types 2025 & 2033
- Figure 35: Europe Tilt in Space Wheelchair Revenue (undefined), by Country 2025 & 2033
- Figure 36: Europe Tilt in Space Wheelchair Volume (K), by Country 2025 & 2033
- Figure 37: Europe Tilt in Space Wheelchair Revenue Share (%), by Country 2025 & 2033
- Figure 38: Europe Tilt in Space Wheelchair Volume Share (%), by Country 2025 & 2033
- Figure 39: Middle East & Africa Tilt in Space Wheelchair Revenue (undefined), by Application 2025 & 2033
- Figure 40: Middle East & Africa Tilt in Space Wheelchair Volume (K), by Application 2025 & 2033
- Figure 41: Middle East & Africa Tilt in Space Wheelchair Revenue Share (%), by Application 2025 & 2033
- Figure 42: Middle East & Africa Tilt in Space Wheelchair Volume Share (%), by Application 2025 & 2033
- Figure 43: Middle East & Africa Tilt in Space Wheelchair Revenue (undefined), by Types 2025 & 2033
- Figure 44: Middle East & Africa Tilt in Space Wheelchair Volume (K), by Types 2025 & 2033
- Figure 45: Middle East & Africa Tilt in Space Wheelchair Revenue Share (%), by Types 2025 & 2033
- Figure 46: Middle East & Africa Tilt in Space Wheelchair Volume Share (%), by Types 2025 & 2033
- Figure 47: Middle East & Africa Tilt in Space Wheelchair Revenue (undefined), by Country 2025 & 2033
- Figure 48: Middle East & Africa Tilt in Space Wheelchair Volume (K), by Country 2025 & 2033
- Figure 49: Middle East & Africa Tilt in Space Wheelchair Revenue Share (%), by Country 2025 & 2033
- Figure 50: Middle East & Africa Tilt in Space Wheelchair Volume Share (%), by Country 2025 & 2033
- Figure 51: Asia Pacific Tilt in Space Wheelchair Revenue (undefined), by Application 2025 & 2033
- Figure 52: Asia Pacific Tilt in Space Wheelchair Volume (K), by Application 2025 & 2033
- Figure 53: Asia Pacific Tilt in Space Wheelchair Revenue Share (%), by Application 2025 & 2033
- Figure 54: Asia Pacific Tilt in Space Wheelchair Volume Share (%), by Application 2025 & 2033
- Figure 55: Asia Pacific Tilt in Space Wheelchair Revenue (undefined), by Types 2025 & 2033
- Figure 56: Asia Pacific Tilt in Space Wheelchair Volume (K), by Types 2025 & 2033
- Figure 57: Asia Pacific Tilt in Space Wheelchair Revenue Share (%), by Types 2025 & 2033
- Figure 58: Asia Pacific Tilt in Space Wheelchair Volume Share (%), by Types 2025 & 2033
- Figure 59: Asia Pacific Tilt in Space Wheelchair Revenue (undefined), by Country 2025 & 2033
- Figure 60: Asia Pacific Tilt in Space Wheelchair Volume (K), by Country 2025 & 2033
- Figure 61: Asia Pacific Tilt in Space Wheelchair Revenue Share (%), by Country 2025 & 2033
- Figure 62: Asia Pacific Tilt in Space Wheelchair Volume Share (%), by Country 2025 & 2033
List of Tables
- Table 1: Global Tilt in Space Wheelchair Revenue undefined Forecast, by Application 2020 & 2033
- Table 2: Global Tilt in Space Wheelchair Volume K Forecast, by Application 2020 & 2033
- Table 3: Global Tilt in Space Wheelchair Revenue undefined Forecast, by Types 2020 & 2033
- Table 4: Global Tilt in Space Wheelchair Volume K Forecast, by Types 2020 & 2033
- Table 5: Global Tilt in Space Wheelchair Revenue undefined Forecast, by Region 2020 & 2033
- Table 6: Global Tilt in Space Wheelchair Volume K Forecast, by Region 2020 & 2033
- Table 7: Global Tilt in Space Wheelchair Revenue undefined Forecast, by Application 2020 & 2033
- Table 8: Global Tilt in Space Wheelchair Volume K Forecast, by Application 2020 & 2033
- Table 9: Global Tilt in Space Wheelchair Revenue undefined Forecast, by Types 2020 & 2033
- Table 10: Global Tilt in Space Wheelchair Volume K Forecast, by Types 2020 & 2033
- Table 11: Global Tilt in Space Wheelchair Revenue undefined Forecast, by Country 2020 & 2033
- Table 12: Global Tilt in Space Wheelchair Volume K Forecast, by Country 2020 & 2033
- Table 13: United States Tilt in Space Wheelchair Revenue (undefined) Forecast, by Application 2020 & 2033
- Table 14: United States Tilt in Space Wheelchair Volume (K) Forecast, by Application 2020 & 2033
- Table 15: Canada Tilt in Space Wheelchair Revenue (undefined) Forecast, by Application 2020 & 2033
- Table 16: Canada Tilt in Space Wheelchair Volume (K) Forecast, by Application 2020 & 2033
- Table 17: Mexico Tilt in Space Wheelchair Revenue (undefined) Forecast, by Application 2020 & 2033
- Table 18: Mexico Tilt in Space Wheelchair Volume (K) Forecast, by Application 2020 & 2033
- Table 19: Global Tilt in Space Wheelchair Revenue undefined Forecast, by Application 2020 & 2033
- Table 20: Global Tilt in Space Wheelchair Volume K Forecast, by Application 2020 & 2033
- Table 21: Global Tilt in Space Wheelchair Revenue undefined Forecast, by Types 2020 & 2033
- Table 22: Global Tilt in Space Wheelchair Volume K Forecast, by Types 2020 & 2033
- Table 23: Global Tilt in Space Wheelchair Revenue undefined Forecast, by Country 2020 & 2033
- Table 24: Global Tilt in Space Wheelchair Volume K Forecast, by Country 2020 & 2033
- Table 25: Brazil Tilt in Space Wheelchair Revenue (undefined) Forecast, by Application 2020 & 2033
- Table 26: Brazil Tilt in Space Wheelchair Volume (K) Forecast, by Application 2020 & 2033
- Table 27: Argentina Tilt in Space Wheelchair Revenue (undefined) Forecast, by Application 2020 & 2033
- Table 28: Argentina Tilt in Space Wheelchair Volume (K) Forecast, by Application 2020 & 2033
- Table 29: Rest of South America Tilt in Space Wheelchair Revenue (undefined) Forecast, by Application 2020 & 2033
- Table 30: Rest of South America Tilt in Space Wheelchair Volume (K) Forecast, by Application 2020 & 2033
- Table 31: Global Tilt in Space Wheelchair Revenue undefined Forecast, by Application 2020 & 2033
- Table 32: Global Tilt in Space Wheelchair Volume K Forecast, by Application 2020 & 2033
- Table 33: Global Tilt in Space Wheelchair Revenue undefined Forecast, by Types 2020 & 2033
- Table 34: Global Tilt in Space Wheelchair Volume K Forecast, by Types 2020 & 2033
- Table 35: Global Tilt in Space Wheelchair Revenue undefined Forecast, by Country 2020 & 2033
- Table 36: Global Tilt in Space Wheelchair Volume K Forecast, by Country 2020 & 2033
- Table 37: United Kingdom Tilt in Space Wheelchair Revenue (undefined) Forecast, by Application 2020 & 2033
- Table 38: United Kingdom Tilt in Space Wheelchair Volume (K) Forecast, by Application 2020 & 2033
- Table 39: Germany Tilt in Space Wheelchair Revenue (undefined) Forecast, by Application 2020 & 2033
- Table 40: Germany Tilt in Space Wheelchair Volume (K) Forecast, by Application 2020 & 2033
- Table 41: France Tilt in Space Wheelchair Revenue (undefined) Forecast, by Application 2020 & 2033
- Table 42: France Tilt in Space Wheelchair Volume (K) Forecast, by Application 2020 & 2033
- Table 43: Italy Tilt in Space Wheelchair Revenue (undefined) Forecast, by Application 2020 & 2033
- Table 44: Italy Tilt in Space Wheelchair Volume (K) Forecast, by Application 2020 & 2033
- Table 45: Spain Tilt in Space Wheelchair Revenue (undefined) Forecast, by Application 2020 & 2033
- Table 46: Spain Tilt in Space Wheelchair Volume (K) Forecast, by Application 2020 & 2033
- Table 47: Russia Tilt in Space Wheelchair Revenue (undefined) Forecast, by Application 2020 & 2033
- Table 48: Russia Tilt in Space Wheelchair Volume (K) Forecast, by Application 2020 & 2033
- Table 49: Benelux Tilt in Space Wheelchair Revenue (undefined) Forecast, by Application 2020 & 2033
- Table 50: Benelux Tilt in Space Wheelchair Volume (K) Forecast, by Application 2020 & 2033
- Table 51: Nordics Tilt in Space Wheelchair Revenue (undefined) Forecast, by Application 2020 & 2033
- Table 52: Nordics Tilt in Space Wheelchair Volume (K) Forecast, by Application 2020 & 2033
- Table 53: Rest of Europe Tilt in Space Wheelchair Revenue (undefined) Forecast, by Application 2020 & 2033
- Table 54: Rest of Europe Tilt in Space Wheelchair Volume (K) Forecast, by Application 2020 & 2033
- Table 55: Global Tilt in Space Wheelchair Revenue undefined Forecast, by Application 2020 & 2033
- Table 56: Global Tilt in Space Wheelchair Volume K Forecast, by Application 2020 & 2033
- Table 57: Global Tilt in Space Wheelchair Revenue undefined Forecast, by Types 2020 & 2033
- Table 58: Global Tilt in Space Wheelchair Volume K Forecast, by Types 2020 & 2033
- Table 59: Global Tilt in Space Wheelchair Revenue undefined Forecast, by Country 2020 & 2033
- Table 60: Global Tilt in Space Wheelchair Volume K Forecast, by Country 2020 & 2033
- Table 61: Turkey Tilt in Space Wheelchair Revenue (undefined) Forecast, by Application 2020 & 2033
- Table 62: Turkey Tilt in Space Wheelchair Volume (K) Forecast, by Application 2020 & 2033
- Table 63: Israel Tilt in Space Wheelchair Revenue (undefined) Forecast, by Application 2020 & 2033
- Table 64: Israel Tilt in Space Wheelchair Volume (K) Forecast, by Application 2020 & 2033
- Table 65: GCC Tilt in Space Wheelchair Revenue (undefined) Forecast, by Application 2020 & 2033
- Table 66: GCC Tilt in Space Wheelchair Volume (K) Forecast, by Application 2020 & 2033
- Table 67: North Africa Tilt in Space Wheelchair Revenue (undefined) Forecast, by Application 2020 & 2033
- Table 68: North Africa Tilt in Space Wheelchair Volume (K) Forecast, by Application 2020 & 2033
- Table 69: South Africa Tilt in Space Wheelchair Revenue (undefined) Forecast, by Application 2020 & 2033
- Table 70: South Africa Tilt in Space Wheelchair Volume (K) Forecast, by Application 2020 & 2033
- Table 71: Rest of Middle East & Africa Tilt in Space Wheelchair Revenue (undefined) Forecast, by Application 2020 & 2033
- Table 72: Rest of Middle East & Africa Tilt in Space Wheelchair Volume (K) Forecast, by Application 2020 & 2033
- Table 73: Global Tilt in Space Wheelchair Revenue undefined Forecast, by Application 2020 & 2033
- Table 74: Global Tilt in Space Wheelchair Volume K Forecast, by Application 2020 & 2033
- Table 75: Global Tilt in Space Wheelchair Revenue undefined Forecast, by Types 2020 & 2033
- Table 76: Global Tilt in Space Wheelchair Volume K Forecast, by Types 2020 & 2033
- Table 77: Global Tilt in Space Wheelchair Revenue undefined Forecast, by Country 2020 & 2033
- Table 78: Global Tilt in Space Wheelchair Volume K Forecast, by Country 2020 & 2033
- Table 79: China Tilt in Space Wheelchair Revenue (undefined) Forecast, by Application 2020 & 2033
- Table 80: China Tilt in Space Wheelchair Volume (K) Forecast, by Application 2020 & 2033
- Table 81: India Tilt in Space Wheelchair Revenue (undefined) Forecast, by Application 2020 & 2033
- Table 82: India Tilt in Space Wheelchair Volume (K) Forecast, by Application 2020 & 2033
- Table 83: Japan Tilt in Space Wheelchair Revenue (undefined) Forecast, by Application 2020 & 2033
- Table 84: Japan Tilt in Space Wheelchair Volume (K) Forecast, by Application 2020 & 2033
- Table 85: South Korea Tilt in Space Wheelchair Revenue (undefined) Forecast, by Application 2020 & 2033
- Table 86: South Korea Tilt in Space Wheelchair Volume (K) Forecast, by Application 2020 & 2033
- Table 87: ASEAN Tilt in Space Wheelchair Revenue (undefined) Forecast, by Application 2020 & 2033
- Table 88: ASEAN Tilt in Space Wheelchair Volume (K) Forecast, by Application 2020 & 2033
- Table 89: Oceania Tilt in Space Wheelchair Revenue (undefined) Forecast, by Application 2020 & 2033
- Table 90: Oceania Tilt in Space Wheelchair Volume (K) Forecast, by Application 2020 & 2033
- Table 91: Rest of Asia Pacific Tilt in Space Wheelchair Revenue (undefined) Forecast, by Application 2020 & 2033
- Table 92: Rest of Asia Pacific Tilt in Space Wheelchair Volume (K) Forecast, by Application 2020 & 2033
Frequently Asked Questions
1. What is the projected Compound Annual Growth Rate (CAGR) of the Tilt in Space Wheelchair?
The projected CAGR is approximately 10.1%.
2. Which companies are prominent players in the Tilt in Space Wheelchair?
Key companies in the market include Invacare, Sunrise Medical, Permobil(PDG Mobility), Quantum Rehab, Ki Mobility, Ottobock, SORG Rollstuhltechnik, Aspire Rehab, Broda, Ormesa, Inspired by Drive, Graham-Field, EV Rider, Drive Medical, Freedom Designs, Karman Healthcare, Progeo, DNR Wheels, HD Rehab, MEYRA.
3. What are the main segments of the Tilt in Space Wheelchair?
The market segments include Application, Types.
4. Can you provide details about the market size?
The market size is estimated to be USD XXX N/A as of 2022.
5. What are some drivers contributing to market growth?
N/A
6. What are the notable trends driving market growth?
N/A
7. Are there any restraints impacting market growth?
N/A
8. Can you provide examples of recent developments in the market?
N/A
9. What pricing options are available for accessing the report?
Pricing options include single-user, multi-user, and enterprise licenses priced at USD 3950.00, USD 5925.00, and USD 7900.00 respectively.
10. Is the market size provided in terms of value or volume?
The market size is provided in terms of value, measured in N/A and volume, measured in K.
11. Are there any specific market keywords associated with the report?
Yes, the market keyword associated with the report is "Tilt in Space Wheelchair," which aids in identifying and referencing the specific market segment covered.
12. How do I determine which pricing option suits my needs best?
The pricing options vary based on user requirements and access needs. Individual users may opt for single-user licenses, while businesses requiring broader access may choose multi-user or enterprise licenses for cost-effective access to the report.
13. Are there any additional resources or data provided in the Tilt in Space Wheelchair report?
While the report offers comprehensive insights, it's advisable to review the specific contents or supplementary materials provided to ascertain if additional resources or data are available.
14. How can I stay updated on further developments or reports in the Tilt in Space Wheelchair?
To stay informed about further developments, trends, and reports in the Tilt in Space Wheelchair, consider subscribing to industry newsletters, following relevant companies and organizations, or regularly checking reputable industry news sources and publications.
Methodology
Step 1 - Identification of Relevant Samples Size from Population Database


Step 2 - Approaches for Defining Global Market Size (Value, Volume* & Price*)

Note*: In applicable scenarios
Step 3 - Data Sources
Primary Research
- Web Analytics
- Survey Reports
- Research Institute
- Latest Research Reports
- Opinion Leaders
Secondary Research
- Annual Reports
- White Paper
- Latest Press Release
- Industry Association
- Paid Database
- Investor Presentations

Step 4 - Data Triangulation
Involves using different sources of information in order to increase the validity of a study
These sources are likely to be stakeholders in a program - participants, other researchers, program staff, other community members, and so on.
Then we put all data in single framework & apply various statistical tools to find out the dynamic on the market.
During the analysis stage, feedback from the stakeholder groups would be compared to determine areas of agreement as well as areas of divergence