

Key Insights
The global table tennis equipment market is experiencing robust growth, driven by increasing participation in the sport at both amateur and professional levels. The rising popularity of table tennis, fueled by its accessibility, affordability, and health benefits, is a key driver. Furthermore, advancements in technology are leading to the development of high-performance equipment, such as carbon fiber blades and innovative rubber materials, enhancing player experience and performance. This innovation, coupled with increased media coverage and the rise of online table tennis communities, fuels demand across various segments, including rackets, balls, nets, and tables. While the market faces some restraints, such as the cyclical nature of sporting goods demand and potential economic downturns impacting discretionary spending, the overall trajectory remains positive. We estimate the market size in 2025 to be approximately $800 million, with a Compound Annual Growth Rate (CAGR) of 5% projected through 2033. This growth will be propelled by sustained participation from existing players and the continued engagement of new enthusiasts, further driving the adoption of premium equipment and accessories. Key players like Butterfly, Double Happiness (DHS), and STIGA are expected to continue dominating the market, focusing on product innovation and strategic partnerships to maintain their competitive edge. Regional variations in market penetration are anticipated, with established markets in Asia experiencing continued growth alongside expansion in North America and Europe.
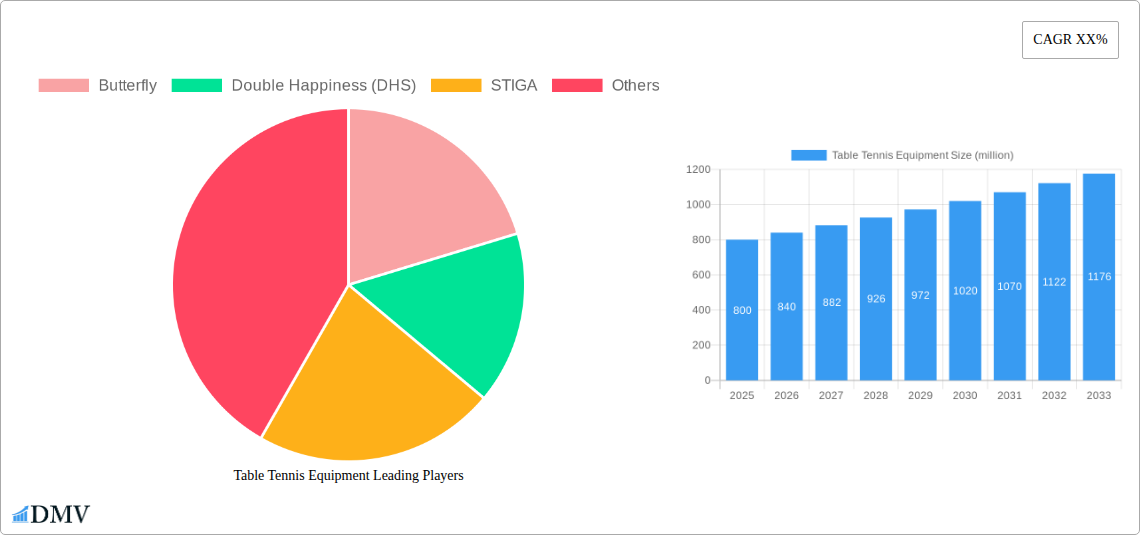
Table Tennis Equipment Market Size (In Million)
The market segmentation reveals a strong demand for high-performance rackets, which command a significant share of the market revenue. This is complemented by robust demand for balls and other accessories. Growth is also expected in the online retail segment, driven by the convenience of e-commerce and improved access to a wider range of equipment. To further capitalize on market opportunities, manufacturers are increasingly focusing on personalized equipment recommendations and targeted marketing campaigns based on player skill levels. The increasing integration of technology, such as data analysis tools that track player performance, is expected to improve the player experience and drive further growth. Sustainable manufacturing practices are gaining traction, with more companies incorporating eco-friendly materials and manufacturing processes. In summary, the table tennis equipment market presents a compelling investment opportunity with significant potential for growth and innovation in the coming decade.
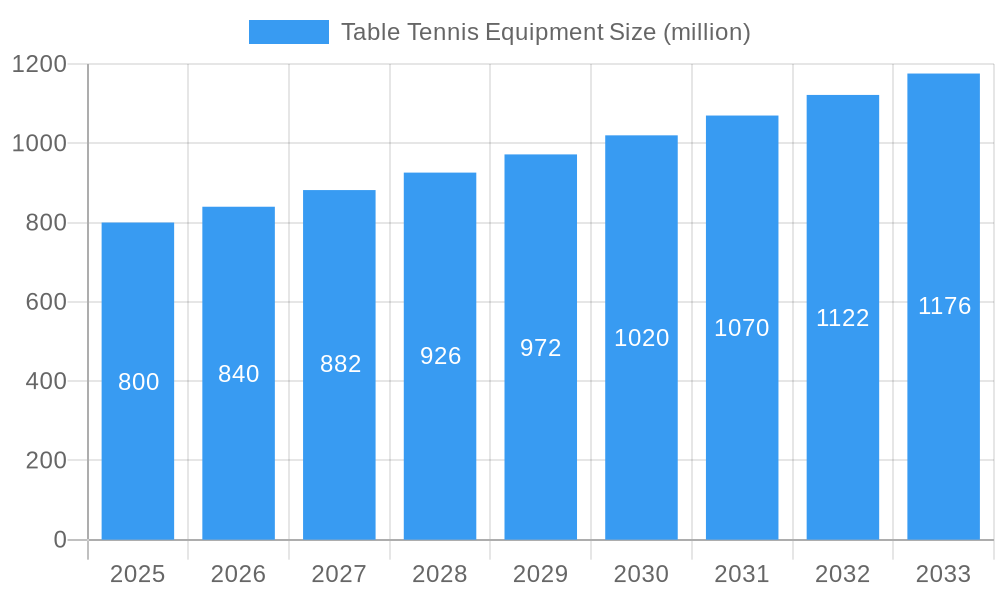
Table Tennis Equipment Company Market Share
Table Tennis Equipment Market: A Comprehensive Report (2019-2033)
This insightful report provides a detailed analysis of the global table tennis equipment market, projecting a market value exceeding $XX million by 2033. We delve into market dynamics, competitive landscapes, technological advancements, and future growth opportunities, offering crucial insights for stakeholders across the value chain. The study period covers 2019-2033, with 2025 serving as both the base and estimated year. This comprehensive analysis is essential for businesses seeking to navigate the complexities of this dynamic market and capitalize on emerging trends.
Table Tennis Equipment Market Composition & Trends
This section analyzes the competitive landscape of the table tennis equipment market, focusing on market concentration, innovation, regulatory factors, substitutes, end-users, and mergers and acquisitions (M&A) activities. The market exhibits a moderately concentrated structure, with key players like Butterfly, Double Happiness (DHS), and STIGA holding significant market share. However, the presence of numerous smaller regional players creates a competitive environment. Innovation in materials science (e.g., carbon fiber rackets) and technological integration (e.g., smart sensors in paddles) are driving market growth. Regulatory landscapes vary across regions, impacting material safety standards and import/export regulations. Substitute products, such as other recreational sports equipment, pose a mild competitive threat. The end-user base comprises professional athletes, amateur players, and recreational enthusiasts of varying skill levels. M&A activity within the market has been moderate, with deal values averaging approximately $XX million in recent years.
- Market Share Distribution (2024): Butterfly (30%), Double Happiness (DHS) (25%), STIGA (15%), Others (30%)
- Average M&A Deal Value (2019-2024): $XX million
- Key Innovation Catalysts: Advanced materials, smart technology integration.
- Major End-User Segments: Professional, amateur, recreational.
Table Tennis Equipment Industry Evolution
The table tennis equipment market has witnessed consistent growth over the historical period (2019-2024), driven by rising disposable incomes, increased participation in recreational sports, and technological advancements. The market experienced a Compound Annual Growth Rate (CAGR) of XX% during this period, reaching $XX million in 2024. Technological advancements, such as the introduction of new materials (e.g., Zylon fiber), improved blade designs, and enhanced rubber compounds, have significantly impacted performance and player preference. Consumer demand is shifting towards high-performance equipment, personalized customization options, and sustainable manufacturing practices. The forecast period (2025-2033) anticipates continued growth, projected at a CAGR of XX%, driven by factors such as increased global participation in table tennis and the expansion into emerging markets. Adoption of new technologies is expected to accelerate during this period, with smart sensors and data analytics becoming increasingly integrated into equipment.
Leading Regions, Countries, or Segments in Table Tennis Equipment
Asia, particularly China, dominates the global table tennis equipment market. This dominance stems from a strong domestic market driven by high participation rates, a well-established manufacturing base, and significant government investment in sports development. Europe and North America represent significant secondary markets, though with lower market penetration compared to Asia.
- Key Drivers of Asian Dominance:
- High participation rates in table tennis.
- Large-scale manufacturing capabilities.
- Government investment in sports infrastructure and talent development.
- Strong domestic brands like Double Happiness (DHS).
The market is segmented by product type (rackets, balls, nets, tables etc.), price point, and distribution channel (online, retail). The high-performance segment is experiencing the fastest growth, driven by the demand for advanced equipment among professional and serious amateur players.
Table Tennis Equipment Product Innovations
Recent innovations include the development of lighter, stronger rackets using advanced materials like carbon fiber and Zylon, resulting in enhanced speed and control. Rubber compounds are constantly being refined for improved spin and grip. Smart sensors embedded in rackets provide real-time data on playing style and performance metrics, allowing for personalized training and improvement. These advancements cater to the demands of high-performance players and drive market growth.
Propelling Factors for Table Tennis Equipment Growth
Several factors contribute to the market's growth trajectory. Firstly, rising disposable incomes globally have led to increased participation in recreational sports, including table tennis. Secondly, technological advancements, as discussed above, continually improve the performance and appeal of equipment. Thirdly, government initiatives promoting sports development in many countries further boost market expansion. Finally, the growing popularity of e-sports and online gaming creates opportunities for integration of table tennis into virtual and augmented reality experiences.
Obstacles in the Table Tennis Equipment Market
Market growth faces certain obstacles. Fluctuations in raw material prices can impact production costs and profitability. Supply chain disruptions, particularly those experienced during recent global events, have highlighted vulnerabilities. Intense competition from numerous manufacturers, both established brands and emerging players, puts pressure on margins. Furthermore, stringent regulations related to material safety and environmental standards can increase compliance costs.
Future Opportunities in Table Tennis Equipment
Future opportunities exist in expanding into emerging markets, particularly in regions with growing middle classes and rising disposable incomes. The integration of smart technology into equipment offers significant potential for data-driven training and personalized experiences. Sustainable manufacturing practices and eco-friendly materials are also emerging as significant opportunities, attracting environmentally conscious consumers.
Key Developments in Table Tennis Equipment Industry
- 2022 Q3: Butterfly launched its new Tenergy rubber line with improved spin and control.
- 2023 Q1: DHS introduced a new range of carbon fiber rackets incorporating smart sensor technology.
- 2024 Q2: STIGA announced a strategic partnership with a major sporting goods retailer, expanding its distribution network.
Strategic Table Tennis Equipment Market Forecast
The table tennis equipment market is poised for continued robust growth over the forecast period (2025-2033), driven by factors such as technological innovation, expanding consumer base, and increasing investment in the sport globally. The market is expected to exceed $XX million by 2033, offering substantial opportunities for established players and new entrants alike. Focusing on product innovation, strategic partnerships, and expansion into emerging markets will be key to capturing a larger share of this growing market.
Table Tennis Equipment Segmentation
-
1. Application
- 1.1. Specialty and Sports Shops
- 1.2. Department and Discount Stores
- 1.3. Online Retail
- 1.4. Others
-
2. Types
- 2.1. Racket
- 2.2. Ball
- 2.3. Table
- 2.4. Others
Table Tennis Equipment Segmentation By Geography
-
1. North America
- 1.1. United States
- 1.2. Canada
- 1.3. Mexico
-
2. South America
- 2.1. Brazil
- 2.2. Argentina
- 2.3. Rest of South America
-
3. Europe
- 3.1. United Kingdom
- 3.2. Germany
- 3.3. France
- 3.4. Italy
- 3.5. Spain
- 3.6. Russia
- 3.7. Benelux
- 3.8. Nordics
- 3.9. Rest of Europe
-
4. Middle East & Africa
- 4.1. Turkey
- 4.2. Israel
- 4.3. GCC
- 4.4. North Africa
- 4.5. South Africa
- 4.6. Rest of Middle East & Africa
-
5. Asia Pacific
- 5.1. China
- 5.2. India
- 5.3. Japan
- 5.4. South Korea
- 5.5. ASEAN
- 5.6. Oceania
- 5.7. Rest of Asia Pacific
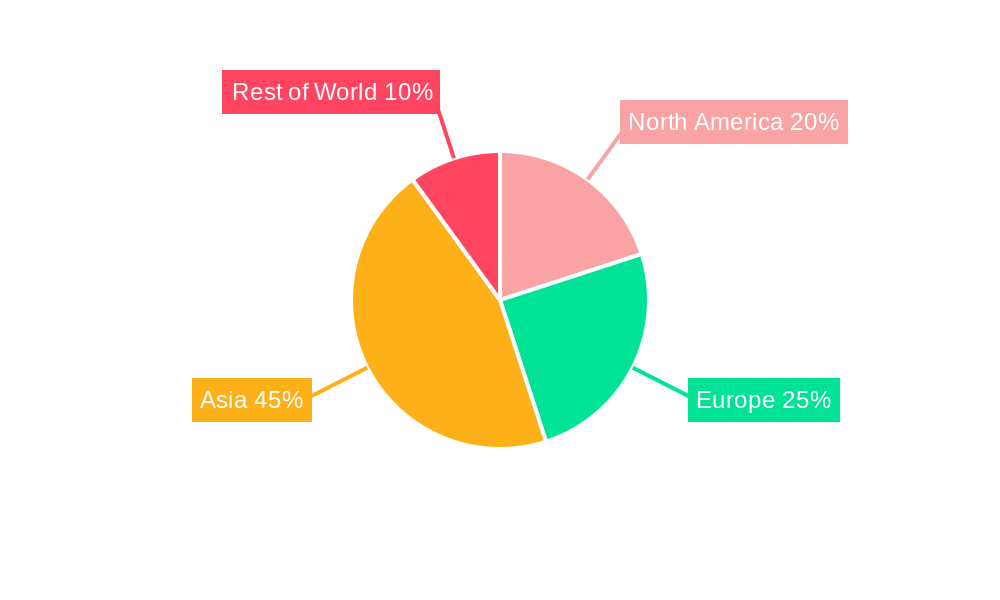
Table Tennis Equipment Regional Market Share
Geographic Coverage of Table Tennis Equipment
Table Tennis Equipment REPORT HIGHLIGHTS
| Aspects | Details |
|---|---|
| Study Period | 2020-2034 |
| Base Year | 2025 |
| Estimated Year | 2026 |
| Forecast Period | 2026-2034 |
| Historical Period | 2020-2025 |
| Growth Rate | CAGR of XX% from 2020-2034 |
| Segmentation |
|
Table of Contents
- 1. Introduction
- 1.1. Research Scope
- 1.2. Market Segmentation
- 1.3. Research Objective
- 1.4. Definitions and Assumptions
- 2. Executive Summary
- 2.1. Market Snapshot
- 3. Market Dynamics
- 3.1. Market Drivers
- 3.2. Market Restrains
- 3.3. Market Trends
- 3.4. Market Opportunities
- 4. Market Factor Analysis
- 4.1. Porters Five Forces
- 4.1.1. Bargaining Power of Suppliers
- 4.1.2. Bargaining Power of Buyers
- 4.1.3. Threat of New Entrants
- 4.1.4. Threat of Substitutes
- 4.1.5. Competitive Rivalry
- 4.2. PESTEL analysis
- 4.3. BCG Analysis
- 4.3.1. Stars (High Growth, High Market Share)
- 4.3.2. Cash Cows (Low Growth, High Market Share)
- 4.3.3. Question Mark (High Growth, Low Market Share)
- 4.3.4. Dogs (Low Growth, Low Market Share)
- 4.4. Ansoff Matrix Analysis
- 4.5. Supply Chain Analysis
- 4.6. Regulatory Landscape
- 4.7. Current Market Potential and Opportunity Assessment (TAM–SAM–SOM Framework)
- 4.8. DMV Analyst Note
- 4.1. Porters Five Forces
- 5. Market Analysis, Insights and Forecast 2021-2033
- 5.1. Market Analysis, Insights and Forecast - by Application
- 5.1.1. Specialty and Sports Shops
- 5.1.2. Department and Discount Stores
- 5.1.3. Online Retail
- 5.1.4. Others
- 5.2. Market Analysis, Insights and Forecast - by Types
- 5.2.1. Racket
- 5.2.2. Ball
- 5.2.3. Table
- 5.2.4. Others
- 5.3. Market Analysis, Insights and Forecast - by Region
- 5.3.1. North America
- 5.3.2. South America
- 5.3.3. Europe
- 5.3.4. Middle East & Africa
- 5.3.5. Asia Pacific
- 5.1. Market Analysis, Insights and Forecast - by Application
- 6. Global Table Tennis Equipment Analysis, Insights and Forecast, 2021-2033
- 6.1. Market Analysis, Insights and Forecast - by Application
- 6.1.1. Specialty and Sports Shops
- 6.1.2. Department and Discount Stores
- 6.1.3. Online Retail
- 6.1.4. Others
- 6.2. Market Analysis, Insights and Forecast - by Types
- 6.2.1. Racket
- 6.2.2. Ball
- 6.2.3. Table
- 6.2.4. Others
- 6.1. Market Analysis, Insights and Forecast - by Application
- 7. North America Table Tennis Equipment Analysis, Insights and Forecast, 2020-2032
- 7.1. Market Analysis, Insights and Forecast - by Application
- 7.1.1. Specialty and Sports Shops
- 7.1.2. Department and Discount Stores
- 7.1.3. Online Retail
- 7.1.4. Others
- 7.2. Market Analysis, Insights and Forecast - by Types
- 7.2.1. Racket
- 7.2.2. Ball
- 7.2.3. Table
- 7.2.4. Others
- 7.1. Market Analysis, Insights and Forecast - by Application
- 8. South America Table Tennis Equipment Analysis, Insights and Forecast, 2020-2032
- 8.1. Market Analysis, Insights and Forecast - by Application
- 8.1.1. Specialty and Sports Shops
- 8.1.2. Department and Discount Stores
- 8.1.3. Online Retail
- 8.1.4. Others
- 8.2. Market Analysis, Insights and Forecast - by Types
- 8.2.1. Racket
- 8.2.2. Ball
- 8.2.3. Table
- 8.2.4. Others
- 8.1. Market Analysis, Insights and Forecast - by Application
- 9. Europe Table Tennis Equipment Analysis, Insights and Forecast, 2020-2032
- 9.1. Market Analysis, Insights and Forecast - by Application
- 9.1.1. Specialty and Sports Shops
- 9.1.2. Department and Discount Stores
- 9.1.3. Online Retail
- 9.1.4. Others
- 9.2. Market Analysis, Insights and Forecast - by Types
- 9.2.1. Racket
- 9.2.2. Ball
- 9.2.3. Table
- 9.2.4. Others
- 9.1. Market Analysis, Insights and Forecast - by Application
- 10. Middle East & Africa Table Tennis Equipment Analysis, Insights and Forecast, 2020-2032
- 10.1. Market Analysis, Insights and Forecast - by Application
- 10.1.1. Specialty and Sports Shops
- 10.1.2. Department and Discount Stores
- 10.1.3. Online Retail
- 10.1.4. Others
- 10.2. Market Analysis, Insights and Forecast - by Types
- 10.2.1. Racket
- 10.2.2. Ball
- 10.2.3. Table
- 10.2.4. Others
- 10.1. Market Analysis, Insights and Forecast - by Application
- 11. Asia Pacific Table Tennis Equipment Analysis, Insights and Forecast, 2020-2032
- 11.1. Market Analysis, Insights and Forecast - by Application
- 11.1.1. Specialty and Sports Shops
- 11.1.2. Department and Discount Stores
- 11.1.3. Online Retail
- 11.1.4. Others
- 11.2. Market Analysis, Insights and Forecast - by Types
- 11.2.1. Racket
- 11.2.2. Ball
- 11.2.3. Table
- 11.2.4. Others
- 11.1. Market Analysis, Insights and Forecast - by Application
- 12. Competitive Analysis
- 12.1. Company Profiles
- 12.1.1 Butterfly
- 12.1.1.1. Company Overview
- 12.1.1.2. Products
- 12.1.1.3. Company Financials
- 12.1.1.4. SWOT Analysis
- 12.1.2 Double Happiness (DHS)
- 12.1.2.1. Company Overview
- 12.1.2.2. Products
- 12.1.2.3. Company Financials
- 12.1.2.4. SWOT Analysis
- 12.1.3 STIGA
- 12.1.3.1. Company Overview
- 12.1.3.2. Products
- 12.1.3.3. Company Financials
- 12.1.3.4. SWOT Analysis
- 12.1.1 Butterfly
- 12.2. Market Entropy
- 12.2.1 Company's Key Areas Served
- 12.2.2 Recent Developments
- 12.3. Company Market Share Analysis 2025
- 12.3.1 Top 5 Companies Market Share Analysis
- 12.3.2 Top 3 Companies Market Share Analysis
- 12.4. List of Potential Customers
- 13. Research Methodology
List of Figures
- Figure 1: Global Table Tennis Equipment Revenue Breakdown (million, %) by Region 2025 & 2033
- Figure 2: North America Table Tennis Equipment Revenue (million), by Application 2025 & 2033
- Figure 3: North America Table Tennis Equipment Revenue Share (%), by Application 2025 & 2033
- Figure 4: North America Table Tennis Equipment Revenue (million), by Types 2025 & 2033
- Figure 5: North America Table Tennis Equipment Revenue Share (%), by Types 2025 & 2033
- Figure 6: North America Table Tennis Equipment Revenue (million), by Country 2025 & 2033
- Figure 7: North America Table Tennis Equipment Revenue Share (%), by Country 2025 & 2033
- Figure 8: South America Table Tennis Equipment Revenue (million), by Application 2025 & 2033
- Figure 9: South America Table Tennis Equipment Revenue Share (%), by Application 2025 & 2033
- Figure 10: South America Table Tennis Equipment Revenue (million), by Types 2025 & 2033
- Figure 11: South America Table Tennis Equipment Revenue Share (%), by Types 2025 & 2033
- Figure 12: South America Table Tennis Equipment Revenue (million), by Country 2025 & 2033
- Figure 13: South America Table Tennis Equipment Revenue Share (%), by Country 2025 & 2033
- Figure 14: Europe Table Tennis Equipment Revenue (million), by Application 2025 & 2033
- Figure 15: Europe Table Tennis Equipment Revenue Share (%), by Application 2025 & 2033
- Figure 16: Europe Table Tennis Equipment Revenue (million), by Types 2025 & 2033
- Figure 17: Europe Table Tennis Equipment Revenue Share (%), by Types 2025 & 2033
- Figure 18: Europe Table Tennis Equipment Revenue (million), by Country 2025 & 2033
- Figure 19: Europe Table Tennis Equipment Revenue Share (%), by Country 2025 & 2033
- Figure 20: Middle East & Africa Table Tennis Equipment Revenue (million), by Application 2025 & 2033
- Figure 21: Middle East & Africa Table Tennis Equipment Revenue Share (%), by Application 2025 & 2033
- Figure 22: Middle East & Africa Table Tennis Equipment Revenue (million), by Types 2025 & 2033
- Figure 23: Middle East & Africa Table Tennis Equipment Revenue Share (%), by Types 2025 & 2033
- Figure 24: Middle East & Africa Table Tennis Equipment Revenue (million), by Country 2025 & 2033
- Figure 25: Middle East & Africa Table Tennis Equipment Revenue Share (%), by Country 2025 & 2033
- Figure 26: Asia Pacific Table Tennis Equipment Revenue (million), by Application 2025 & 2033
- Figure 27: Asia Pacific Table Tennis Equipment Revenue Share (%), by Application 2025 & 2033
- Figure 28: Asia Pacific Table Tennis Equipment Revenue (million), by Types 2025 & 2033
- Figure 29: Asia Pacific Table Tennis Equipment Revenue Share (%), by Types 2025 & 2033
- Figure 30: Asia Pacific Table Tennis Equipment Revenue (million), by Country 2025 & 2033
- Figure 31: Asia Pacific Table Tennis Equipment Revenue Share (%), by Country 2025 & 2033
List of Tables
- Table 1: Global Table Tennis Equipment Revenue million Forecast, by Application 2020 & 2033
- Table 2: Global Table Tennis Equipment Revenue million Forecast, by Types 2020 & 2033
- Table 3: Global Table Tennis Equipment Revenue million Forecast, by Region 2020 & 2033
- Table 4: Global Table Tennis Equipment Revenue million Forecast, by Application 2020 & 2033
- Table 5: Global Table Tennis Equipment Revenue million Forecast, by Types 2020 & 2033
- Table 6: Global Table Tennis Equipment Revenue million Forecast, by Country 2020 & 2033
- Table 7: United States Table Tennis Equipment Revenue (million) Forecast, by Application 2020 & 2033
- Table 8: Canada Table Tennis Equipment Revenue (million) Forecast, by Application 2020 & 2033
- Table 9: Mexico Table Tennis Equipment Revenue (million) Forecast, by Application 2020 & 2033
- Table 10: Global Table Tennis Equipment Revenue million Forecast, by Application 2020 & 2033
- Table 11: Global Table Tennis Equipment Revenue million Forecast, by Types 2020 & 2033
- Table 12: Global Table Tennis Equipment Revenue million Forecast, by Country 2020 & 2033
- Table 13: Brazil Table Tennis Equipment Revenue (million) Forecast, by Application 2020 & 2033
- Table 14: Argentina Table Tennis Equipment Revenue (million) Forecast, by Application 2020 & 2033
- Table 15: Rest of South America Table Tennis Equipment Revenue (million) Forecast, by Application 2020 & 2033
- Table 16: Global Table Tennis Equipment Revenue million Forecast, by Application 2020 & 2033
- Table 17: Global Table Tennis Equipment Revenue million Forecast, by Types 2020 & 2033
- Table 18: Global Table Tennis Equipment Revenue million Forecast, by Country 2020 & 2033
- Table 19: United Kingdom Table Tennis Equipment Revenue (million) Forecast, by Application 2020 & 2033
- Table 20: Germany Table Tennis Equipment Revenue (million) Forecast, by Application 2020 & 2033
- Table 21: France Table Tennis Equipment Revenue (million) Forecast, by Application 2020 & 2033
- Table 22: Italy Table Tennis Equipment Revenue (million) Forecast, by Application 2020 & 2033
- Table 23: Spain Table Tennis Equipment Revenue (million) Forecast, by Application 2020 & 2033
- Table 24: Russia Table Tennis Equipment Revenue (million) Forecast, by Application 2020 & 2033
- Table 25: Benelux Table Tennis Equipment Revenue (million) Forecast, by Application 2020 & 2033
- Table 26: Nordics Table Tennis Equipment Revenue (million) Forecast, by Application 2020 & 2033
- Table 27: Rest of Europe Table Tennis Equipment Revenue (million) Forecast, by Application 2020 & 2033
- Table 28: Global Table Tennis Equipment Revenue million Forecast, by Application 2020 & 2033
- Table 29: Global Table Tennis Equipment Revenue million Forecast, by Types 2020 & 2033
- Table 30: Global Table Tennis Equipment Revenue million Forecast, by Country 2020 & 2033
- Table 31: Turkey Table Tennis Equipment Revenue (million) Forecast, by Application 2020 & 2033
- Table 32: Israel Table Tennis Equipment Revenue (million) Forecast, by Application 2020 & 2033
- Table 33: GCC Table Tennis Equipment Revenue (million) Forecast, by Application 2020 & 2033
- Table 34: North Africa Table Tennis Equipment Revenue (million) Forecast, by Application 2020 & 2033
- Table 35: South Africa Table Tennis Equipment Revenue (million) Forecast, by Application 2020 & 2033
- Table 36: Rest of Middle East & Africa Table Tennis Equipment Revenue (million) Forecast, by Application 2020 & 2033
- Table 37: Global Table Tennis Equipment Revenue million Forecast, by Application 2020 & 2033
- Table 38: Global Table Tennis Equipment Revenue million Forecast, by Types 2020 & 2033
- Table 39: Global Table Tennis Equipment Revenue million Forecast, by Country 2020 & 2033
- Table 40: China Table Tennis Equipment Revenue (million) Forecast, by Application 2020 & 2033
- Table 41: India Table Tennis Equipment Revenue (million) Forecast, by Application 2020 & 2033
- Table 42: Japan Table Tennis Equipment Revenue (million) Forecast, by Application 2020 & 2033
- Table 43: South Korea Table Tennis Equipment Revenue (million) Forecast, by Application 2020 & 2033
- Table 44: ASEAN Table Tennis Equipment Revenue (million) Forecast, by Application 2020 & 2033
- Table 45: Oceania Table Tennis Equipment Revenue (million) Forecast, by Application 2020 & 2033
- Table 46: Rest of Asia Pacific Table Tennis Equipment Revenue (million) Forecast, by Application 2020 & 2033
Frequently Asked Questions
1. What is the projected Compound Annual Growth Rate (CAGR) of the Table Tennis Equipment?
The projected CAGR is approximately XX%.
2. Which companies are prominent players in the Table Tennis Equipment?
Key companies in the market include Butterfly, Double Happiness (DHS), STIGA.
3. What are the main segments of the Table Tennis Equipment?
The market segments include Application, Types.
4. Can you provide details about the market size?
The market size is estimated to be USD XXX million as of 2022.
5. What are some drivers contributing to market growth?
N/A
6. What are the notable trends driving market growth?
N/A
7. Are there any restraints impacting market growth?
N/A
8. Can you provide examples of recent developments in the market?
N/A
9. What pricing options are available for accessing the report?
Pricing options include single-user, multi-user, and enterprise licenses priced at USD 4900.00, USD 7350.00, and USD 9800.00 respectively.
10. Is the market size provided in terms of value or volume?
The market size is provided in terms of value, measured in million.
11. Are there any specific market keywords associated with the report?
Yes, the market keyword associated with the report is "Table Tennis Equipment," which aids in identifying and referencing the specific market segment covered.
12. How do I determine which pricing option suits my needs best?
The pricing options vary based on user requirements and access needs. Individual users may opt for single-user licenses, while businesses requiring broader access may choose multi-user or enterprise licenses for cost-effective access to the report.
13. Are there any additional resources or data provided in the Table Tennis Equipment report?
While the report offers comprehensive insights, it's advisable to review the specific contents or supplementary materials provided to ascertain if additional resources or data are available.
14. How can I stay updated on further developments or reports in the Table Tennis Equipment?
To stay informed about further developments, trends, and reports in the Table Tennis Equipment, consider subscribing to industry newsletters, following relevant companies and organizations, or regularly checking reputable industry news sources and publications.
Methodology
Step 1 - Identification of Relevant Samples Size from Population Database


Step 2 - Approaches for Defining Global Market Size (Value, Volume* & Price*)

Note*: In applicable scenarios
Step 3 - Data Sources
Primary Research
- Web Analytics
- Survey Reports
- Research Institute
- Latest Research Reports
- Opinion Leaders
Secondary Research
- Annual Reports
- White Paper
- Latest Press Release
- Industry Association
- Paid Database
- Investor Presentations

Step 4 - Data Triangulation
Involves using different sources of information in order to increase the validity of a study
These sources are likely to be stakeholders in a program - participants, other researchers, program staff, other community members, and so on.
Then we put all data in single framework & apply various statistical tools to find out the dynamic on the market.
During the analysis stage, feedback from the stakeholder groups would be compared to determine areas of agreement as well as areas of divergence