

Key Insights
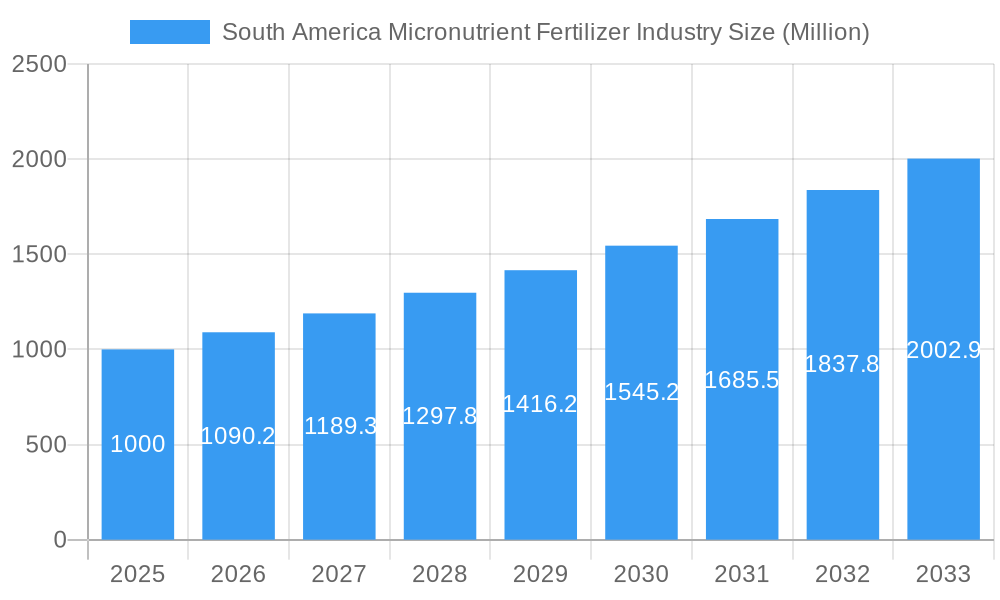
The South American micronutrient fertilizer market, valued at approximately $XX million in 2025, is projected to experience robust growth, exhibiting a Compound Annual Growth Rate (CAGR) of 9.02% from 2025 to 2033. This expansion is fueled by several key factors. Intensifying agricultural practices across Brazil and Argentina, the region's leading agricultural economies, necessitate increased micronutrient application to maximize crop yields and address soil deficiencies. Growing demand for high-quality produce, particularly in horticultural crops and field crops, further stimulates market growth. The increasing adoption of efficient application methods like fertigation, alongside government initiatives promoting sustainable agricultural practices, also contributes to the market's positive trajectory. While challenges such as fluctuating raw material prices and potential economic instability in certain South American nations exist, the overall market outlook remains optimistic due to strong agricultural fundamentals and the region's expanding food production sector. The diverse product portfolio, encompassing boron, copper, iron, manganese, molybdenum, zinc, and others, caters to a wide range of crop requirements, contributing to overall market strength. Specific segments like Brazil's robust agricultural sector and the increasing adoption of advanced fertigation techniques are driving segmental growth within the broader South American market.
South America Micronutrient Fertilizer Industry Market Size (In Billion)
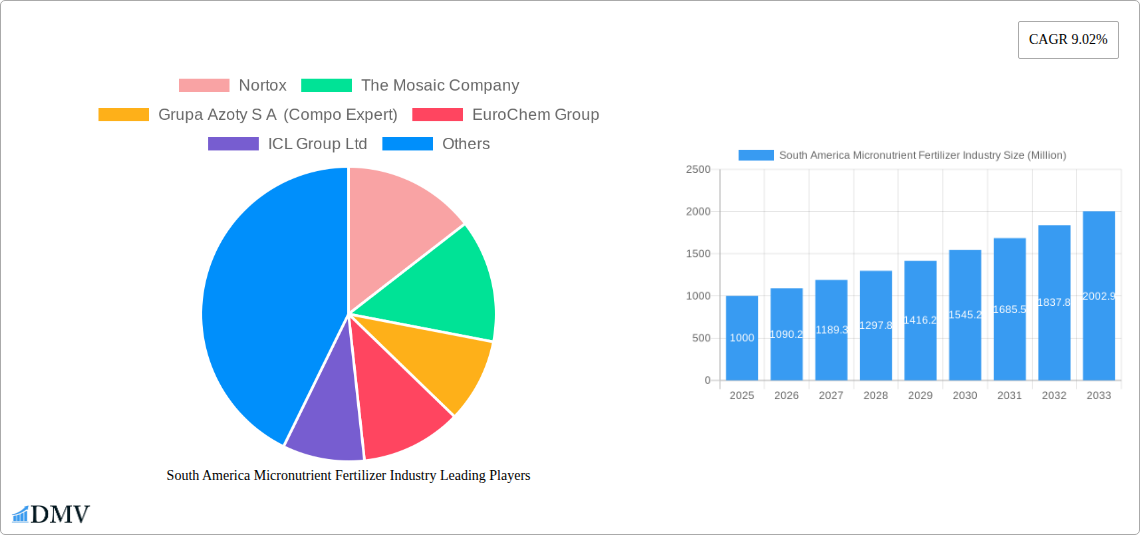
The competitive landscape comprises both multinational players and regional companies, each vying for market share through product innovation, strategic partnerships, and efficient distribution networks. Key players like Nortox, Mosaic Company, and Yara International are leveraging their global expertise and extensive distribution channels to capture significant market share. Local companies, however, benefit from strong regional knowledge and localized distribution capabilities. The market is further segmented by application mode (fertigation, foliar, soil), crop type (field crops, horticultural crops, turf & ornamental), and country (Brazil, Argentina, Rest of South America), allowing for a nuanced understanding of growth opportunities within specific niches. This granular segmentation informs targeted marketing and product development strategies for players across the value chain. Future market growth will be largely driven by continued agricultural intensification, technological advancements in fertilizer application, and governmental policies that support sustainable and efficient farming practices.
South America Micronutrient Fertilizer Industry Company Market Share
South America Micronutrient Fertilizer Industry: A Comprehensive Market Report (2019-2033)
This insightful report provides a comprehensive analysis of the South America micronutrient fertilizer industry, offering a detailed examination of market trends, leading players, and future growth prospects. Covering the period from 2019 to 2033, with a base year of 2025, this study is an indispensable resource for stakeholders seeking to navigate this dynamic market. The report projects a market value of xx Million by 2033, representing a significant growth trajectory.
South America Micronutrient Fertilizer Industry Market Composition & Trends
This section analyzes the competitive landscape, including market concentration, innovation drivers, regulatory factors, substitute products, end-user profiles, and mergers & acquisitions (M&A) activity within the South American micronutrient fertilizer market. The report reveals a moderately concentrated market with key players like Yara International, Mosaic, and EuroChem holding significant shares. However, the presence of several regional players ensures a competitive dynamic.
- Market Share Distribution (2024): Yara International (15%), Mosaic (12%), EuroChem (10%), Others (63%). These figures are estimates based on available data and may fluctuate.
- Innovation Catalysts: Growing demand for high-yield crops, increasing awareness of soil health, and advancements in fertilizer technology are key drivers of innovation.
- Regulatory Landscape: Varying regulations across South American countries influence product registration and distribution, impacting market access.
- Substitute Products: Organic fertilizers and biofertilizers pose some level of competition, but micronutrient fertilizers remain crucial for optimal crop production.
- End-User Profiles: The primary end-users include large-scale commercial farms, smallholder farmers, and horticultural businesses.
- M&A Activity: Significant M&A activity, such as EuroChem's acquisition of a stake in Fertilizantes Heringer SA, signifies consolidation and expansion within the market. Estimated M&A deal values in the past five years total xx Million.
South America Micronutrient Fertilizer Industry Industry Evolution
This section details the evolution of the South America micronutrient fertilizer industry, charting its growth trajectory, technological advancements, and the changing demands of consumers. The industry has witnessed consistent growth, driven by rising agricultural output, favorable government policies in key markets like Brazil, and increasing adoption of modern farming practices. The report projects a Compound Annual Growth Rate (CAGR) of xx% from 2025 to 2033. Technological innovations, such as controlled-release fertilizers and precision application techniques, are transforming industry practices and enhancing efficiency. Consumer demand is shifting toward sustainable and environmentally friendly products, fostering innovation in this direction.
Leading Regions, Countries, or Segments in South America Micronutrient Fertilizer Industry
This section identifies the dominant regions, countries, and segments within the South American micronutrient fertilizer market.
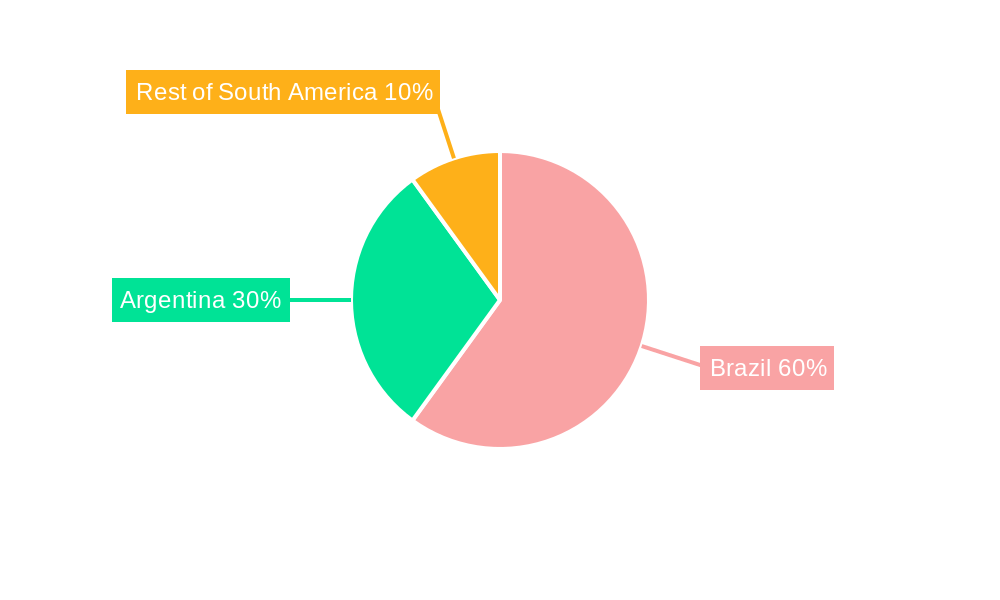
- Dominant Country: Brazil dominates the market due to its large agricultural sector and significant investments in agricultural infrastructure.
- Leading Product Segment: Zinc and Iron represent the largest product segments due to high demand from key crops.
- Dominant Application Mode: Soil application remains the primary method, although fertigation is gaining traction, particularly in high-value horticultural crops.
- Key Drivers:
- Brazil: Government support for agricultural modernization, favorable climatic conditions, and large-scale farming operations.
- Zinc & Iron: Essential micronutrients for a wide range of crops, high demand, and established supply chains.
- Soil Application: Established practice, cost-effectiveness, and wide applicability.
Analysis of Dominance Factors: Brazil's dominance stems from its vast agricultural land, substantial investments in agricultural R&D, and supportive government policies. The prevalence of soil application reflects its cost-effectiveness and suitability for various crops and farming practices. The high demand for Zinc and Iron highlights the critical role of these micronutrients in ensuring optimal crop yields.
South America Micronutrient Fertilizer Industry Product Innovations
Recent innovations focus on enhancing nutrient uptake efficiency, improving product solubility, and developing environmentally friendly formulations. Controlled-release fertilizers, micronutrient blends tailored to specific crop needs, and water-soluble formulations are examples of key innovations. These products offer improved efficacy, reduced environmental impact, and enhanced convenience for farmers. The unique selling propositions include increased nutrient use efficiency, reduced fertilizer application rates, and enhanced crop yields.
Propelling Factors for South America Micronutrient Fertilizer Industry Growth
Several factors drive the industry's growth. Technological advancements in fertilizer production and application methods enhance efficiency and effectiveness. The growing demand for food and feed from a rapidly expanding population boosts demand for high-yield crops, necessitating the use of micronutrient fertilizers. Favorable government policies and investments in agricultural infrastructure, particularly in Brazil, provide further support.
Obstacles in the South America Micronutrient Fertilizer Industry Market
The industry faces challenges including fluctuating raw material prices, supply chain disruptions, and varying regulatory frameworks across countries. These factors contribute to price volatility and impact market access. Furthermore, intense competition from established players and emerging market entrants creates pressure on profit margins. Import restrictions or tariffs on fertilizer imports could also affect market accessibility and prices.
Future Opportunities in South America Micronutrient Fertilizer Industry
Future growth hinges on technological advancements like precision farming and the development of sustainable and eco-friendly formulations. Expanding into new markets and developing customized products for specific crops represent key opportunities. Increased farmer awareness of soil health and the benefits of micronutrient fertilization will also boost market expansion.
Major Players in the South America Micronutrient Fertilizer Industry Ecosystem
Key Developments in South America Micronutrient Fertilizer Industry Industry
- March 2022: EuroChem Group's acquisition of a 51.48% stake in Fertilizantes Heringer SA strengthened its Brazilian presence.
- March 2022: Haifa Group's acquisition of Horticoop Andina expanded its Latin American market reach.
- August 2020: EuroChem Group and Fertilizantes Tocantins (FTO) completed a trade integration agreement, broadening EuroChem's product offerings in Brazil.
Strategic South America Micronutrient Fertilizer Industry Market Forecast
The South America micronutrient fertilizer market is poised for continued growth, driven by rising agricultural production, technological advancements, and favorable government policies. The increasing adoption of precision farming techniques and a focus on sustainable agricultural practices will further propel market expansion. The focus on developing tailored products for specific crops and regions will be key to success in this increasingly competitive market. The projected growth aligns with predictions of rising global food demand and a continued need for efficient and sustainable fertilizer solutions.
South America Micronutrient Fertilizer Industry Segmentation
- 1. Production Analysis
- 2. Consumption Analysis
- 3. Import Market Analysis (Value & Volume)
- 4. Export Market Analysis (Value & Volume)
- 5. Price Trend Analysis
South America Micronutrient Fertilizer Industry Segmentation By Geography
-
1. South America
- 1.1. Brazil
- 1.2. Argentina
- 1.3. Chile
- 1.4. Colombia
- 1.5. Peru
- 1.6. Venezuela
- 1.7. Ecuador
- 1.8. Bolivia
- 1.9. Paraguay
- 1.10. Uruguay
South America Micronutrient Fertilizer Industry Regional Market Share
Geographic Coverage of South America Micronutrient Fertilizer Industry
South America Micronutrient Fertilizer Industry REPORT HIGHLIGHTS
| Aspects | Details |
|---|---|
| Study Period | 2020-2034 |
| Base Year | 2025 |
| Estimated Year | 2026 |
| Forecast Period | 2026-2034 |
| Historical Period | 2020-2025 |
| Growth Rate | CAGR of 8.74% from 2020-2034 |
| Segmentation |
|
Table of Contents
- 1. Introduction
- 1.1. Research Scope
- 1.2. Market Segmentation
- 1.3. Research Objective
- 1.4. Definitions and Assumptions
- 2. Executive Summary
- 2.1. Market Snapshot
- 3. Market Dynamics
- 3.1. Market Drivers
- 3.2. Market Restrains
- 3.3. Market Trends
- 3.4. Market Opportunities
- 4. Market Factor Analysis
- 4.1. Porters Five Forces
- 4.1.1. Bargaining Power of Suppliers
- 4.1.2. Bargaining Power of Buyers
- 4.1.3. Threat of New Entrants
- 4.1.4. Threat of Substitutes
- 4.1.5. Competitive Rivalry
- 4.2. PESTEL analysis
- 4.3. BCG Analysis
- 4.3.1. Stars (High Growth, High Market Share)
- 4.3.2. Cash Cows (Low Growth, High Market Share)
- 4.3.3. Question Mark (High Growth, Low Market Share)
- 4.3.4. Dogs (Low Growth, Low Market Share)
- 4.4. Ansoff Matrix Analysis
- 4.5. Supply Chain Analysis
- 4.6. Regulatory Landscape
- 4.7. Current Market Potential and Opportunity Assessment (TAM–SAM–SOM Framework)
- 4.8. DMV Analyst Note
- 4.1. Porters Five Forces
- 5. Market Analysis, Insights and Forecast 2021-2033
- 5.1. Market Analysis, Insights and Forecast - by Production Analysis
- 5.2. Market Analysis, Insights and Forecast - by Consumption Analysis
- 5.3. Market Analysis, Insights and Forecast - by Import Market Analysis (Value & Volume)
- 5.4. Market Analysis, Insights and Forecast - by Export Market Analysis (Value & Volume)
- 5.5. Market Analysis, Insights and Forecast - by Price Trend Analysis
- 5.6. Market Analysis, Insights and Forecast - by Region
- 5.6.1. South America
- 6. South America Micronutrient Fertilizer Industry Analysis, Insights and Forecast, 2021-2033
- 6.1. Market Analysis, Insights and Forecast - by Production Analysis
- 6.2. Market Analysis, Insights and Forecast - by Consumption Analysis
- 6.3. Market Analysis, Insights and Forecast - by Import Market Analysis (Value & Volume)
- 6.4. Market Analysis, Insights and Forecast - by Export Market Analysis (Value & Volume)
- 6.5. Market Analysis, Insights and Forecast - by Price Trend Analysis
- 7. Competitive Analysis
- 7.1. Company Profiles
- 7.1.1 Nortox
- 7.1.1.1. Company Overview
- 7.1.1.2. Products
- 7.1.1.3. Company Financials
- 7.1.1.4. SWOT Analysis
- 7.1.2 The Mosaic Company
- 7.1.2.1. Company Overview
- 7.1.2.2. Products
- 7.1.2.3. Company Financials
- 7.1.2.4. SWOT Analysis
- 7.1.3 Grupa Azoty S A (Compo Expert)
- 7.1.3.1. Company Overview
- 7.1.3.2. Products
- 7.1.3.3. Company Financials
- 7.1.3.4. SWOT Analysis
- 7.1.4 EuroChem Group
- 7.1.4.1. Company Overview
- 7.1.4.2. Products
- 7.1.4.3. Company Financials
- 7.1.4.4. SWOT Analysis
- 7.1.5 ICL Group Ltd
- 7.1.5.1. Company Overview
- 7.1.5.2. Products
- 7.1.5.3. Company Financials
- 7.1.5.4. SWOT Analysis
- 7.1.6 Haifa Group
- 7.1.6.1. Company Overview
- 7.1.6.2. Products
- 7.1.6.3. Company Financials
- 7.1.6.4. SWOT Analysis
- 7.1.7 Inquima LTDA
- 7.1.7.1. Company Overview
- 7.1.7.2. Products
- 7.1.7.3. Company Financials
- 7.1.7.4. SWOT Analysis
- 7.1.8 K+S Aktiengesellschaft
- 7.1.8.1. Company Overview
- 7.1.8.2. Products
- 7.1.8.3. Company Financials
- 7.1.8.4. SWOT Analysis
- 7.1.9 Yara International AS
- 7.1.9.1. Company Overview
- 7.1.9.2. Products
- 7.1.9.3. Company Financials
- 7.1.9.4. SWOT Analysis
- 7.1.10 BMS Micro-Nutrients NV
- 7.1.10.1. Company Overview
- 7.1.10.2. Products
- 7.1.10.3. Company Financials
- 7.1.10.4. SWOT Analysis
- 7.1.1 Nortox
- 7.2. Market Entropy
- 7.2.1 Company's Key Areas Served
- 7.2.2 Recent Developments
- 7.3. Company Market Share Analysis 2025
- 7.3.1 Top 5 Companies Market Share Analysis
- 7.3.2 Top 3 Companies Market Share Analysis
- 7.4. List of Potential Customers
- 8. Research Methodology
List of Figures
- Figure 1: South America Micronutrient Fertilizer Industry Revenue Breakdown (million, %) by Product 2025 & 2033
- Figure 2: South America Micronutrient Fertilizer Industry Share (%) by Company 2025
List of Tables
- Table 1: South America Micronutrient Fertilizer Industry Revenue million Forecast, by Production Analysis 2020 & 2033
- Table 2: South America Micronutrient Fertilizer Industry Revenue million Forecast, by Consumption Analysis 2020 & 2033
- Table 3: South America Micronutrient Fertilizer Industry Revenue million Forecast, by Import Market Analysis (Value & Volume) 2020 & 2033
- Table 4: South America Micronutrient Fertilizer Industry Revenue million Forecast, by Export Market Analysis (Value & Volume) 2020 & 2033
- Table 5: South America Micronutrient Fertilizer Industry Revenue million Forecast, by Price Trend Analysis 2020 & 2033
- Table 6: South America Micronutrient Fertilizer Industry Revenue million Forecast, by Region 2020 & 2033
- Table 7: South America Micronutrient Fertilizer Industry Revenue million Forecast, by Production Analysis 2020 & 2033
- Table 8: South America Micronutrient Fertilizer Industry Revenue million Forecast, by Consumption Analysis 2020 & 2033
- Table 9: South America Micronutrient Fertilizer Industry Revenue million Forecast, by Import Market Analysis (Value & Volume) 2020 & 2033
- Table 10: South America Micronutrient Fertilizer Industry Revenue million Forecast, by Export Market Analysis (Value & Volume) 2020 & 2033
- Table 11: South America Micronutrient Fertilizer Industry Revenue million Forecast, by Price Trend Analysis 2020 & 2033
- Table 12: South America Micronutrient Fertilizer Industry Revenue million Forecast, by Country 2020 & 2033
- Table 13: Brazil South America Micronutrient Fertilizer Industry Revenue (million) Forecast, by Application 2020 & 2033
- Table 14: Argentina South America Micronutrient Fertilizer Industry Revenue (million) Forecast, by Application 2020 & 2033
- Table 15: Chile South America Micronutrient Fertilizer Industry Revenue (million) Forecast, by Application 2020 & 2033
- Table 16: Colombia South America Micronutrient Fertilizer Industry Revenue (million) Forecast, by Application 2020 & 2033
- Table 17: Peru South America Micronutrient Fertilizer Industry Revenue (million) Forecast, by Application 2020 & 2033
- Table 18: Venezuela South America Micronutrient Fertilizer Industry Revenue (million) Forecast, by Application 2020 & 2033
- Table 19: Ecuador South America Micronutrient Fertilizer Industry Revenue (million) Forecast, by Application 2020 & 2033
- Table 20: Bolivia South America Micronutrient Fertilizer Industry Revenue (million) Forecast, by Application 2020 & 2033
- Table 21: Paraguay South America Micronutrient Fertilizer Industry Revenue (million) Forecast, by Application 2020 & 2033
- Table 22: Uruguay South America Micronutrient Fertilizer Industry Revenue (million) Forecast, by Application 2020 & 2033
Frequently Asked Questions
1. What is the projected Compound Annual Growth Rate (CAGR) of the South America Micronutrient Fertilizer Industry?
The projected CAGR is approximately 8.74%.
2. Which companies are prominent players in the South America Micronutrient Fertilizer Industry?
Key companies in the market include Nortox, The Mosaic Company, Grupa Azoty S A (Compo Expert), EuroChem Group, ICL Group Ltd, Haifa Group, Inquima LTDA, K+S Aktiengesellschaft, Yara International AS, BMS Micro-Nutrients NV.
3. What are the main segments of the South America Micronutrient Fertilizer Industry?
The market segments include Production Analysis, Consumption Analysis, Import Market Analysis (Value & Volume), Export Market Analysis (Value & Volume), Price Trend Analysis.
4. Can you provide details about the market size?
The market size is estimated to be USD 132.1 million as of 2022.
5. What are some drivers contributing to market growth?
Need for Custom Product Development; Use of CROs for Regulatory Services.
6. What are the notable trends driving market growth?
OTHER KEY INDUSTRY TRENDS COVERED IN THE REPORT.
7. Are there any restraints impacting market growth?
Data and Cyber Security Concerns; Lack of Experts and Professionals in this Industry.
8. Can you provide examples of recent developments in the market?
March 2022: EuroChem Group has purchased 51.48% of the shares of the Brazilian distributor Fertilizantes Heringer SA, this purchase will further strengthen its production and distribution capacity in Brazil.March 2022: The Haifa Group entered a purchase agreement with HORTICOOP BV to acquire Horticoop Andina, the distributor of nutritional products for agriculture. Through this acquisition of the brand, Haifa intends to expand its market presence in the Latin American market and strengthen its position as a global superbrand in advanced plant nutrition.August 2020: EuroChem Group and Fertilizantes Tocantins (FTO) completed the trade integration agreement which will help EuroChem to offer farmers the full range of products in the Brazilian market.
9. What pricing options are available for accessing the report?
Pricing options include single-user, multi-user, and enterprise licenses priced at USD 3800, USD 4500, and USD 5800 respectively.
10. Is the market size provided in terms of value or volume?
The market size is provided in terms of value, measured in million.
11. Are there any specific market keywords associated with the report?
Yes, the market keyword associated with the report is "South America Micronutrient Fertilizer Industry," which aids in identifying and referencing the specific market segment covered.
12. How do I determine which pricing option suits my needs best?
The pricing options vary based on user requirements and access needs. Individual users may opt for single-user licenses, while businesses requiring broader access may choose multi-user or enterprise licenses for cost-effective access to the report.
13. Are there any additional resources or data provided in the South America Micronutrient Fertilizer Industry report?
While the report offers comprehensive insights, it's advisable to review the specific contents or supplementary materials provided to ascertain if additional resources or data are available.
14. How can I stay updated on further developments or reports in the South America Micronutrient Fertilizer Industry?
To stay informed about further developments, trends, and reports in the South America Micronutrient Fertilizer Industry, consider subscribing to industry newsletters, following relevant companies and organizations, or regularly checking reputable industry news sources and publications.
Methodology
Step 1 - Identification of Relevant Samples Size from Population Database


Step 2 - Approaches for Defining Global Market Size (Value, Volume* & Price*)

Note*: In applicable scenarios
Step 3 - Data Sources
Primary Research
- Web Analytics
- Survey Reports
- Research Institute
- Latest Research Reports
- Opinion Leaders
Secondary Research
- Annual Reports
- White Paper
- Latest Press Release
- Industry Association
- Paid Database
- Investor Presentations

Step 4 - Data Triangulation
Involves using different sources of information in order to increase the validity of a study
These sources are likely to be stakeholders in a program - participants, other researchers, program staff, other community members, and so on.
Then we put all data in single framework & apply various statistical tools to find out the dynamic on the market.
During the analysis stage, feedback from the stakeholder groups would be compared to determine areas of agreement as well as areas of divergence