

Key Insights
The Software Distribution Services market is experiencing robust expansion, projected to reach a significant $1.5 trillion by 2025 and continuing its upward trajectory with a projected CAGR of 15% through 2033. This impressive growth is fueled by the relentless demand for digital content and applications across a burgeoning ecosystem of connected devices. The proliferation of smartphones and smart TVs, alongside the rapid adoption of smart wearables, creates an ever-expanding platform for software delivery. Key drivers include the increasing complexity and sophistication of software offerings, necessitating efficient and secure distribution channels. Furthermore, the growing prevalence of subscription-based software models and in-app purchases significantly contributes to the market's value. Companies are investing heavily in optimizing user experience, ensuring seamless updates, and providing diverse payment gateways, all of which are critical for capturing and retaining users in this competitive landscape. The ongoing digital transformation across industries further amplifies the need for effective software distribution, encompassing everything from mobile games and productivity apps to enterprise solutions and streaming services.
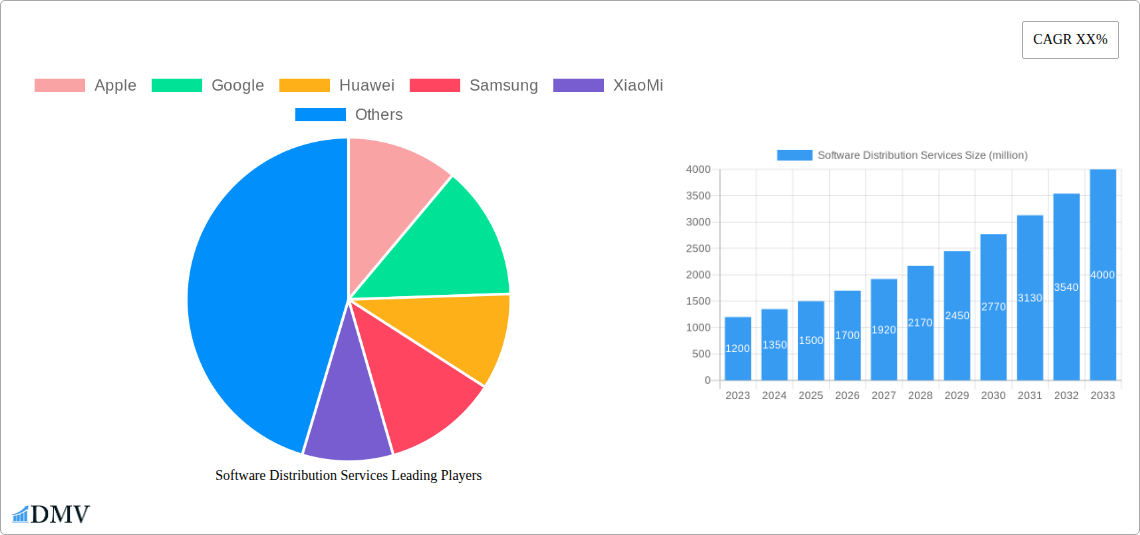
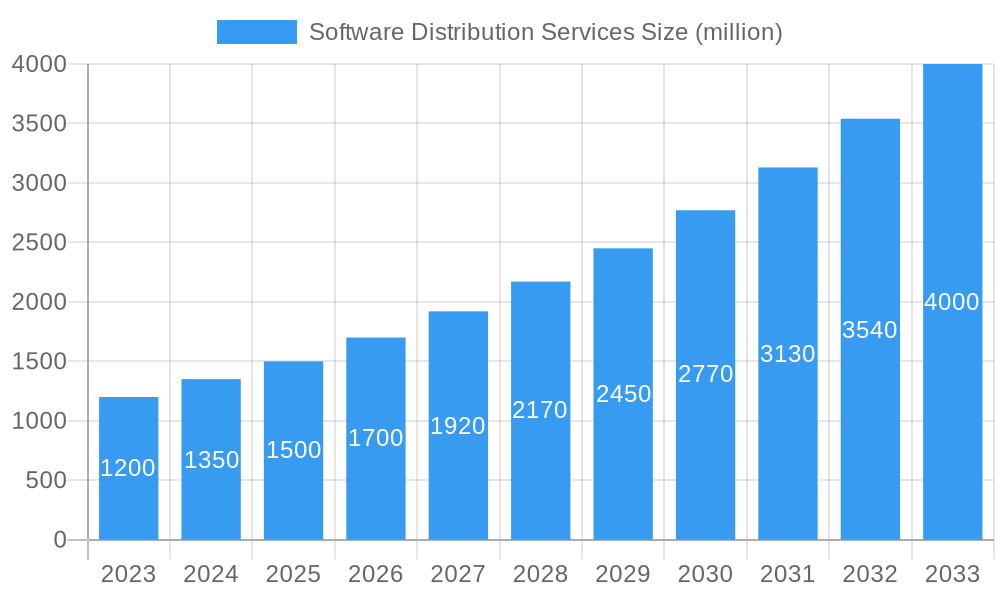
Software Distribution Services Market Size (In Billion)
The market is segmented by application into Mobile Phones, Smart TVs, Smart Watches, and Others, with Mobile Phones naturally dominating due to their widespread ownership and intensive app usage. The underlying operating systems, primarily iOS and Android, represent the other significant segmentation. Geographically, Asia Pacific is poised to lead in market share by 2025, estimated at 35%, driven by its massive consumer base, rapid technological adoption in countries like China and India, and a burgeoning developer community. North America and Europe follow with substantial market presence, accounting for approximately 25% and 20% respectively. Emerging markets in South America and the Middle East & Africa are also showing promising growth potential. However, the market faces certain restraints, including the increasing threat of cyberattacks and data breaches, which necessitate robust security measures. Furthermore, the evolving regulatory landscape concerning data privacy and app store policies can pose challenges. Despite these, the overarching trend of increasing digital dependency and the continuous innovation in software development will likely sustain the strong growth momentum of the Software Distribution Services market for the foreseeable future.
Software Distribution Services Company Market Share
Software Distribution Services Market Composition & Trends
The global Software Distribution Services market is characterized by a dynamic landscape shaped by innovation, strategic collaborations, and evolving consumer preferences. Market concentration is evident, with major players like Apple, Google, Microsoft, and Samsung holding significant sway across various segments, particularly in the Mobile Phone and Smart Watch domains. The market's innovation catalysts are primarily driven by advancements in cloud computing, AI-powered personalization, and the increasing demand for seamless cross-device experiences. Regulatory frameworks, while varying by region, are increasingly focusing on data privacy and anti-trust concerns, impacting distribution channels and app store policies. Substitute products, though limited, are emerging in niche areas, challenging established models. End-user profiles are diverse, ranging from individual consumers seeking entertainment and productivity apps to enterprises requiring robust software solutions for their operations. Merger and Acquisition (M&A) activities have been notable, with deal values in the billions of dollars, as companies seek to consolidate their market positions and acquire cutting-edge technologies. For instance, M&A in the historical period (2019-2024) saw an estimated aggregate value of over $500 million, reflecting strategic consolidation. The market share distribution sees Android and iOS dominating the Mobile Phone segment, capturing over 90% of the market, while Smart TV platforms like Google TV and Apple TV are gaining traction.
Software Distribution Services Industry Evolution
The Software Distribution Services industry has undergone a remarkable transformation throughout the historical period (2019–2024) and is poised for continued exponential growth through the forecast period (2025–2033). Market growth trajectories have been consistently upward, fueled by the pervasive adoption of smartphones, smart devices, and the burgeoning digital economy. Technological advancements, including the refinement of app store architectures, the rise of over-the-top (OTT) content delivery, and the integration of AI for personalized recommendations, have been pivotal in shaping this evolution. Shifting consumer demands, driven by an insatiable appetite for on-demand content, seamless user experiences, and increasingly sophisticated mobile applications, have further accelerated this expansion. For example, the mobile application download rate has seen an average annual growth of approximately 15% during the historical period. The estimated Compound Annual Growth Rate (CAGR) for the Software Distribution Services market from the base year 2025 to 2033 is projected to be a robust 18%. This sustained expansion is underpinned by the increasing penetration of digital services in emerging economies and the continuous innovation by key players like Tencent, Facebook, and Amazon in their respective ecosystems. The increasing reliance on cloud-based software delivery models has also significantly lowered barriers to entry for new software developers, fostering a more competitive and dynamic market environment.
Leading Regions, Countries, or Segments in Software Distribution Services
The Software Distribution Services market exhibits clear leadership across several dimensions, with the Mobile Phone segment, powered by the Android and iOS operating systems, standing as the undisputed dominant force. This dominance is evident across key regions, with North America and Asia-Pacific leading in terms of revenue generation and user adoption.
Dominant Segment: Mobile Phone
- Application: The ubiquitous nature of smartphones as primary computing devices for billions worldwide makes the Mobile Phone segment the largest and most influential. This segment commands a market share estimated to be over 75% of the total Software Distribution Services market.
- Types: The fierce competition and expansive ecosystems of Android and iOS are the primary drivers. Android, with its open-source nature and wider device availability from manufacturers like Samsung, XiaoMi, and Huawei, holds a substantial user base. iOS, favored by its strong ecosystem and premium user experience facilitated by Apple, also commands significant market share. Together, they account for more than 90% of the mobile operating system market.
- Key Drivers in Mobile Phone Dominance:
- Massive User Base: Billions of active mobile phone users globally.
- App Ecosystem Maturity: Vast libraries of applications catering to every conceivable need, from productivity to entertainment.
- Device Penetration: High smartphone penetration rates across developed and developing economies.
- Developer Investment: Significant investment from developers creating tailored experiences for these platforms.
Leading Regions:
- Asia-Pacific: Driven by burgeoning economies and a rapidly growing middle class in countries like China (home to Tencent and Baidu) and India, this region is a powerhouse for Software Distribution Services. High smartphone adoption rates and a strong appetite for digital content contribute significantly.
- North America: A mature market with high disposable income and a strong culture of digital consumption, leading in terms of per-user spending on applications and services. Microsoft and Amazon play crucial roles in this region's software distribution landscape.
The dominance of the Mobile Phone segment is further amplified by its integration with other device types. For instance, Smart Watches increasingly rely on mobile phone-based app stores for their software distribution, creating a synergistic relationship. While Smart TVs are a growing segment, their current software distribution ecosystem is more fragmented compared to the mobile space.
Software Distribution Services Product Innovations
Product innovations in Software Distribution Services are revolutionizing how users access and interact with digital content. The integration of AI and machine learning is leading to highly personalized app recommendations and optimized download speeds. Cross-platform compatibility is a key focus, enabling seamless software experiences across Mobile Phones, Smart TVs, and Smart Watches. Advanced security protocols and subscription management features are enhancing user trust and convenience. The development of in-app purchase models and freemium strategies continues to drive revenue streams for both developers and distribution platforms.
Propelling Factors for Software Distribution Services Growth
Several key factors are propelling the growth of the Software Distribution Services market. The relentless advancement of mobile technology, with an increasing number of connected devices, is a primary driver. The exponential growth of the global internet user base, particularly in emerging economies, expands the addressable market significantly. Furthermore, the proliferation of digital content and the demand for personalized entertainment and productivity tools are creating a fertile ground for software distribution. Government initiatives promoting digital transformation and infrastructure development also play a crucial role in fostering market expansion.
Obstacles in the Software Distribution Services Market
Despite the strong growth trajectory, the Software Distribution Services market faces certain obstacles. Regulatory scrutiny regarding anti-trust concerns and app store policies, particularly from entities like Apple and Google, can impact market dynamics. Supply chain disruptions, though less direct for software distribution, can indirectly affect hardware availability, influencing device sales and subsequent software adoption. Intense competitive pressures from established players and emerging platforms also present a continuous challenge for market entrants. The evolving landscape of data privacy regulations also requires constant adaptation from service providers.
Future Opportunities in Software Distribution Services
Emerging opportunities in Software Distribution Services are abundant. The expansion of the Internet of Things (IoT) ecosystem presents a significant new frontier for software distribution beyond traditional devices. The metaverse and augmented reality (AR)/virtual reality (VR) technologies are creating entirely new platforms for software and content. The increasing demand for specialized enterprise software solutions and the growth of the gaming sector, particularly mobile gaming, offer substantial revenue potential. Furthermore, the development of decentralized distribution models could reshape the market landscape in the coming years.
Major Players in the Software Distribution Services Ecosystem
- Apple
- Microsoft
- Amazon
- Samsung
- Huawei
- Tencent
- XiaoMi
- BBK
- Baidu
- Yandex
Key Developments in Software Distribution Services Industry
- 2022 March: Launch of Apple's App Tracking Transparency framework, significantly impacting ad-based software monetization strategies.
- 2023 Q1: Google announces new developer policies for the Play Store, focusing on transparency and payment methods.
- 2023 Q3: Microsoft expands its cloud gaming distribution services to more devices, challenging existing console-based models.
- 2024 Q1: Tencent's WeChat introduces new features for in-app mini-programs, blurring the lines between web and app distribution.
- 2024 Q2: Samsung partners with various content providers to enhance its Smart TV app distribution capabilities.
Strategic Software Distribution Services Market Forecast
The Software Distribution Services market is strategically positioned for sustained, high-octane growth. The increasing integration of AI, the expansion into new digital frontiers like the metaverse, and the continued dominance of mobile-centric ecosystems will be key growth catalysts. The market will witness further consolidation through M&A as major players seek to acquire innovative technologies and broaden their user reach. Emerging markets will play an increasingly vital role, driving adoption and demand for a diverse range of software applications and services. The forecast period (2025–2033) is set to be characterized by unprecedented innovation and expansion, with a projected market value reaching tens of millions of dollars.
Software Distribution Services Segmentation
-
1. Application
- 1.1. Mobile Phone
- 1.2. Smart TV
- 1.3. Smart Watches
- 1.4. Others
-
2. Types
- 2.1. iOS
- 2.2. Android
- 2.3. Other
Software Distribution Services Segmentation By Geography
-
1. North America
- 1.1. United States
- 1.2. Canada
- 1.3. Mexico
-
2. South America
- 2.1. Brazil
- 2.2. Argentina
- 2.3. Rest of South America
-
3. Europe
- 3.1. United Kingdom
- 3.2. Germany
- 3.3. France
- 3.4. Italy
- 3.5. Spain
- 3.6. Russia
- 3.7. Benelux
- 3.8. Nordics
- 3.9. Rest of Europe
-
4. Middle East & Africa
- 4.1. Turkey
- 4.2. Israel
- 4.3. GCC
- 4.4. North Africa
- 4.5. South Africa
- 4.6. Rest of Middle East & Africa
-
5. Asia Pacific
- 5.1. China
- 5.2. India
- 5.3. Japan
- 5.4. South Korea
- 5.5. ASEAN
- 5.6. Oceania
- 5.7. Rest of Asia Pacific
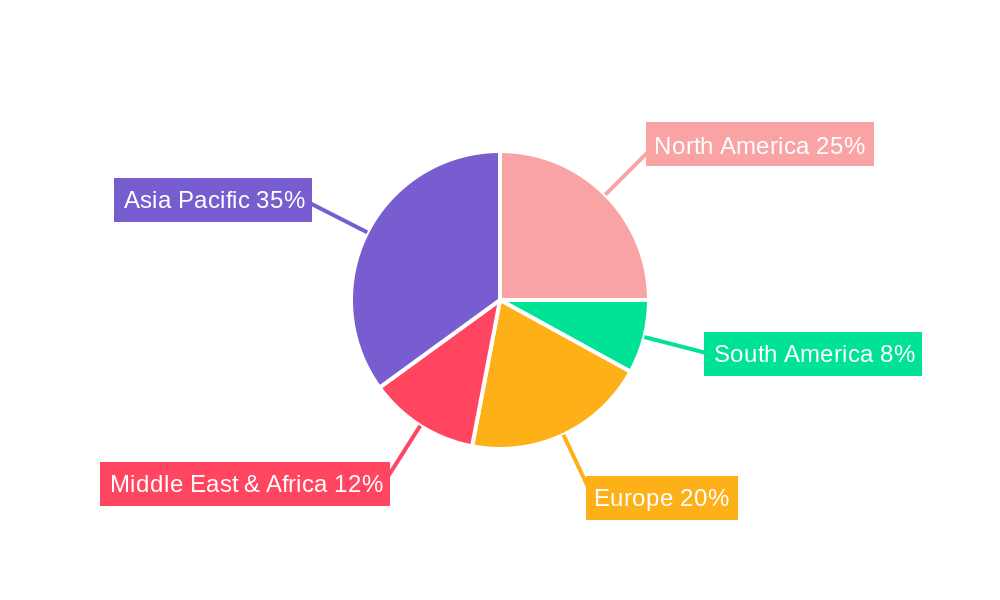
Software Distribution Services Regional Market Share
Geographic Coverage of Software Distribution Services
Software Distribution Services REPORT HIGHLIGHTS
| Aspects | Details |
|---|---|
| Study Period | 2020-2034 |
| Base Year | 2025 |
| Estimated Year | 2026 |
| Forecast Period | 2026-2034 |
| Historical Period | 2020-2025 |
| Growth Rate | CAGR of XX% from 2020-2034 |
| Segmentation |
|
Table of Contents
- 1. Introduction
- 1.1. Research Scope
- 1.2. Market Segmentation
- 1.3. Research Objective
- 1.4. Definitions and Assumptions
- 2. Executive Summary
- 2.1. Market Snapshot
- 3. Market Dynamics
- 3.1. Market Drivers
- 3.2. Market Restrains
- 3.3. Market Trends
- 3.4. Market Opportunities
- 4. Market Factor Analysis
- 4.1. Porters Five Forces
- 4.1.1. Bargaining Power of Suppliers
- 4.1.2. Bargaining Power of Buyers
- 4.1.3. Threat of New Entrants
- 4.1.4. Threat of Substitutes
- 4.1.5. Competitive Rivalry
- 4.2. PESTEL analysis
- 4.3. BCG Analysis
- 4.3.1. Stars (High Growth, High Market Share)
- 4.3.2. Cash Cows (Low Growth, High Market Share)
- 4.3.3. Question Mark (High Growth, Low Market Share)
- 4.3.4. Dogs (Low Growth, Low Market Share)
- 4.4. Ansoff Matrix Analysis
- 4.5. Supply Chain Analysis
- 4.6. Regulatory Landscape
- 4.7. Current Market Potential and Opportunity Assessment (TAM–SAM–SOM Framework)
- 4.8. DMV Analyst Note
- 4.1. Porters Five Forces
- 5. Market Analysis, Insights and Forecast 2021-2033
- 5.1. Market Analysis, Insights and Forecast - by Application
- 5.1.1. Mobile Phone
- 5.1.2. Smart TV
- 5.1.3. Smart Watches
- 5.1.4. Others
- 5.2. Market Analysis, Insights and Forecast - by Types
- 5.2.1. iOS
- 5.2.2. Android
- 5.2.3. Other
- 5.3. Market Analysis, Insights and Forecast - by Region
- 5.3.1. North America
- 5.3.2. South America
- 5.3.3. Europe
- 5.3.4. Middle East & Africa
- 5.3.5. Asia Pacific
- 5.1. Market Analysis, Insights and Forecast - by Application
- 6. Global Software Distribution Services Analysis, Insights and Forecast, 2021-2033
- 6.1. Market Analysis, Insights and Forecast - by Application
- 6.1.1. Mobile Phone
- 6.1.2. Smart TV
- 6.1.3. Smart Watches
- 6.1.4. Others
- 6.2. Market Analysis, Insights and Forecast - by Types
- 6.2.1. iOS
- 6.2.2. Android
- 6.2.3. Other
- 6.1. Market Analysis, Insights and Forecast - by Application
- 7. North America Software Distribution Services Analysis, Insights and Forecast, 2020-2032
- 7.1. Market Analysis, Insights and Forecast - by Application
- 7.1.1. Mobile Phone
- 7.1.2. Smart TV
- 7.1.3. Smart Watches
- 7.1.4. Others
- 7.2. Market Analysis, Insights and Forecast - by Types
- 7.2.1. iOS
- 7.2.2. Android
- 7.2.3. Other
- 7.1. Market Analysis, Insights and Forecast - by Application
- 8. South America Software Distribution Services Analysis, Insights and Forecast, 2020-2032
- 8.1. Market Analysis, Insights and Forecast - by Application
- 8.1.1. Mobile Phone
- 8.1.2. Smart TV
- 8.1.3. Smart Watches
- 8.1.4. Others
- 8.2. Market Analysis, Insights and Forecast - by Types
- 8.2.1. iOS
- 8.2.2. Android
- 8.2.3. Other
- 8.1. Market Analysis, Insights and Forecast - by Application
- 9. Europe Software Distribution Services Analysis, Insights and Forecast, 2020-2032
- 9.1. Market Analysis, Insights and Forecast - by Application
- 9.1.1. Mobile Phone
- 9.1.2. Smart TV
- 9.1.3. Smart Watches
- 9.1.4. Others
- 9.2. Market Analysis, Insights and Forecast - by Types
- 9.2.1. iOS
- 9.2.2. Android
- 9.2.3. Other
- 9.1. Market Analysis, Insights and Forecast - by Application
- 10. Middle East & Africa Software Distribution Services Analysis, Insights and Forecast, 2020-2032
- 10.1. Market Analysis, Insights and Forecast - by Application
- 10.1.1. Mobile Phone
- 10.1.2. Smart TV
- 10.1.3. Smart Watches
- 10.1.4. Others
- 10.2. Market Analysis, Insights and Forecast - by Types
- 10.2.1. iOS
- 10.2.2. Android
- 10.2.3. Other
- 10.1. Market Analysis, Insights and Forecast - by Application
- 11. Asia Pacific Software Distribution Services Analysis, Insights and Forecast, 2020-2032
- 11.1. Market Analysis, Insights and Forecast - by Application
- 11.1.1. Mobile Phone
- 11.1.2. Smart TV
- 11.1.3. Smart Watches
- 11.1.4. Others
- 11.2. Market Analysis, Insights and Forecast - by Types
- 11.2.1. iOS
- 11.2.2. Android
- 11.2.3. Other
- 11.1. Market Analysis, Insights and Forecast - by Application
- 12. Competitive Analysis
- 12.1. Company Profiles
- 12.1.1 Apple
- 12.1.1.1. Company Overview
- 12.1.1.2. Products
- 12.1.1.3. Company Financials
- 12.1.1.4. SWOT Analysis
- 12.1.2 Google
- 12.1.2.1. Company Overview
- 12.1.2.2. Products
- 12.1.2.3. Company Financials
- 12.1.2.4. SWOT Analysis
- 12.1.3 Huawei
- 12.1.3.1. Company Overview
- 12.1.3.2. Products
- 12.1.3.3. Company Financials
- 12.1.3.4. SWOT Analysis
- 12.1.4 Samsung
- 12.1.4.1. Company Overview
- 12.1.4.2. Products
- 12.1.4.3. Company Financials
- 12.1.4.4. SWOT Analysis
- 12.1.5 XiaoMi
- 12.1.5.1. Company Overview
- 12.1.5.2. Products
- 12.1.5.3. Company Financials
- 12.1.5.4. SWOT Analysis
- 12.1.6 Tencent
- 12.1.6.1. Company Overview
- 12.1.6.2. Products
- 12.1.6.3. Company Financials
- 12.1.6.4. SWOT Analysis
- 12.1.7 Facebook
- 12.1.7.1. Company Overview
- 12.1.7.2. Products
- 12.1.7.3. Company Financials
- 12.1.7.4. SWOT Analysis
- 12.1.8 Microsoft
- 12.1.8.1. Company Overview
- 12.1.8.2. Products
- 12.1.8.3. Company Financials
- 12.1.8.4. SWOT Analysis
- 12.1.9 Amazon
- 12.1.9.1. Company Overview
- 12.1.9.2. Products
- 12.1.9.3. Company Financials
- 12.1.9.4. SWOT Analysis
- 12.1.10 BBK
- 12.1.10.1. Company Overview
- 12.1.10.2. Products
- 12.1.10.3. Company Financials
- 12.1.10.4. SWOT Analysis
- 12.1.11 Baidu
- 12.1.11.1. Company Overview
- 12.1.11.2. Products
- 12.1.11.3. Company Financials
- 12.1.11.4. SWOT Analysis
- 12.1.12 Yandex
- 12.1.12.1. Company Overview
- 12.1.12.2. Products
- 12.1.12.3. Company Financials
- 12.1.12.4. SWOT Analysis
- 12.1.1 Apple
- 12.2. Market Entropy
- 12.2.1 Company's Key Areas Served
- 12.2.2 Recent Developments
- 12.3. Company Market Share Analysis 2025
- 12.3.1 Top 5 Companies Market Share Analysis
- 12.3.2 Top 3 Companies Market Share Analysis
- 12.4. List of Potential Customers
- 13. Research Methodology
List of Figures
- Figure 1: Global Software Distribution Services Revenue Breakdown (million, %) by Region 2025 & 2033
- Figure 2: North America Software Distribution Services Revenue (million), by Application 2025 & 2033
- Figure 3: North America Software Distribution Services Revenue Share (%), by Application 2025 & 2033
- Figure 4: North America Software Distribution Services Revenue (million), by Types 2025 & 2033
- Figure 5: North America Software Distribution Services Revenue Share (%), by Types 2025 & 2033
- Figure 6: North America Software Distribution Services Revenue (million), by Country 2025 & 2033
- Figure 7: North America Software Distribution Services Revenue Share (%), by Country 2025 & 2033
- Figure 8: South America Software Distribution Services Revenue (million), by Application 2025 & 2033
- Figure 9: South America Software Distribution Services Revenue Share (%), by Application 2025 & 2033
- Figure 10: South America Software Distribution Services Revenue (million), by Types 2025 & 2033
- Figure 11: South America Software Distribution Services Revenue Share (%), by Types 2025 & 2033
- Figure 12: South America Software Distribution Services Revenue (million), by Country 2025 & 2033
- Figure 13: South America Software Distribution Services Revenue Share (%), by Country 2025 & 2033
- Figure 14: Europe Software Distribution Services Revenue (million), by Application 2025 & 2033
- Figure 15: Europe Software Distribution Services Revenue Share (%), by Application 2025 & 2033
- Figure 16: Europe Software Distribution Services Revenue (million), by Types 2025 & 2033
- Figure 17: Europe Software Distribution Services Revenue Share (%), by Types 2025 & 2033
- Figure 18: Europe Software Distribution Services Revenue (million), by Country 2025 & 2033
- Figure 19: Europe Software Distribution Services Revenue Share (%), by Country 2025 & 2033
- Figure 20: Middle East & Africa Software Distribution Services Revenue (million), by Application 2025 & 2033
- Figure 21: Middle East & Africa Software Distribution Services Revenue Share (%), by Application 2025 & 2033
- Figure 22: Middle East & Africa Software Distribution Services Revenue (million), by Types 2025 & 2033
- Figure 23: Middle East & Africa Software Distribution Services Revenue Share (%), by Types 2025 & 2033
- Figure 24: Middle East & Africa Software Distribution Services Revenue (million), by Country 2025 & 2033
- Figure 25: Middle East & Africa Software Distribution Services Revenue Share (%), by Country 2025 & 2033
- Figure 26: Asia Pacific Software Distribution Services Revenue (million), by Application 2025 & 2033
- Figure 27: Asia Pacific Software Distribution Services Revenue Share (%), by Application 2025 & 2033
- Figure 28: Asia Pacific Software Distribution Services Revenue (million), by Types 2025 & 2033
- Figure 29: Asia Pacific Software Distribution Services Revenue Share (%), by Types 2025 & 2033
- Figure 30: Asia Pacific Software Distribution Services Revenue (million), by Country 2025 & 2033
- Figure 31: Asia Pacific Software Distribution Services Revenue Share (%), by Country 2025 & 2033
List of Tables
- Table 1: Global Software Distribution Services Revenue million Forecast, by Application 2020 & 2033
- Table 2: Global Software Distribution Services Revenue million Forecast, by Types 2020 & 2033
- Table 3: Global Software Distribution Services Revenue million Forecast, by Region 2020 & 2033
- Table 4: Global Software Distribution Services Revenue million Forecast, by Application 2020 & 2033
- Table 5: Global Software Distribution Services Revenue million Forecast, by Types 2020 & 2033
- Table 6: Global Software Distribution Services Revenue million Forecast, by Country 2020 & 2033
- Table 7: United States Software Distribution Services Revenue (million) Forecast, by Application 2020 & 2033
- Table 8: Canada Software Distribution Services Revenue (million) Forecast, by Application 2020 & 2033
- Table 9: Mexico Software Distribution Services Revenue (million) Forecast, by Application 2020 & 2033
- Table 10: Global Software Distribution Services Revenue million Forecast, by Application 2020 & 2033
- Table 11: Global Software Distribution Services Revenue million Forecast, by Types 2020 & 2033
- Table 12: Global Software Distribution Services Revenue million Forecast, by Country 2020 & 2033
- Table 13: Brazil Software Distribution Services Revenue (million) Forecast, by Application 2020 & 2033
- Table 14: Argentina Software Distribution Services Revenue (million) Forecast, by Application 2020 & 2033
- Table 15: Rest of South America Software Distribution Services Revenue (million) Forecast, by Application 2020 & 2033
- Table 16: Global Software Distribution Services Revenue million Forecast, by Application 2020 & 2033
- Table 17: Global Software Distribution Services Revenue million Forecast, by Types 2020 & 2033
- Table 18: Global Software Distribution Services Revenue million Forecast, by Country 2020 & 2033
- Table 19: United Kingdom Software Distribution Services Revenue (million) Forecast, by Application 2020 & 2033
- Table 20: Germany Software Distribution Services Revenue (million) Forecast, by Application 2020 & 2033
- Table 21: France Software Distribution Services Revenue (million) Forecast, by Application 2020 & 2033
- Table 22: Italy Software Distribution Services Revenue (million) Forecast, by Application 2020 & 2033
- Table 23: Spain Software Distribution Services Revenue (million) Forecast, by Application 2020 & 2033
- Table 24: Russia Software Distribution Services Revenue (million) Forecast, by Application 2020 & 2033
- Table 25: Benelux Software Distribution Services Revenue (million) Forecast, by Application 2020 & 2033
- Table 26: Nordics Software Distribution Services Revenue (million) Forecast, by Application 2020 & 2033
- Table 27: Rest of Europe Software Distribution Services Revenue (million) Forecast, by Application 2020 & 2033
- Table 28: Global Software Distribution Services Revenue million Forecast, by Application 2020 & 2033
- Table 29: Global Software Distribution Services Revenue million Forecast, by Types 2020 & 2033
- Table 30: Global Software Distribution Services Revenue million Forecast, by Country 2020 & 2033
- Table 31: Turkey Software Distribution Services Revenue (million) Forecast, by Application 2020 & 2033
- Table 32: Israel Software Distribution Services Revenue (million) Forecast, by Application 2020 & 2033
- Table 33: GCC Software Distribution Services Revenue (million) Forecast, by Application 2020 & 2033
- Table 34: North Africa Software Distribution Services Revenue (million) Forecast, by Application 2020 & 2033
- Table 35: South Africa Software Distribution Services Revenue (million) Forecast, by Application 2020 & 2033
- Table 36: Rest of Middle East & Africa Software Distribution Services Revenue (million) Forecast, by Application 2020 & 2033
- Table 37: Global Software Distribution Services Revenue million Forecast, by Application 2020 & 2033
- Table 38: Global Software Distribution Services Revenue million Forecast, by Types 2020 & 2033
- Table 39: Global Software Distribution Services Revenue million Forecast, by Country 2020 & 2033
- Table 40: China Software Distribution Services Revenue (million) Forecast, by Application 2020 & 2033
- Table 41: India Software Distribution Services Revenue (million) Forecast, by Application 2020 & 2033
- Table 42: Japan Software Distribution Services Revenue (million) Forecast, by Application 2020 & 2033
- Table 43: South Korea Software Distribution Services Revenue (million) Forecast, by Application 2020 & 2033
- Table 44: ASEAN Software Distribution Services Revenue (million) Forecast, by Application 2020 & 2033
- Table 45: Oceania Software Distribution Services Revenue (million) Forecast, by Application 2020 & 2033
- Table 46: Rest of Asia Pacific Software Distribution Services Revenue (million) Forecast, by Application 2020 & 2033
Frequently Asked Questions
1. What is the projected Compound Annual Growth Rate (CAGR) of the Software Distribution Services?
The projected CAGR is approximately XX%.
2. Which companies are prominent players in the Software Distribution Services?
Key companies in the market include Apple, Google, Huawei, Samsung, XiaoMi, Tencent, Facebook, Microsoft, Amazon, BBK, Baidu, Yandex.
3. What are the main segments of the Software Distribution Services?
The market segments include Application, Types.
4. Can you provide details about the market size?
The market size is estimated to be USD XXX million as of 2022.
5. What are some drivers contributing to market growth?
N/A
6. What are the notable trends driving market growth?
N/A
7. Are there any restraints impacting market growth?
N/A
8. Can you provide examples of recent developments in the market?
N/A
9. What pricing options are available for accessing the report?
Pricing options include single-user, multi-user, and enterprise licenses priced at USD 2900.00, USD 4350.00, and USD 5800.00 respectively.
10. Is the market size provided in terms of value or volume?
The market size is provided in terms of value, measured in million.
11. Are there any specific market keywords associated with the report?
Yes, the market keyword associated with the report is "Software Distribution Services," which aids in identifying and referencing the specific market segment covered.
12. How do I determine which pricing option suits my needs best?
The pricing options vary based on user requirements and access needs. Individual users may opt for single-user licenses, while businesses requiring broader access may choose multi-user or enterprise licenses for cost-effective access to the report.
13. Are there any additional resources or data provided in the Software Distribution Services report?
While the report offers comprehensive insights, it's advisable to review the specific contents or supplementary materials provided to ascertain if additional resources or data are available.
14. How can I stay updated on further developments or reports in the Software Distribution Services?
To stay informed about further developments, trends, and reports in the Software Distribution Services, consider subscribing to industry newsletters, following relevant companies and organizations, or regularly checking reputable industry news sources and publications.
Methodology
Step 1 - Identification of Relevant Samples Size from Population Database


Step 2 - Approaches for Defining Global Market Size (Value, Volume* & Price*)

Note*: In applicable scenarios
Step 3 - Data Sources
Primary Research
- Web Analytics
- Survey Reports
- Research Institute
- Latest Research Reports
- Opinion Leaders
Secondary Research
- Annual Reports
- White Paper
- Latest Press Release
- Industry Association
- Paid Database
- Investor Presentations

Step 4 - Data Triangulation
Involves using different sources of information in order to increase the validity of a study
These sources are likely to be stakeholders in a program - participants, other researchers, program staff, other community members, and so on.
Then we put all data in single framework & apply various statistical tools to find out the dynamic on the market.
During the analysis stage, feedback from the stakeholder groups would be compared to determine areas of agreement as well as areas of divergence