

Key Insights
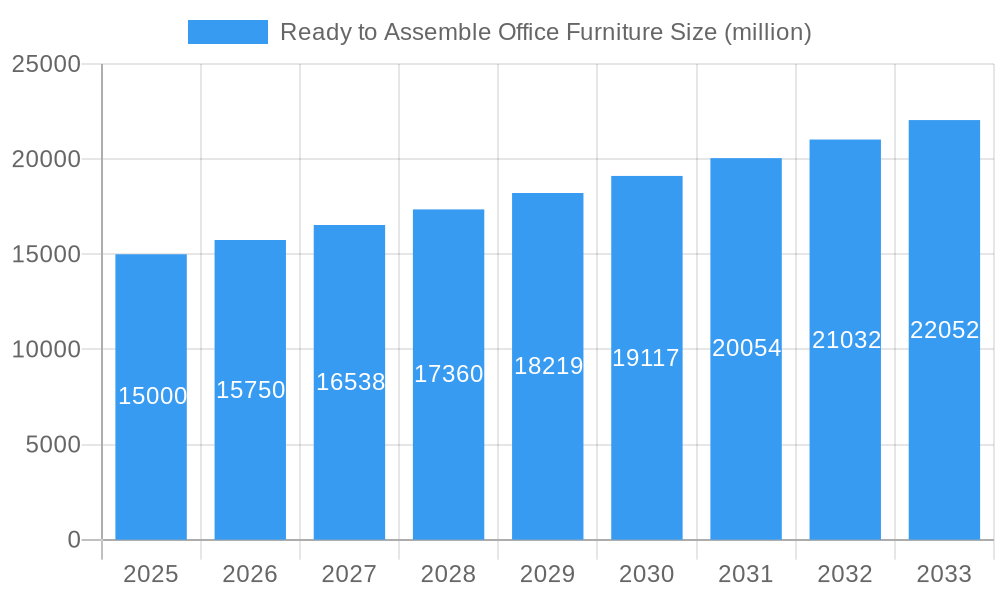
The Ready-to-Assemble (RTA) office furniture market is experiencing robust growth, driven by increasing demand for cost-effective, space-saving, and easily customizable solutions. The market's convenience, particularly for smaller businesses and home offices, is a significant factor contributing to its expansion. Consumers are increasingly drawn to the ease of assembly and transportation associated with RTA furniture, making it a popular choice amidst rising e-commerce adoption. Furthermore, the market benefits from evolving design aesthetics, offering a wide range of styles and functionalities to cater to diverse preferences and workspaces. Major players like IKEA, Bush Industries, and Sauder Woodworking are leveraging their established brand recognition and distribution networks to capture significant market share. The predicted CAGR (assuming a conservative 5% based on industry averages for similar furniture segments) indicates steady, sustainable growth throughout the forecast period (2025-2033). However, potential restraints include fluctuations in raw material prices, increasing labor costs, and the ongoing competition from traditional, fully assembled office furniture.
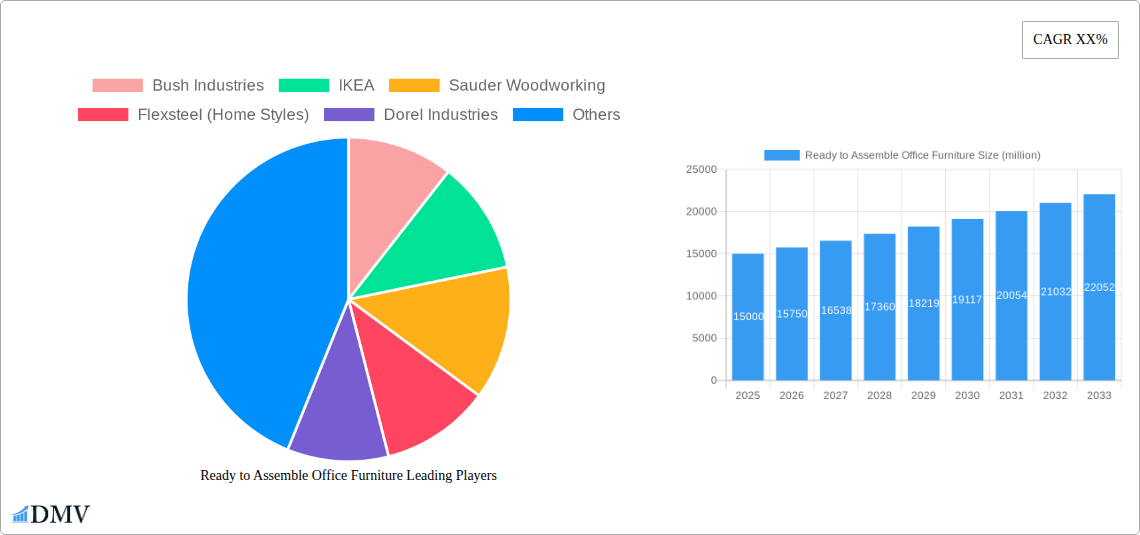
Ready to Assemble Office Furniture Market Size (In Billion)
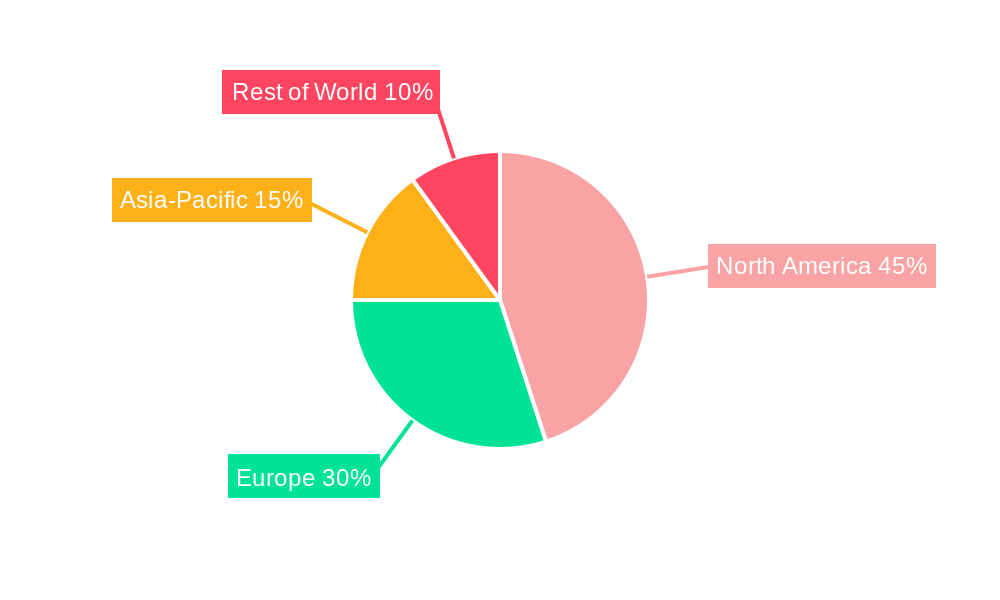
The market segmentation within RTA office furniture is diverse, encompassing desks, chairs, storage units, and other essential office equipment. The North American market currently holds a substantial share, but regions like Europe and Asia-Pacific are experiencing notable growth, propelled by rising urbanization and expanding middle classes. Further research into specific consumer preferences within each region could help manufacturers tailor their product offerings to optimize market penetration. The continued focus on sustainability and eco-friendly materials presents both a challenge and an opportunity for businesses to differentiate themselves and appeal to environmentally conscious consumers. This necessitates investment in sustainable sourcing and manufacturing practices to remain competitive in the long term. Innovation in design and functionality, along with effective marketing strategies targeting specific demographics, will be crucial for success in this dynamic and evolving market.
Ready to Assemble Office Furniture Company Market Share
Ready to Assemble Office Furniture Market Report: A Comprehensive Analysis (2019-2033)
This insightful report provides a comprehensive analysis of the Ready to Assemble (RTA) Office Furniture market, projecting a market valuation exceeding $XX million by 2033. We delve into market dynamics, competitive landscapes, and future growth trajectories, providing crucial insights for stakeholders seeking to navigate this rapidly evolving sector. The study period covers 2019-2033, with 2025 serving as both the base and estimated year. Our forecast spans 2025-2033, building upon historical data from 2019-2024. Key players like Bush Industries, IKEA, Sauder Woodworking, and others are analyzed in detail.
Ready to Assemble Office Furniture Market Composition & Trends
This section dissects the market's structure, highlighting key trends shaping its evolution. We analyze market concentration, revealing the market share distribution among leading players such as IKEA (estimated xx%), Bush Industries (estimated xx%), and Sauder Woodworking (estimated xx%). Innovation drivers, including the rise of sustainable materials and ergonomic designs, are explored alongside regulatory landscapes impacting manufacturing and sales. The report also examines substitute products, such as traditional office furniture and refurbished options, and profiles key end-users, including home offices, small businesses, and large corporations. Finally, significant M&A activities within the industry, including the total value of deals (estimated $XX million) during the historical period are discussed, pinpointing their influence on market consolidation and competition. This analysis equips readers with a thorough understanding of the market's current state and its underlying forces.
Ready to Assemble Office Furniture Industry Evolution
This section charts the evolution of the RTA office furniture market, tracing its growth trajectory from 2019 to 2033. We detail the market’s Compound Annual Growth Rate (CAGR) during the historical period (estimated xx%) and project its future growth (estimated xx% CAGR from 2025-2033). We analyze the impact of technological advancements, such as automated manufacturing processes and e-commerce platforms, on market expansion. The increasing adoption of remote work and flexible workspaces has fueled demand for adaptable and cost-effective RTA furniture, a trend thoroughly analyzed with data illustrating adoption metrics across different segments. The changing consumer demands, favoring convenience, affordability, and sustainability, are explored in depth.
Leading Regions, Countries, or Segments in Ready to Assemble Office Furniture
This section identifies the dominant regions and segments within the RTA office furniture market. The analysis indicates that [Region/Country, e.g., North America] currently holds the largest market share, driven by factors such as:
- High disposable income: Enabling consumers to invest in home office setups.
- Strong e-commerce infrastructure: Facilitating convenient online purchases of RTA furniture.
- Government initiatives promoting remote work: Increasing demand for home office furniture.
The dominance of this region is further explored, evaluating its unique economic conditions, consumer preferences, and regulatory environment. Further analysis delves into the growth potential of other regions, highlighting opportunities and challenges for market expansion.
Ready to Assemble Office Furniture Product Innovations
Recent years have witnessed significant product innovations in RTA office furniture, encompassing enhanced ergonomics, sustainable materials, and smart features. Manufacturers are increasingly integrating technological advancements, such as adjustable height desks and modular designs, to cater to diverse needs and preferences. These innovations not only enhance functionality but also contribute to a more sustainable and customizable office experience. The unique selling propositions of these new products, such as improved comfort, flexibility, and longevity, are also analyzed, along with their performance metrics and market impact.
Propelling Factors for Ready to Assemble Office Furniture Growth
Several factors are driving the growth of the RTA office furniture market. Technological advancements in manufacturing and logistics contribute to cost efficiency and faster delivery times. The growing popularity of remote work and the rise of flexible workspaces are fundamentally reshaping demand. Favorable economic conditions in certain regions, along with supportive government policies promoting home office setups, further fuel market expansion.
Obstacles in the Ready to Assemble Office Furniture Market
Despite its growth potential, the RTA office furniture market faces certain challenges. Supply chain disruptions, particularly those experienced post-2020, have affected production and delivery timelines, increasing costs and impacting consumer satisfaction. Fluctuations in raw material prices and intense competition among manufacturers also create pressure on profit margins. Furthermore, varying regulatory requirements across different regions can add complexity to manufacturing and distribution. These factors are quantified where possible, illustrating their impact on market growth.
Future Opportunities in Ready to Assemble Office Furniture
The RTA office furniture market presents numerous future opportunities. Expansion into new markets, particularly in developing economies with a growing middle class and increasing urbanization, offers significant potential. The incorporation of smart technology and advanced materials will enhance product functionalities and appeal to a wider consumer base. Exploring sustainable and eco-friendly manufacturing practices will cater to the growing environmental consciousness of consumers.
Major Players in the Ready to Assemble Office Furniture Ecosystem
- Bush Industries
- IKEA
- Sauder Woodworking
- Flexsteel (Home Styles)
- Dorel Industries
- Whalen Furniture
- Prepac
- South Shore
- Simplicity Sofas
- Homestar North America
Key Developments in Ready to Assemble Office Furniture Industry
- [Month, Year]: [Company Name] launches a new line of ergonomic RTA desks featuring adjustable height settings.
- [Month, Year]: [Company Name] acquires [Company Name], expanding its product portfolio and market reach.
- [Month, Year]: New regulations regarding sustainable materials in furniture manufacturing are implemented in [Region/Country].
- [Month, Year]: A major retailer introduces a new platform dedicated to RTA office furniture, significantly enhancing online accessibility.
- [Month, Year]: A significant supply chain disruption impacts the availability of key raw materials, affecting production capacity.
Strategic Ready to Assemble Office Furniture Market Forecast
The RTA office furniture market is poised for robust growth in the coming years, driven by sustained demand from remote workers, small businesses, and corporations embracing flexible work models. Technological innovations and the growing emphasis on sustainability will continue to shape product development and consumer preferences. The market's expansion will be further facilitated by the evolving retail landscape and the adoption of advanced e-commerce strategies. The forecast suggests a significant increase in market value, driven by these key factors, creating opportunities for both established and emerging players.
Ready to Assemble Office Furniture Segmentation
-
1. Application
- 1.1. Office
- 1.2. School
- 1.3. Government
- 1.4. Others
-
2. Types
- 2.1. Office Desk
- 2.2. Filing Cabinet
- 2.3. Bookcase
- 2.4. Others
Ready to Assemble Office Furniture Segmentation By Geography
-
1. North America
- 1.1. United States
- 1.2. Canada
- 1.3. Mexico
-
2. South America
- 2.1. Brazil
- 2.2. Argentina
- 2.3. Rest of South America
-
3. Europe
- 3.1. United Kingdom
- 3.2. Germany
- 3.3. France
- 3.4. Italy
- 3.5. Spain
- 3.6. Russia
- 3.7. Benelux
- 3.8. Nordics
- 3.9. Rest of Europe
-
4. Middle East & Africa
- 4.1. Turkey
- 4.2. Israel
- 4.3. GCC
- 4.4. North Africa
- 4.5. South Africa
- 4.6. Rest of Middle East & Africa
-
5. Asia Pacific
- 5.1. China
- 5.2. India
- 5.3. Japan
- 5.4. South Korea
- 5.5. ASEAN
- 5.6. Oceania
- 5.7. Rest of Asia Pacific
Ready to Assemble Office Furniture Regional Market Share
Geographic Coverage of Ready to Assemble Office Furniture
Ready to Assemble Office Furniture REPORT HIGHLIGHTS
| Aspects | Details |
|---|---|
| Study Period | 2020-2034 |
| Base Year | 2025 |
| Estimated Year | 2026 |
| Forecast Period | 2026-2034 |
| Historical Period | 2020-2025 |
| Growth Rate | CAGR of 7.17% from 2020-2034 |
| Segmentation |
|
Table of Contents
- 1. Introduction
- 1.1. Research Scope
- 1.2. Market Segmentation
- 1.3. Research Objective
- 1.4. Definitions and Assumptions
- 2. Executive Summary
- 2.1. Market Snapshot
- 3. Market Dynamics
- 3.1. Market Drivers
- 3.2. Market Restrains
- 3.3. Market Trends
- 3.4. Market Opportunities
- 4. Market Factor Analysis
- 4.1. Porters Five Forces
- 4.1.1. Bargaining Power of Suppliers
- 4.1.2. Bargaining Power of Buyers
- 4.1.3. Threat of New Entrants
- 4.1.4. Threat of Substitutes
- 4.1.5. Competitive Rivalry
- 4.2. PESTEL analysis
- 4.3. BCG Analysis
- 4.3.1. Stars (High Growth, High Market Share)
- 4.3.2. Cash Cows (Low Growth, High Market Share)
- 4.3.3. Question Mark (High Growth, Low Market Share)
- 4.3.4. Dogs (Low Growth, Low Market Share)
- 4.4. Ansoff Matrix Analysis
- 4.5. Supply Chain Analysis
- 4.6. Regulatory Landscape
- 4.7. Current Market Potential and Opportunity Assessment (TAM–SAM–SOM Framework)
- 4.8. DMV Analyst Note
- 4.1. Porters Five Forces
- 5. Market Analysis, Insights and Forecast 2021-2033
- 5.1. Market Analysis, Insights and Forecast - by Application
- 5.1.1. Office
- 5.1.2. School
- 5.1.3. Government
- 5.1.4. Others
- 5.2. Market Analysis, Insights and Forecast - by Types
- 5.2.1. Office Desk
- 5.2.2. Filing Cabinet
- 5.2.3. Bookcase
- 5.2.4. Others
- 5.3. Market Analysis, Insights and Forecast - by Region
- 5.3.1. North America
- 5.3.2. South America
- 5.3.3. Europe
- 5.3.4. Middle East & Africa
- 5.3.5. Asia Pacific
- 5.1. Market Analysis, Insights and Forecast - by Application
- 6. Global Ready to Assemble Office Furniture Analysis, Insights and Forecast, 2021-2033
- 6.1. Market Analysis, Insights and Forecast - by Application
- 6.1.1. Office
- 6.1.2. School
- 6.1.3. Government
- 6.1.4. Others
- 6.2. Market Analysis, Insights and Forecast - by Types
- 6.2.1. Office Desk
- 6.2.2. Filing Cabinet
- 6.2.3. Bookcase
- 6.2.4. Others
- 6.1. Market Analysis, Insights and Forecast - by Application
- 7. North America Ready to Assemble Office Furniture Analysis, Insights and Forecast, 2020-2032
- 7.1. Market Analysis, Insights and Forecast - by Application
- 7.1.1. Office
- 7.1.2. School
- 7.1.3. Government
- 7.1.4. Others
- 7.2. Market Analysis, Insights and Forecast - by Types
- 7.2.1. Office Desk
- 7.2.2. Filing Cabinet
- 7.2.3. Bookcase
- 7.2.4. Others
- 7.1. Market Analysis, Insights and Forecast - by Application
- 8. South America Ready to Assemble Office Furniture Analysis, Insights and Forecast, 2020-2032
- 8.1. Market Analysis, Insights and Forecast - by Application
- 8.1.1. Office
- 8.1.2. School
- 8.1.3. Government
- 8.1.4. Others
- 8.2. Market Analysis, Insights and Forecast - by Types
- 8.2.1. Office Desk
- 8.2.2. Filing Cabinet
- 8.2.3. Bookcase
- 8.2.4. Others
- 8.1. Market Analysis, Insights and Forecast - by Application
- 9. Europe Ready to Assemble Office Furniture Analysis, Insights and Forecast, 2020-2032
- 9.1. Market Analysis, Insights and Forecast - by Application
- 9.1.1. Office
- 9.1.2. School
- 9.1.3. Government
- 9.1.4. Others
- 9.2. Market Analysis, Insights and Forecast - by Types
- 9.2.1. Office Desk
- 9.2.2. Filing Cabinet
- 9.2.3. Bookcase
- 9.2.4. Others
- 9.1. Market Analysis, Insights and Forecast - by Application
- 10. Middle East & Africa Ready to Assemble Office Furniture Analysis, Insights and Forecast, 2020-2032
- 10.1. Market Analysis, Insights and Forecast - by Application
- 10.1.1. Office
- 10.1.2. School
- 10.1.3. Government
- 10.1.4. Others
- 10.2. Market Analysis, Insights and Forecast - by Types
- 10.2.1. Office Desk
- 10.2.2. Filing Cabinet
- 10.2.3. Bookcase
- 10.2.4. Others
- 10.1. Market Analysis, Insights and Forecast - by Application
- 11. Asia Pacific Ready to Assemble Office Furniture Analysis, Insights and Forecast, 2020-2032
- 11.1. Market Analysis, Insights and Forecast - by Application
- 11.1.1. Office
- 11.1.2. School
- 11.1.3. Government
- 11.1.4. Others
- 11.2. Market Analysis, Insights and Forecast - by Types
- 11.2.1. Office Desk
- 11.2.2. Filing Cabinet
- 11.2.3. Bookcase
- 11.2.4. Others
- 11.1. Market Analysis, Insights and Forecast - by Application
- 12. Competitive Analysis
- 12.1. Company Profiles
- 12.1.1 Bush Industries
- 12.1.1.1. Company Overview
- 12.1.1.2. Products
- 12.1.1.3. Company Financials
- 12.1.1.4. SWOT Analysis
- 12.1.2 IKEA
- 12.1.2.1. Company Overview
- 12.1.2.2. Products
- 12.1.2.3. Company Financials
- 12.1.2.4. SWOT Analysis
- 12.1.3 Sauder Woodworking
- 12.1.3.1. Company Overview
- 12.1.3.2. Products
- 12.1.3.3. Company Financials
- 12.1.3.4. SWOT Analysis
- 12.1.4 Flexsteel (Home Styles)
- 12.1.4.1. Company Overview
- 12.1.4.2. Products
- 12.1.4.3. Company Financials
- 12.1.4.4. SWOT Analysis
- 12.1.5 Dorel Industries
- 12.1.5.1. Company Overview
- 12.1.5.2. Products
- 12.1.5.3. Company Financials
- 12.1.5.4. SWOT Analysis
- 12.1.6 Whalen Furniture
- 12.1.6.1. Company Overview
- 12.1.6.2. Products
- 12.1.6.3. Company Financials
- 12.1.6.4. SWOT Analysis
- 12.1.7 Prepac
- 12.1.7.1. Company Overview
- 12.1.7.2. Products
- 12.1.7.3. Company Financials
- 12.1.7.4. SWOT Analysis
- 12.1.8 South Shore
- 12.1.8.1. Company Overview
- 12.1.8.2. Products
- 12.1.8.3. Company Financials
- 12.1.8.4. SWOT Analysis
- 12.1.9 Simplicity Sofas
- 12.1.9.1. Company Overview
- 12.1.9.2. Products
- 12.1.9.3. Company Financials
- 12.1.9.4. SWOT Analysis
- 12.1.10 Homestar North America
- 12.1.10.1. Company Overview
- 12.1.10.2. Products
- 12.1.10.3. Company Financials
- 12.1.10.4. SWOT Analysis
- 12.1.1 Bush Industries
- 12.2. Market Entropy
- 12.2.1 Company's Key Areas Served
- 12.2.2 Recent Developments
- 12.3. Company Market Share Analysis 2025
- 12.3.1 Top 5 Companies Market Share Analysis
- 12.3.2 Top 3 Companies Market Share Analysis
- 12.4. List of Potential Customers
- 13. Research Methodology
List of Figures
- Figure 1: Global Ready to Assemble Office Furniture Revenue Breakdown (undefined, %) by Region 2025 & 2033
- Figure 2: Global Ready to Assemble Office Furniture Volume Breakdown (K, %) by Region 2025 & 2033
- Figure 3: North America Ready to Assemble Office Furniture Revenue (undefined), by Application 2025 & 2033
- Figure 4: North America Ready to Assemble Office Furniture Volume (K), by Application 2025 & 2033
- Figure 5: North America Ready to Assemble Office Furniture Revenue Share (%), by Application 2025 & 2033
- Figure 6: North America Ready to Assemble Office Furniture Volume Share (%), by Application 2025 & 2033
- Figure 7: North America Ready to Assemble Office Furniture Revenue (undefined), by Types 2025 & 2033
- Figure 8: North America Ready to Assemble Office Furniture Volume (K), by Types 2025 & 2033
- Figure 9: North America Ready to Assemble Office Furniture Revenue Share (%), by Types 2025 & 2033
- Figure 10: North America Ready to Assemble Office Furniture Volume Share (%), by Types 2025 & 2033
- Figure 11: North America Ready to Assemble Office Furniture Revenue (undefined), by Country 2025 & 2033
- Figure 12: North America Ready to Assemble Office Furniture Volume (K), by Country 2025 & 2033
- Figure 13: North America Ready to Assemble Office Furniture Revenue Share (%), by Country 2025 & 2033
- Figure 14: North America Ready to Assemble Office Furniture Volume Share (%), by Country 2025 & 2033
- Figure 15: South America Ready to Assemble Office Furniture Revenue (undefined), by Application 2025 & 2033
- Figure 16: South America Ready to Assemble Office Furniture Volume (K), by Application 2025 & 2033
- Figure 17: South America Ready to Assemble Office Furniture Revenue Share (%), by Application 2025 & 2033
- Figure 18: South America Ready to Assemble Office Furniture Volume Share (%), by Application 2025 & 2033
- Figure 19: South America Ready to Assemble Office Furniture Revenue (undefined), by Types 2025 & 2033
- Figure 20: South America Ready to Assemble Office Furniture Volume (K), by Types 2025 & 2033
- Figure 21: South America Ready to Assemble Office Furniture Revenue Share (%), by Types 2025 & 2033
- Figure 22: South America Ready to Assemble Office Furniture Volume Share (%), by Types 2025 & 2033
- Figure 23: South America Ready to Assemble Office Furniture Revenue (undefined), by Country 2025 & 2033
- Figure 24: South America Ready to Assemble Office Furniture Volume (K), by Country 2025 & 2033
- Figure 25: South America Ready to Assemble Office Furniture Revenue Share (%), by Country 2025 & 2033
- Figure 26: South America Ready to Assemble Office Furniture Volume Share (%), by Country 2025 & 2033
- Figure 27: Europe Ready to Assemble Office Furniture Revenue (undefined), by Application 2025 & 2033
- Figure 28: Europe Ready to Assemble Office Furniture Volume (K), by Application 2025 & 2033
- Figure 29: Europe Ready to Assemble Office Furniture Revenue Share (%), by Application 2025 & 2033
- Figure 30: Europe Ready to Assemble Office Furniture Volume Share (%), by Application 2025 & 2033
- Figure 31: Europe Ready to Assemble Office Furniture Revenue (undefined), by Types 2025 & 2033
- Figure 32: Europe Ready to Assemble Office Furniture Volume (K), by Types 2025 & 2033
- Figure 33: Europe Ready to Assemble Office Furniture Revenue Share (%), by Types 2025 & 2033
- Figure 34: Europe Ready to Assemble Office Furniture Volume Share (%), by Types 2025 & 2033
- Figure 35: Europe Ready to Assemble Office Furniture Revenue (undefined), by Country 2025 & 2033
- Figure 36: Europe Ready to Assemble Office Furniture Volume (K), by Country 2025 & 2033
- Figure 37: Europe Ready to Assemble Office Furniture Revenue Share (%), by Country 2025 & 2033
- Figure 38: Europe Ready to Assemble Office Furniture Volume Share (%), by Country 2025 & 2033
- Figure 39: Middle East & Africa Ready to Assemble Office Furniture Revenue (undefined), by Application 2025 & 2033
- Figure 40: Middle East & Africa Ready to Assemble Office Furniture Volume (K), by Application 2025 & 2033
- Figure 41: Middle East & Africa Ready to Assemble Office Furniture Revenue Share (%), by Application 2025 & 2033
- Figure 42: Middle East & Africa Ready to Assemble Office Furniture Volume Share (%), by Application 2025 & 2033
- Figure 43: Middle East & Africa Ready to Assemble Office Furniture Revenue (undefined), by Types 2025 & 2033
- Figure 44: Middle East & Africa Ready to Assemble Office Furniture Volume (K), by Types 2025 & 2033
- Figure 45: Middle East & Africa Ready to Assemble Office Furniture Revenue Share (%), by Types 2025 & 2033
- Figure 46: Middle East & Africa Ready to Assemble Office Furniture Volume Share (%), by Types 2025 & 2033
- Figure 47: Middle East & Africa Ready to Assemble Office Furniture Revenue (undefined), by Country 2025 & 2033
- Figure 48: Middle East & Africa Ready to Assemble Office Furniture Volume (K), by Country 2025 & 2033
- Figure 49: Middle East & Africa Ready to Assemble Office Furniture Revenue Share (%), by Country 2025 & 2033
- Figure 50: Middle East & Africa Ready to Assemble Office Furniture Volume Share (%), by Country 2025 & 2033
- Figure 51: Asia Pacific Ready to Assemble Office Furniture Revenue (undefined), by Application 2025 & 2033
- Figure 52: Asia Pacific Ready to Assemble Office Furniture Volume (K), by Application 2025 & 2033
- Figure 53: Asia Pacific Ready to Assemble Office Furniture Revenue Share (%), by Application 2025 & 2033
- Figure 54: Asia Pacific Ready to Assemble Office Furniture Volume Share (%), by Application 2025 & 2033
- Figure 55: Asia Pacific Ready to Assemble Office Furniture Revenue (undefined), by Types 2025 & 2033
- Figure 56: Asia Pacific Ready to Assemble Office Furniture Volume (K), by Types 2025 & 2033
- Figure 57: Asia Pacific Ready to Assemble Office Furniture Revenue Share (%), by Types 2025 & 2033
- Figure 58: Asia Pacific Ready to Assemble Office Furniture Volume Share (%), by Types 2025 & 2033
- Figure 59: Asia Pacific Ready to Assemble Office Furniture Revenue (undefined), by Country 2025 & 2033
- Figure 60: Asia Pacific Ready to Assemble Office Furniture Volume (K), by Country 2025 & 2033
- Figure 61: Asia Pacific Ready to Assemble Office Furniture Revenue Share (%), by Country 2025 & 2033
- Figure 62: Asia Pacific Ready to Assemble Office Furniture Volume Share (%), by Country 2025 & 2033
List of Tables
- Table 1: Global Ready to Assemble Office Furniture Revenue undefined Forecast, by Application 2020 & 2033
- Table 2: Global Ready to Assemble Office Furniture Volume K Forecast, by Application 2020 & 2033
- Table 3: Global Ready to Assemble Office Furniture Revenue undefined Forecast, by Types 2020 & 2033
- Table 4: Global Ready to Assemble Office Furniture Volume K Forecast, by Types 2020 & 2033
- Table 5: Global Ready to Assemble Office Furniture Revenue undefined Forecast, by Region 2020 & 2033
- Table 6: Global Ready to Assemble Office Furniture Volume K Forecast, by Region 2020 & 2033
- Table 7: Global Ready to Assemble Office Furniture Revenue undefined Forecast, by Application 2020 & 2033
- Table 8: Global Ready to Assemble Office Furniture Volume K Forecast, by Application 2020 & 2033
- Table 9: Global Ready to Assemble Office Furniture Revenue undefined Forecast, by Types 2020 & 2033
- Table 10: Global Ready to Assemble Office Furniture Volume K Forecast, by Types 2020 & 2033
- Table 11: Global Ready to Assemble Office Furniture Revenue undefined Forecast, by Country 2020 & 2033
- Table 12: Global Ready to Assemble Office Furniture Volume K Forecast, by Country 2020 & 2033
- Table 13: United States Ready to Assemble Office Furniture Revenue (undefined) Forecast, by Application 2020 & 2033
- Table 14: United States Ready to Assemble Office Furniture Volume (K) Forecast, by Application 2020 & 2033
- Table 15: Canada Ready to Assemble Office Furniture Revenue (undefined) Forecast, by Application 2020 & 2033
- Table 16: Canada Ready to Assemble Office Furniture Volume (K) Forecast, by Application 2020 & 2033
- Table 17: Mexico Ready to Assemble Office Furniture Revenue (undefined) Forecast, by Application 2020 & 2033
- Table 18: Mexico Ready to Assemble Office Furniture Volume (K) Forecast, by Application 2020 & 2033
- Table 19: Global Ready to Assemble Office Furniture Revenue undefined Forecast, by Application 2020 & 2033
- Table 20: Global Ready to Assemble Office Furniture Volume K Forecast, by Application 2020 & 2033
- Table 21: Global Ready to Assemble Office Furniture Revenue undefined Forecast, by Types 2020 & 2033
- Table 22: Global Ready to Assemble Office Furniture Volume K Forecast, by Types 2020 & 2033
- Table 23: Global Ready to Assemble Office Furniture Revenue undefined Forecast, by Country 2020 & 2033
- Table 24: Global Ready to Assemble Office Furniture Volume K Forecast, by Country 2020 & 2033
- Table 25: Brazil Ready to Assemble Office Furniture Revenue (undefined) Forecast, by Application 2020 & 2033
- Table 26: Brazil Ready to Assemble Office Furniture Volume (K) Forecast, by Application 2020 & 2033
- Table 27: Argentina Ready to Assemble Office Furniture Revenue (undefined) Forecast, by Application 2020 & 2033
- Table 28: Argentina Ready to Assemble Office Furniture Volume (K) Forecast, by Application 2020 & 2033
- Table 29: Rest of South America Ready to Assemble Office Furniture Revenue (undefined) Forecast, by Application 2020 & 2033
- Table 30: Rest of South America Ready to Assemble Office Furniture Volume (K) Forecast, by Application 2020 & 2033
- Table 31: Global Ready to Assemble Office Furniture Revenue undefined Forecast, by Application 2020 & 2033
- Table 32: Global Ready to Assemble Office Furniture Volume K Forecast, by Application 2020 & 2033
- Table 33: Global Ready to Assemble Office Furniture Revenue undefined Forecast, by Types 2020 & 2033
- Table 34: Global Ready to Assemble Office Furniture Volume K Forecast, by Types 2020 & 2033
- Table 35: Global Ready to Assemble Office Furniture Revenue undefined Forecast, by Country 2020 & 2033
- Table 36: Global Ready to Assemble Office Furniture Volume K Forecast, by Country 2020 & 2033
- Table 37: United Kingdom Ready to Assemble Office Furniture Revenue (undefined) Forecast, by Application 2020 & 2033
- Table 38: United Kingdom Ready to Assemble Office Furniture Volume (K) Forecast, by Application 2020 & 2033
- Table 39: Germany Ready to Assemble Office Furniture Revenue (undefined) Forecast, by Application 2020 & 2033
- Table 40: Germany Ready to Assemble Office Furniture Volume (K) Forecast, by Application 2020 & 2033
- Table 41: France Ready to Assemble Office Furniture Revenue (undefined) Forecast, by Application 2020 & 2033
- Table 42: France Ready to Assemble Office Furniture Volume (K) Forecast, by Application 2020 & 2033
- Table 43: Italy Ready to Assemble Office Furniture Revenue (undefined) Forecast, by Application 2020 & 2033
- Table 44: Italy Ready to Assemble Office Furniture Volume (K) Forecast, by Application 2020 & 2033
- Table 45: Spain Ready to Assemble Office Furniture Revenue (undefined) Forecast, by Application 2020 & 2033
- Table 46: Spain Ready to Assemble Office Furniture Volume (K) Forecast, by Application 2020 & 2033
- Table 47: Russia Ready to Assemble Office Furniture Revenue (undefined) Forecast, by Application 2020 & 2033
- Table 48: Russia Ready to Assemble Office Furniture Volume (K) Forecast, by Application 2020 & 2033
- Table 49: Benelux Ready to Assemble Office Furniture Revenue (undefined) Forecast, by Application 2020 & 2033
- Table 50: Benelux Ready to Assemble Office Furniture Volume (K) Forecast, by Application 2020 & 2033
- Table 51: Nordics Ready to Assemble Office Furniture Revenue (undefined) Forecast, by Application 2020 & 2033
- Table 52: Nordics Ready to Assemble Office Furniture Volume (K) Forecast, by Application 2020 & 2033
- Table 53: Rest of Europe Ready to Assemble Office Furniture Revenue (undefined) Forecast, by Application 2020 & 2033
- Table 54: Rest of Europe Ready to Assemble Office Furniture Volume (K) Forecast, by Application 2020 & 2033
- Table 55: Global Ready to Assemble Office Furniture Revenue undefined Forecast, by Application 2020 & 2033
- Table 56: Global Ready to Assemble Office Furniture Volume K Forecast, by Application 2020 & 2033
- Table 57: Global Ready to Assemble Office Furniture Revenue undefined Forecast, by Types 2020 & 2033
- Table 58: Global Ready to Assemble Office Furniture Volume K Forecast, by Types 2020 & 2033
- Table 59: Global Ready to Assemble Office Furniture Revenue undefined Forecast, by Country 2020 & 2033
- Table 60: Global Ready to Assemble Office Furniture Volume K Forecast, by Country 2020 & 2033
- Table 61: Turkey Ready to Assemble Office Furniture Revenue (undefined) Forecast, by Application 2020 & 2033
- Table 62: Turkey Ready to Assemble Office Furniture Volume (K) Forecast, by Application 2020 & 2033
- Table 63: Israel Ready to Assemble Office Furniture Revenue (undefined) Forecast, by Application 2020 & 2033
- Table 64: Israel Ready to Assemble Office Furniture Volume (K) Forecast, by Application 2020 & 2033
- Table 65: GCC Ready to Assemble Office Furniture Revenue (undefined) Forecast, by Application 2020 & 2033
- Table 66: GCC Ready to Assemble Office Furniture Volume (K) Forecast, by Application 2020 & 2033
- Table 67: North Africa Ready to Assemble Office Furniture Revenue (undefined) Forecast, by Application 2020 & 2033
- Table 68: North Africa Ready to Assemble Office Furniture Volume (K) Forecast, by Application 2020 & 2033
- Table 69: South Africa Ready to Assemble Office Furniture Revenue (undefined) Forecast, by Application 2020 & 2033
- Table 70: South Africa Ready to Assemble Office Furniture Volume (K) Forecast, by Application 2020 & 2033
- Table 71: Rest of Middle East & Africa Ready to Assemble Office Furniture Revenue (undefined) Forecast, by Application 2020 & 2033
- Table 72: Rest of Middle East & Africa Ready to Assemble Office Furniture Volume (K) Forecast, by Application 2020 & 2033
- Table 73: Global Ready to Assemble Office Furniture Revenue undefined Forecast, by Application 2020 & 2033
- Table 74: Global Ready to Assemble Office Furniture Volume K Forecast, by Application 2020 & 2033
- Table 75: Global Ready to Assemble Office Furniture Revenue undefined Forecast, by Types 2020 & 2033
- Table 76: Global Ready to Assemble Office Furniture Volume K Forecast, by Types 2020 & 2033
- Table 77: Global Ready to Assemble Office Furniture Revenue undefined Forecast, by Country 2020 & 2033
- Table 78: Global Ready to Assemble Office Furniture Volume K Forecast, by Country 2020 & 2033
- Table 79: China Ready to Assemble Office Furniture Revenue (undefined) Forecast, by Application 2020 & 2033
- Table 80: China Ready to Assemble Office Furniture Volume (K) Forecast, by Application 2020 & 2033
- Table 81: India Ready to Assemble Office Furniture Revenue (undefined) Forecast, by Application 2020 & 2033
- Table 82: India Ready to Assemble Office Furniture Volume (K) Forecast, by Application 2020 & 2033
- Table 83: Japan Ready to Assemble Office Furniture Revenue (undefined) Forecast, by Application 2020 & 2033
- Table 84: Japan Ready to Assemble Office Furniture Volume (K) Forecast, by Application 2020 & 2033
- Table 85: South Korea Ready to Assemble Office Furniture Revenue (undefined) Forecast, by Application 2020 & 2033
- Table 86: South Korea Ready to Assemble Office Furniture Volume (K) Forecast, by Application 2020 & 2033
- Table 87: ASEAN Ready to Assemble Office Furniture Revenue (undefined) Forecast, by Application 2020 & 2033
- Table 88: ASEAN Ready to Assemble Office Furniture Volume (K) Forecast, by Application 2020 & 2033
- Table 89: Oceania Ready to Assemble Office Furniture Revenue (undefined) Forecast, by Application 2020 & 2033
- Table 90: Oceania Ready to Assemble Office Furniture Volume (K) Forecast, by Application 2020 & 2033
- Table 91: Rest of Asia Pacific Ready to Assemble Office Furniture Revenue (undefined) Forecast, by Application 2020 & 2033
- Table 92: Rest of Asia Pacific Ready to Assemble Office Furniture Volume (K) Forecast, by Application 2020 & 2033
Frequently Asked Questions
1. What is the projected Compound Annual Growth Rate (CAGR) of the Ready to Assemble Office Furniture?
The projected CAGR is approximately 7.17%.
2. Which companies are prominent players in the Ready to Assemble Office Furniture?
Key companies in the market include Bush Industries, IKEA, Sauder Woodworking, Flexsteel (Home Styles), Dorel Industries, Whalen Furniture, Prepac, South Shore, Simplicity Sofas, Homestar North America.
3. What are the main segments of the Ready to Assemble Office Furniture?
The market segments include Application, Types.
4. Can you provide details about the market size?
The market size is estimated to be USD XXX N/A as of 2022.
5. What are some drivers contributing to market growth?
N/A
6. What are the notable trends driving market growth?
N/A
7. Are there any restraints impacting market growth?
N/A
8. Can you provide examples of recent developments in the market?
N/A
9. What pricing options are available for accessing the report?
Pricing options include single-user, multi-user, and enterprise licenses priced at USD 3950.00, USD 5925.00, and USD 7900.00 respectively.
10. Is the market size provided in terms of value or volume?
The market size is provided in terms of value, measured in N/A and volume, measured in K.
11. Are there any specific market keywords associated with the report?
Yes, the market keyword associated with the report is "Ready to Assemble Office Furniture," which aids in identifying and referencing the specific market segment covered.
12. How do I determine which pricing option suits my needs best?
The pricing options vary based on user requirements and access needs. Individual users may opt for single-user licenses, while businesses requiring broader access may choose multi-user or enterprise licenses for cost-effective access to the report.
13. Are there any additional resources or data provided in the Ready to Assemble Office Furniture report?
While the report offers comprehensive insights, it's advisable to review the specific contents or supplementary materials provided to ascertain if additional resources or data are available.
14. How can I stay updated on further developments or reports in the Ready to Assemble Office Furniture?
To stay informed about further developments, trends, and reports in the Ready to Assemble Office Furniture, consider subscribing to industry newsletters, following relevant companies and organizations, or regularly checking reputable industry news sources and publications.
Methodology
Step 1 - Identification of Relevant Samples Size from Population Database


Step 2 - Approaches for Defining Global Market Size (Value, Volume* & Price*)

Note*: In applicable scenarios
Step 3 - Data Sources
Primary Research
- Web Analytics
- Survey Reports
- Research Institute
- Latest Research Reports
- Opinion Leaders
Secondary Research
- Annual Reports
- White Paper
- Latest Press Release
- Industry Association
- Paid Database
- Investor Presentations

Step 4 - Data Triangulation
Involves using different sources of information in order to increase the validity of a study
These sources are likely to be stakeholders in a program - participants, other researchers, program staff, other community members, and so on.
Then we put all data in single framework & apply various statistical tools to find out the dynamic on the market.
During the analysis stage, feedback from the stakeholder groups would be compared to determine areas of agreement as well as areas of divergence