

Key Insights
The global reach stacker market, projected to reach $3.2 billion in 2025, is set for substantial growth at a CAGR of 6.9% from 2025 to 2033. Key growth drivers include expanding seaports, increasing demand for efficient cargo handling, and the surge in e-commerce-driven containerized freight. Technological advancements, such as hybrid powertrains and enhanced automation, are also boosting operational efficiency and market demand. Infrastructure development investments in emerging economies, particularly in Asia-Pacific and Latin America, further stimulate market expansion. Despite challenges like high initial investment and supply chain risks, the market outlook is positive.
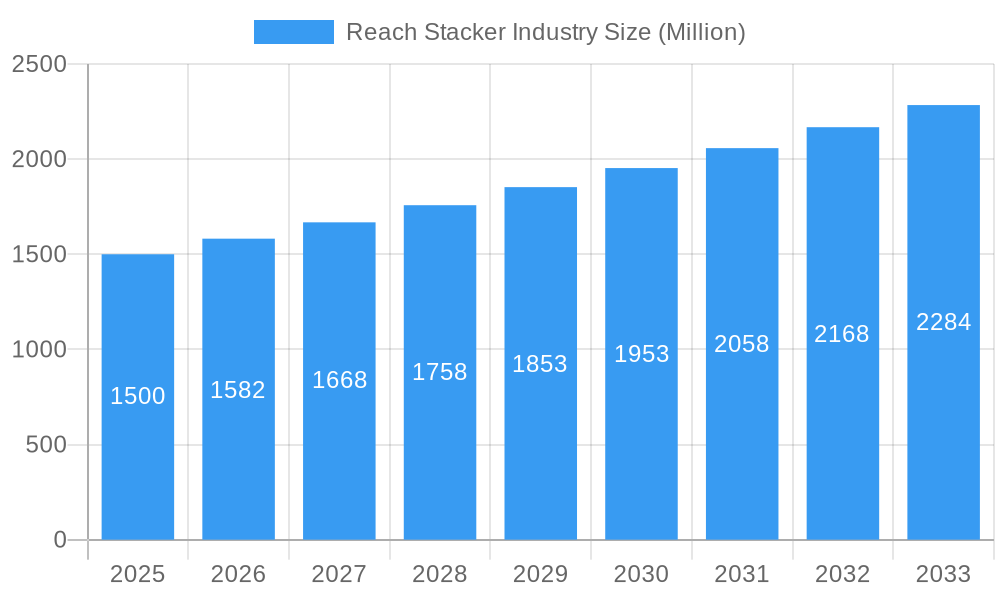
Reach Stacker Industry Market Size (In Billion)
The seaport application segment leads the market due to its critical role in container handling. The medium tonnage segment is expected to maintain a significant share, aligning with prevalent container sizes and handling requirements. Regarding powertrains, while internal combustion (IC) engine reach stackers currently dominate, hybrid models are anticipated to see considerable adoption due to environmental regulations and fuel efficiency demands. Geographically, North America and Europe are established markets, while Asia-Pacific, driven by rapid industrialization in China and India, offers significant future growth potential. The competitive landscape features key players like Konecranes, Liebherr, and Kalmar, alongside other manufacturers focused on product innovation and market expansion.
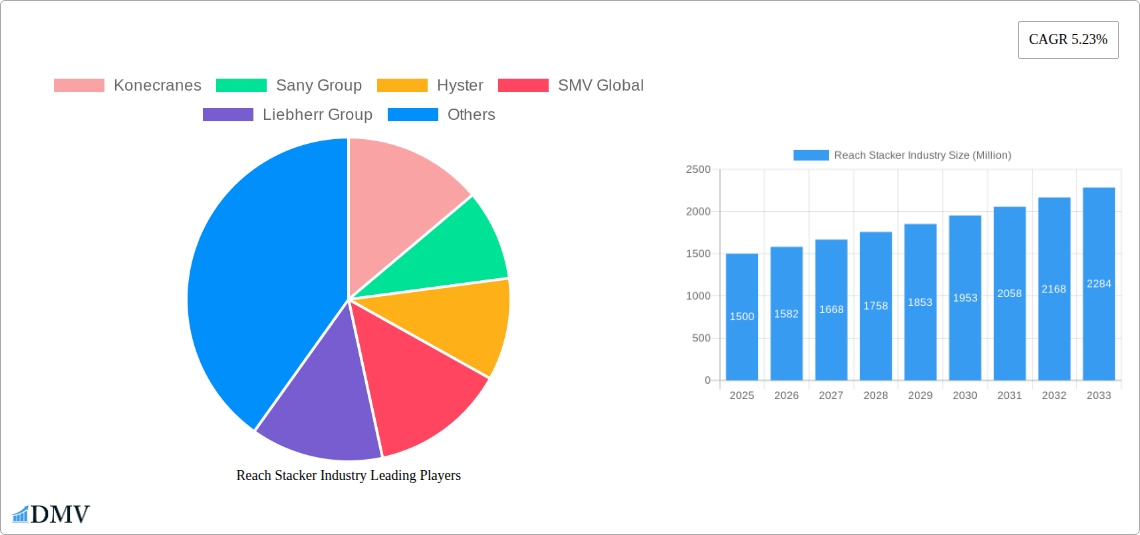
Reach Stacker Industry Company Market Share
Reach Stacker Industry: A Comprehensive Market Report (2019-2033)
This insightful report provides a comprehensive analysis of the global Reach Stacker industry, projecting a market valuation exceeding $XX Billion by 2033. The study meticulously examines market dynamics, competitive landscapes, and future growth trajectories, offering invaluable insights for stakeholders across the value chain. The report covers the period from 2019 to 2033, with 2025 serving as the base and estimated year. This detailed analysis incorporates data from the historical period (2019-2024) and forecasts market trends until 2033.
Reach Stacker Industry Market Composition & Trends
This section delves into the intricate composition of the reach stacker market, analyzing market concentration, innovative advancements, regulatory frameworks, substitute products, end-user profiles, and mergers & acquisitions (M&A) activities. We quantify the market share distribution amongst key players like Konecranes, Sany Group, Hyster, SMV Global, Liebherr Group, Toyota, Kalmar Group, CVS Ferrari S P A, and Terex, revealing a moderately consolidated market with opportunities for both established players and emerging entrants. The report also analyzes the impact of technological innovations, such as hybrid powertrains and advanced automation systems, on market dynamics. Furthermore, it explores the influence of regulatory changes concerning emissions and safety standards, and assesses the competitive threat posed by substitute materials handling equipment. Analysis of M&A activities, including deal values (estimated at $XX Billion over the study period), provides insights into strategic market positioning and industry consolidation.
- Market Share Distribution: Konecranes holds an estimated xx% market share, followed by Sany Group at xx%, and Hyster at xx%. The remaining share is distributed among other players.
- M&A Activity: A total of xx M&A deals were recorded during the historical period (2019-2024), with an aggregate deal value of approximately $XX Billion. The forecast period anticipates an increase in M&A activity driven by consolidation trends.
- Innovation Catalysts: Growing demand for automation, emission reduction regulations, and the adoption of hybrid and electric powertrains are key drivers of innovation.
- Regulatory Landscape: Stringent environmental regulations and safety standards are significantly shaping market dynamics and influencing product development.
Reach Stacker Industry Evolution
This section provides a detailed analysis of the reach stacker industry's evolution, tracing market growth trajectories, technological advancements, and shifts in consumer preferences from 2019 to 2033. The report documents a Compound Annual Growth Rate (CAGR) of xx% during the historical period (2019-2024), primarily fueled by rising global trade volumes and increasing port activities. We project a CAGR of xx% during the forecast period (2025-2033). The adoption of technologically advanced features like remote diagnostics, predictive maintenance, and autonomous operation is increasing, influencing market growth and impacting consumer preferences for efficiency and reduced operational costs. The evolving needs of end-users, such as increased payload capacity, improved fuel efficiency, and enhanced safety features, also shape the industry's evolution. The transition toward eco-friendly technologies like hybrid and electric powertrains is discussed in detail, including adoption rates and projected market penetration.
Leading Regions, Countries, or Segments in Reach Stacker Industry
This section identifies the dominant regions, countries, and segments within the reach stacker market. Based on our analysis, the Sea Ports application segment constitutes the largest market share, followed by the Industrial segment. Within tonnage categories, the Medium tonnage segment dominates, driven by versatile applications across various industries. The IC Engine powertrain type continues to hold the largest market share, but the adoption rate of Hybrid powertrains is significantly increasing.
Key Drivers (Sea Ports Segment):
- Significant investments in port infrastructure modernization and expansion globally.
- Growing global trade volumes leading to increased demand for efficient cargo handling equipment.
- Favorable government policies and incentives supporting port development.
Key Drivers (Medium Tonnage Segment):
- Versatility of medium-tonnage reach stackers applicable across various industries and applications.
- Cost-effectiveness compared to high-tonnage models.
- Suitable for a wide range of cargo handling operations.
Key Drivers (IC Engine Powertrain):
- Established technology, readily available infrastructure and support.
- Currently offers higher payload capacities and longer operational ranges compared to hybrid options.
Reach Stacker Industry Product Innovations
Recent innovations in reach stackers focus on enhancing efficiency, safety, and environmental sustainability. Manufacturers are incorporating advanced features like improved operator comfort, enhanced visibility systems, and more sophisticated control systems. The adoption of telematics for remote monitoring and diagnostics is becoming increasingly common. Hybrid and electric powertrains are gaining traction, aligning with environmental regulations and reducing operational costs. Key selling propositions highlight fuel efficiency improvements, reduced emissions, and enhanced safety features, catering to the growing demand for sustainable and cost-effective solutions.
Propelling Factors for Reach Stacker Industry Growth
The reach stacker market's growth is propelled by several factors. Increased globalization and escalating global trade volumes necessitate efficient cargo handling solutions, driving demand. Technological advancements such as automation and hybrid powertrains improve operational efficiency and reduce environmental impact. Furthermore, investments in port infrastructure modernization and expansion across various regions significantly contribute to market expansion. Favorable government policies promoting sustainable transportation and logistics also stimulate industry growth.
Obstacles in the Reach Stacker Industry Market
Several factors hinder the reach stacker market's growth. Fluctuations in raw material prices and supply chain disruptions can increase manufacturing costs and affect profitability. Stringent emission regulations necessitate the adoption of cleaner technologies, requiring substantial investments. Intense competition amongst established manufacturers and emerging players creates price pressures, impacting profit margins. The high initial investment cost can be a barrier to entry for small and medium-sized businesses.
Future Opportunities in Reach Stacker Industry
Emerging opportunities lie in expanding into untapped markets, particularly in developing economies experiencing rapid infrastructural development. The increasing adoption of automation and autonomous operation systems offers significant potential for efficiency gains. Further development and adoption of hybrid and electric powertrains to reduce carbon emissions and improve sustainability are also expected to drive growth. Finally, developing innovative solutions for specialized applications, such as handling oversized or sensitive cargo, present new avenues for market expansion.
Major Players in the Reach Stacker Industry Ecosystem
- Konecranes
- Sany Group
- Hyster
- SMV Global
- Liebherr Group
- Toyota
- Kalmar Group
- CVS Ferrari S P A
- Terex
Key Developments in Reach Stacker Industry Industry
- 2022-Q4: Konecranes launched a new generation of reach stackers with enhanced automation capabilities.
- 2023-Q1: Sany Group acquired a smaller reach stacker manufacturer, expanding its market share.
- 2023-Q2: New emission regulations were implemented in several key markets, accelerating the adoption of hybrid and electric reach stackers.
- 2024-Q3: A major port authority invested heavily in automated reach stacker systems, showcasing a shift towards greater efficiency.
Strategic Reach Stacker Industry Market Forecast
The reach stacker market is poised for robust growth, driven by a confluence of factors, including sustained global trade, technological advancements, and increasing investments in port and logistics infrastructure. The adoption of cleaner technologies, coupled with ongoing automation efforts, will reshape the industry landscape and create significant opportunities for market expansion. The forecast period promises continued growth, exceeding $XX Billion by 2033, presenting substantial potential for industry stakeholders.
Reach Stacker Industry Segmentation
-
1. Application
- 1.1. Sea Ports
- 1.2. Industrial
-
2. Tonnage
- 2.1. Low
- 2.2. Medium
- 2.3. High
-
3. Power Train Type
- 3.1. IC Engine
- 3.2. Hybrid
Reach Stacker Industry Segmentation By Geography
- 1. United States
- 2. Canada
- 3. Rest of North America
- 4. Germany
- 5. United Kingdom
- 6. France
- 7. Italy
- 8. Rest of Europe
- 9. China
- 10. India
- 11. Japan
- 12. South Korea
- 13. Rest of Asia Pacific
- 14. Mexico
- 15. Brazil
- 16. United Arab Emirates
- 17. Other Countries
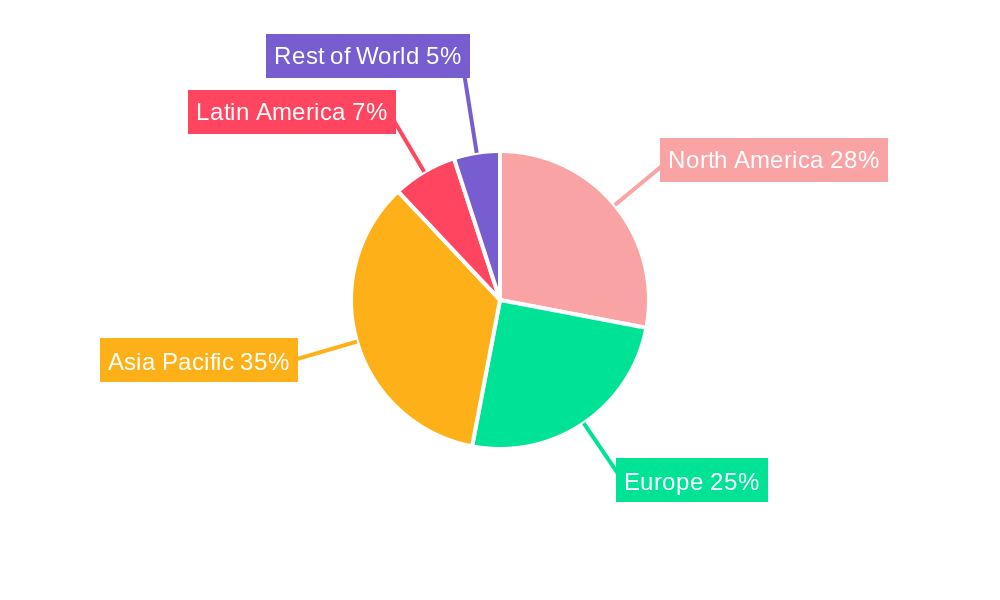
Reach Stacker Industry Regional Market Share
Geographic Coverage of Reach Stacker Industry
Reach Stacker Industry REPORT HIGHLIGHTS
| Aspects | Details |
|---|---|
| Study Period | 2020-2034 |
| Base Year | 2025 |
| Estimated Year | 2026 |
| Forecast Period | 2026-2034 |
| Historical Period | 2020-2025 |
| Growth Rate | CAGR of 6.9% from 2020-2034 |
| Segmentation |
|
Table of Contents
- 1. Introduction
- 1.1. Research Scope
- 1.2. Market Segmentation
- 1.3. Research Objective
- 1.4. Definitions and Assumptions
- 2. Executive Summary
- 2.1. Market Snapshot
- 3. Market Dynamics
- 3.1. Market Drivers
- 3.2. Market Restrains
- 3.3. Market Trends
- 3.4. Market Opportunities
- 4. Market Factor Analysis
- 4.1. Porters Five Forces
- 4.1.1. Bargaining Power of Suppliers
- 4.1.2. Bargaining Power of Buyers
- 4.1.3. Threat of New Entrants
- 4.1.4. Threat of Substitutes
- 4.1.5. Competitive Rivalry
- 4.2. PESTEL analysis
- 4.3. BCG Analysis
- 4.3.1. Stars (High Growth, High Market Share)
- 4.3.2. Cash Cows (Low Growth, High Market Share)
- 4.3.3. Question Mark (High Growth, Low Market Share)
- 4.3.4. Dogs (Low Growth, Low Market Share)
- 4.4. Ansoff Matrix Analysis
- 4.5. Supply Chain Analysis
- 4.6. Regulatory Landscape
- 4.7. Current Market Potential and Opportunity Assessment (TAM–SAM–SOM Framework)
- 4.8. DMV Analyst Note
- 4.1. Porters Five Forces
- 5. Market Analysis, Insights and Forecast 2021-2033
- 5.1. Market Analysis, Insights and Forecast - by Application
- 5.1.1. Sea Ports
- 5.1.2. Industrial
- 5.2. Market Analysis, Insights and Forecast - by Tonnage
- 5.2.1. Low
- 5.2.2. Medium
- 5.2.3. High
- 5.3. Market Analysis, Insights and Forecast - by Power Train Type
- 5.3.1. IC Engine
- 5.3.2. Hybrid
- 5.4. Market Analysis, Insights and Forecast - by Region
- 5.4.1. United States
- 5.4.2. Canada
- 5.4.3. Rest of North America
- 5.4.4. Germany
- 5.4.5. United Kingdom
- 5.4.6. France
- 5.4.7. Italy
- 5.4.8. Rest of Europe
- 5.4.9. China
- 5.4.10. India
- 5.4.11. Japan
- 5.4.12. South Korea
- 5.4.13. Rest of Asia Pacific
- 5.4.14. Mexico
- 5.4.15. Brazil
- 5.4.16. United Arab Emirates
- 5.4.17. Other Countries
- 5.1. Market Analysis, Insights and Forecast - by Application
- 6. Global Reach Stacker Industry Analysis, Insights and Forecast, 2021-2033
- 6.1. Market Analysis, Insights and Forecast - by Application
- 6.1.1. Sea Ports
- 6.1.2. Industrial
- 6.2. Market Analysis, Insights and Forecast - by Tonnage
- 6.2.1. Low
- 6.2.2. Medium
- 6.2.3. High
- 6.3. Market Analysis, Insights and Forecast - by Power Train Type
- 6.3.1. IC Engine
- 6.3.2. Hybrid
- 6.1. Market Analysis, Insights and Forecast - by Application
- 7. United States Reach Stacker Industry Analysis, Insights and Forecast, 2020-2032
- 7.1. Market Analysis, Insights and Forecast - by Application
- 7.1.1. Sea Ports
- 7.1.2. Industrial
- 7.2. Market Analysis, Insights and Forecast - by Tonnage
- 7.2.1. Low
- 7.2.2. Medium
- 7.2.3. High
- 7.3. Market Analysis, Insights and Forecast - by Power Train Type
- 7.3.1. IC Engine
- 7.3.2. Hybrid
- 7.1. Market Analysis, Insights and Forecast - by Application
- 8. Canada Reach Stacker Industry Analysis, Insights and Forecast, 2020-2032
- 8.1. Market Analysis, Insights and Forecast - by Application
- 8.1.1. Sea Ports
- 8.1.2. Industrial
- 8.2. Market Analysis, Insights and Forecast - by Tonnage
- 8.2.1. Low
- 8.2.2. Medium
- 8.2.3. High
- 8.3. Market Analysis, Insights and Forecast - by Power Train Type
- 8.3.1. IC Engine
- 8.3.2. Hybrid
- 8.1. Market Analysis, Insights and Forecast - by Application
- 9. Rest of North America Reach Stacker Industry Analysis, Insights and Forecast, 2020-2032
- 9.1. Market Analysis, Insights and Forecast - by Application
- 9.1.1. Sea Ports
- 9.1.2. Industrial
- 9.2. Market Analysis, Insights and Forecast - by Tonnage
- 9.2.1. Low
- 9.2.2. Medium
- 9.2.3. High
- 9.3. Market Analysis, Insights and Forecast - by Power Train Type
- 9.3.1. IC Engine
- 9.3.2. Hybrid
- 9.1. Market Analysis, Insights and Forecast - by Application
- 10. Germany Reach Stacker Industry Analysis, Insights and Forecast, 2020-2032
- 10.1. Market Analysis, Insights and Forecast - by Application
- 10.1.1. Sea Ports
- 10.1.2. Industrial
- 10.2. Market Analysis, Insights and Forecast - by Tonnage
- 10.2.1. Low
- 10.2.2. Medium
- 10.2.3. High
- 10.3. Market Analysis, Insights and Forecast - by Power Train Type
- 10.3.1. IC Engine
- 10.3.2. Hybrid
- 10.1. Market Analysis, Insights and Forecast - by Application
- 11. United Kingdom Reach Stacker Industry Analysis, Insights and Forecast, 2020-2032
- 11.1. Market Analysis, Insights and Forecast - by Application
- 11.1.1. Sea Ports
- 11.1.2. Industrial
- 11.2. Market Analysis, Insights and Forecast - by Tonnage
- 11.2.1. Low
- 11.2.2. Medium
- 11.2.3. High
- 11.3. Market Analysis, Insights and Forecast - by Power Train Type
- 11.3.1. IC Engine
- 11.3.2. Hybrid
- 11.1. Market Analysis, Insights and Forecast - by Application
- 12. France Reach Stacker Industry Analysis, Insights and Forecast, 2020-2032
- 12.1. Market Analysis, Insights and Forecast - by Application
- 12.1.1. Sea Ports
- 12.1.2. Industrial
- 12.2. Market Analysis, Insights and Forecast - by Tonnage
- 12.2.1. Low
- 12.2.2. Medium
- 12.2.3. High
- 12.3. Market Analysis, Insights and Forecast - by Power Train Type
- 12.3.1. IC Engine
- 12.3.2. Hybrid
- 12.1. Market Analysis, Insights and Forecast - by Application
- 13. Italy Reach Stacker Industry Analysis, Insights and Forecast, 2020-2032
- 13.1. Market Analysis, Insights and Forecast - by Application
- 13.1.1. Sea Ports
- 13.1.2. Industrial
- 13.2. Market Analysis, Insights and Forecast - by Tonnage
- 13.2.1. Low
- 13.2.2. Medium
- 13.2.3. High
- 13.3. Market Analysis, Insights and Forecast - by Power Train Type
- 13.3.1. IC Engine
- 13.3.2. Hybrid
- 13.1. Market Analysis, Insights and Forecast - by Application
- 14. Rest of Europe Reach Stacker Industry Analysis, Insights and Forecast, 2020-2032
- 14.1. Market Analysis, Insights and Forecast - by Application
- 14.1.1. Sea Ports
- 14.1.2. Industrial
- 14.2. Market Analysis, Insights and Forecast - by Tonnage
- 14.2.1. Low
- 14.2.2. Medium
- 14.2.3. High
- 14.3. Market Analysis, Insights and Forecast - by Power Train Type
- 14.3.1. IC Engine
- 14.3.2. Hybrid
- 14.1. Market Analysis, Insights and Forecast - by Application
- 15. China Reach Stacker Industry Analysis, Insights and Forecast, 2020-2032
- 15.1. Market Analysis, Insights and Forecast - by Application
- 15.1.1. Sea Ports
- 15.1.2. Industrial
- 15.2. Market Analysis, Insights and Forecast - by Tonnage
- 15.2.1. Low
- 15.2.2. Medium
- 15.2.3. High
- 15.3. Market Analysis, Insights and Forecast - by Power Train Type
- 15.3.1. IC Engine
- 15.3.2. Hybrid
- 15.1. Market Analysis, Insights and Forecast - by Application
- 16. India Reach Stacker Industry Analysis, Insights and Forecast, 2020-2032
- 16.1. Market Analysis, Insights and Forecast - by Application
- 16.1.1. Sea Ports
- 16.1.2. Industrial
- 16.2. Market Analysis, Insights and Forecast - by Tonnage
- 16.2.1. Low
- 16.2.2. Medium
- 16.2.3. High
- 16.3. Market Analysis, Insights and Forecast - by Power Train Type
- 16.3.1. IC Engine
- 16.3.2. Hybrid
- 16.1. Market Analysis, Insights and Forecast - by Application
- 17. Japan Reach Stacker Industry Analysis, Insights and Forecast, 2020-2032
- 17.1. Market Analysis, Insights and Forecast - by Application
- 17.1.1. Sea Ports
- 17.1.2. Industrial
- 17.2. Market Analysis, Insights and Forecast - by Tonnage
- 17.2.1. Low
- 17.2.2. Medium
- 17.2.3. High
- 17.3. Market Analysis, Insights and Forecast - by Power Train Type
- 17.3.1. IC Engine
- 17.3.2. Hybrid
- 17.1. Market Analysis, Insights and Forecast - by Application
- 18. South Korea Reach Stacker Industry Analysis, Insights and Forecast, 2020-2032
- 18.1. Market Analysis, Insights and Forecast - by Application
- 18.1.1. Sea Ports
- 18.1.2. Industrial
- 18.2. Market Analysis, Insights and Forecast - by Tonnage
- 18.2.1. Low
- 18.2.2. Medium
- 18.2.3. High
- 18.3. Market Analysis, Insights and Forecast - by Power Train Type
- 18.3.1. IC Engine
- 18.3.2. Hybrid
- 18.1. Market Analysis, Insights and Forecast - by Application
- 19. Rest of Asia Pacific Reach Stacker Industry Analysis, Insights and Forecast, 2020-2032
- 19.1. Market Analysis, Insights and Forecast - by Application
- 19.1.1. Sea Ports
- 19.1.2. Industrial
- 19.2. Market Analysis, Insights and Forecast - by Tonnage
- 19.2.1. Low
- 19.2.2. Medium
- 19.2.3. High
- 19.3. Market Analysis, Insights and Forecast - by Power Train Type
- 19.3.1. IC Engine
- 19.3.2. Hybrid
- 19.1. Market Analysis, Insights and Forecast - by Application
- 20. Mexico Reach Stacker Industry Analysis, Insights and Forecast, 2020-2032
- 20.1. Market Analysis, Insights and Forecast - by Application
- 20.1.1. Sea Ports
- 20.1.2. Industrial
- 20.2. Market Analysis, Insights and Forecast - by Tonnage
- 20.2.1. Low
- 20.2.2. Medium
- 20.2.3. High
- 20.3. Market Analysis, Insights and Forecast - by Power Train Type
- 20.3.1. IC Engine
- 20.3.2. Hybrid
- 20.1. Market Analysis, Insights and Forecast - by Application
- 21. Brazil Reach Stacker Industry Analysis, Insights and Forecast, 2020-2032
- 21.1. Market Analysis, Insights and Forecast - by Application
- 21.1.1. Sea Ports
- 21.1.2. Industrial
- 21.2. Market Analysis, Insights and Forecast - by Tonnage
- 21.2.1. Low
- 21.2.2. Medium
- 21.2.3. High
- 21.3. Market Analysis, Insights and Forecast - by Power Train Type
- 21.3.1. IC Engine
- 21.3.2. Hybrid
- 21.1. Market Analysis, Insights and Forecast - by Application
- 22. United Arab Emirates Reach Stacker Industry Analysis, Insights and Forecast, 2020-2032
- 22.1. Market Analysis, Insights and Forecast - by Application
- 22.1.1. Sea Ports
- 22.1.2. Industrial
- 22.2. Market Analysis, Insights and Forecast - by Tonnage
- 22.2.1. Low
- 22.2.2. Medium
- 22.2.3. High
- 22.3. Market Analysis, Insights and Forecast - by Power Train Type
- 22.3.1. IC Engine
- 22.3.2. Hybrid
- 22.1. Market Analysis, Insights and Forecast - by Application
- 23. Other Countries Reach Stacker Industry Analysis, Insights and Forecast, 2020-2032
- 23.1. Market Analysis, Insights and Forecast - by Application
- 23.1.1. Sea Ports
- 23.1.2. Industrial
- 23.2. Market Analysis, Insights and Forecast - by Tonnage
- 23.2.1. Low
- 23.2.2. Medium
- 23.2.3. High
- 23.3. Market Analysis, Insights and Forecast - by Power Train Type
- 23.3.1. IC Engine
- 23.3.2. Hybrid
- 23.1. Market Analysis, Insights and Forecast - by Application
- 24. Competitive Analysis
- 24.1. Company Profiles
- 24.1.1 Konecranes
- 24.1.1.1. Company Overview
- 24.1.1.2. Products
- 24.1.1.3. Company Financials
- 24.1.1.4. SWOT Analysis
- 24.1.2 Sany Group
- 24.1.2.1. Company Overview
- 24.1.2.2. Products
- 24.1.2.3. Company Financials
- 24.1.2.4. SWOT Analysis
- 24.1.3 Hyster
- 24.1.3.1. Company Overview
- 24.1.3.2. Products
- 24.1.3.3. Company Financials
- 24.1.3.4. SWOT Analysis
- 24.1.4 SMV Global
- 24.1.4.1. Company Overview
- 24.1.4.2. Products
- 24.1.4.3. Company Financials
- 24.1.4.4. SWOT Analysis
- 24.1.5 Liebherr Group
- 24.1.5.1. Company Overview
- 24.1.5.2. Products
- 24.1.5.3. Company Financials
- 24.1.5.4. SWOT Analysis
- 24.1.6 Toyota*List Not Exhaustive
- 24.1.6.1. Company Overview
- 24.1.6.2. Products
- 24.1.6.3. Company Financials
- 24.1.6.4. SWOT Analysis
- 24.1.7 Kalmar Group
- 24.1.7.1. Company Overview
- 24.1.7.2. Products
- 24.1.7.3. Company Financials
- 24.1.7.4. SWOT Analysis
- 24.1.8 CVS Ferrari S P A
- 24.1.8.1. Company Overview
- 24.1.8.2. Products
- 24.1.8.3. Company Financials
- 24.1.8.4. SWOT Analysis
- 24.1.9 Terex
- 24.1.9.1. Company Overview
- 24.1.9.2. Products
- 24.1.9.3. Company Financials
- 24.1.9.4. SWOT Analysis
- 24.1.1 Konecranes
- 24.2. Market Entropy
- 24.2.1 Company's Key Areas Served
- 24.2.2 Recent Developments
- 24.3. Company Market Share Analysis 2025
- 24.3.1 Top 5 Companies Market Share Analysis
- 24.3.2 Top 3 Companies Market Share Analysis
- 24.4. List of Potential Customers
- 25. Research Methodology
List of Figures
- Figure 1: Global Reach Stacker Industry Revenue Breakdown (billion, %) by Region 2025 & 2033
- Figure 2: United States Reach Stacker Industry Revenue (billion), by Application 2025 & 2033
- Figure 3: United States Reach Stacker Industry Revenue Share (%), by Application 2025 & 2033
- Figure 4: United States Reach Stacker Industry Revenue (billion), by Tonnage 2025 & 2033
- Figure 5: United States Reach Stacker Industry Revenue Share (%), by Tonnage 2025 & 2033
- Figure 6: United States Reach Stacker Industry Revenue (billion), by Power Train Type 2025 & 2033
- Figure 7: United States Reach Stacker Industry Revenue Share (%), by Power Train Type 2025 & 2033
- Figure 8: United States Reach Stacker Industry Revenue (billion), by Country 2025 & 2033
- Figure 9: United States Reach Stacker Industry Revenue Share (%), by Country 2025 & 2033
- Figure 10: Canada Reach Stacker Industry Revenue (billion), by Application 2025 & 2033
- Figure 11: Canada Reach Stacker Industry Revenue Share (%), by Application 2025 & 2033
- Figure 12: Canada Reach Stacker Industry Revenue (billion), by Tonnage 2025 & 2033
- Figure 13: Canada Reach Stacker Industry Revenue Share (%), by Tonnage 2025 & 2033
- Figure 14: Canada Reach Stacker Industry Revenue (billion), by Power Train Type 2025 & 2033
- Figure 15: Canada Reach Stacker Industry Revenue Share (%), by Power Train Type 2025 & 2033
- Figure 16: Canada Reach Stacker Industry Revenue (billion), by Country 2025 & 2033
- Figure 17: Canada Reach Stacker Industry Revenue Share (%), by Country 2025 & 2033
- Figure 18: Rest of North America Reach Stacker Industry Revenue (billion), by Application 2025 & 2033
- Figure 19: Rest of North America Reach Stacker Industry Revenue Share (%), by Application 2025 & 2033
- Figure 20: Rest of North America Reach Stacker Industry Revenue (billion), by Tonnage 2025 & 2033
- Figure 21: Rest of North America Reach Stacker Industry Revenue Share (%), by Tonnage 2025 & 2033
- Figure 22: Rest of North America Reach Stacker Industry Revenue (billion), by Power Train Type 2025 & 2033
- Figure 23: Rest of North America Reach Stacker Industry Revenue Share (%), by Power Train Type 2025 & 2033
- Figure 24: Rest of North America Reach Stacker Industry Revenue (billion), by Country 2025 & 2033
- Figure 25: Rest of North America Reach Stacker Industry Revenue Share (%), by Country 2025 & 2033
- Figure 26: Germany Reach Stacker Industry Revenue (billion), by Application 2025 & 2033
- Figure 27: Germany Reach Stacker Industry Revenue Share (%), by Application 2025 & 2033
- Figure 28: Germany Reach Stacker Industry Revenue (billion), by Tonnage 2025 & 2033
- Figure 29: Germany Reach Stacker Industry Revenue Share (%), by Tonnage 2025 & 2033
- Figure 30: Germany Reach Stacker Industry Revenue (billion), by Power Train Type 2025 & 2033
- Figure 31: Germany Reach Stacker Industry Revenue Share (%), by Power Train Type 2025 & 2033
- Figure 32: Germany Reach Stacker Industry Revenue (billion), by Country 2025 & 2033
- Figure 33: Germany Reach Stacker Industry Revenue Share (%), by Country 2025 & 2033
- Figure 34: United Kingdom Reach Stacker Industry Revenue (billion), by Application 2025 & 2033
- Figure 35: United Kingdom Reach Stacker Industry Revenue Share (%), by Application 2025 & 2033
- Figure 36: United Kingdom Reach Stacker Industry Revenue (billion), by Tonnage 2025 & 2033
- Figure 37: United Kingdom Reach Stacker Industry Revenue Share (%), by Tonnage 2025 & 2033
- Figure 38: United Kingdom Reach Stacker Industry Revenue (billion), by Power Train Type 2025 & 2033
- Figure 39: United Kingdom Reach Stacker Industry Revenue Share (%), by Power Train Type 2025 & 2033
- Figure 40: United Kingdom Reach Stacker Industry Revenue (billion), by Country 2025 & 2033
- Figure 41: United Kingdom Reach Stacker Industry Revenue Share (%), by Country 2025 & 2033
- Figure 42: France Reach Stacker Industry Revenue (billion), by Application 2025 & 2033
- Figure 43: France Reach Stacker Industry Revenue Share (%), by Application 2025 & 2033
- Figure 44: France Reach Stacker Industry Revenue (billion), by Tonnage 2025 & 2033
- Figure 45: France Reach Stacker Industry Revenue Share (%), by Tonnage 2025 & 2033
- Figure 46: France Reach Stacker Industry Revenue (billion), by Power Train Type 2025 & 2033
- Figure 47: France Reach Stacker Industry Revenue Share (%), by Power Train Type 2025 & 2033
- Figure 48: France Reach Stacker Industry Revenue (billion), by Country 2025 & 2033
- Figure 49: France Reach Stacker Industry Revenue Share (%), by Country 2025 & 2033
- Figure 50: Italy Reach Stacker Industry Revenue (billion), by Application 2025 & 2033
- Figure 51: Italy Reach Stacker Industry Revenue Share (%), by Application 2025 & 2033
- Figure 52: Italy Reach Stacker Industry Revenue (billion), by Tonnage 2025 & 2033
- Figure 53: Italy Reach Stacker Industry Revenue Share (%), by Tonnage 2025 & 2033
- Figure 54: Italy Reach Stacker Industry Revenue (billion), by Power Train Type 2025 & 2033
- Figure 55: Italy Reach Stacker Industry Revenue Share (%), by Power Train Type 2025 & 2033
- Figure 56: Italy Reach Stacker Industry Revenue (billion), by Country 2025 & 2033
- Figure 57: Italy Reach Stacker Industry Revenue Share (%), by Country 2025 & 2033
- Figure 58: Rest of Europe Reach Stacker Industry Revenue (billion), by Application 2025 & 2033
- Figure 59: Rest of Europe Reach Stacker Industry Revenue Share (%), by Application 2025 & 2033
- Figure 60: Rest of Europe Reach Stacker Industry Revenue (billion), by Tonnage 2025 & 2033
- Figure 61: Rest of Europe Reach Stacker Industry Revenue Share (%), by Tonnage 2025 & 2033
- Figure 62: Rest of Europe Reach Stacker Industry Revenue (billion), by Power Train Type 2025 & 2033
- Figure 63: Rest of Europe Reach Stacker Industry Revenue Share (%), by Power Train Type 2025 & 2033
- Figure 64: Rest of Europe Reach Stacker Industry Revenue (billion), by Country 2025 & 2033
- Figure 65: Rest of Europe Reach Stacker Industry Revenue Share (%), by Country 2025 & 2033
- Figure 66: China Reach Stacker Industry Revenue (billion), by Application 2025 & 2033
- Figure 67: China Reach Stacker Industry Revenue Share (%), by Application 2025 & 2033
- Figure 68: China Reach Stacker Industry Revenue (billion), by Tonnage 2025 & 2033
- Figure 69: China Reach Stacker Industry Revenue Share (%), by Tonnage 2025 & 2033
- Figure 70: China Reach Stacker Industry Revenue (billion), by Power Train Type 2025 & 2033
- Figure 71: China Reach Stacker Industry Revenue Share (%), by Power Train Type 2025 & 2033
- Figure 72: China Reach Stacker Industry Revenue (billion), by Country 2025 & 2033
- Figure 73: China Reach Stacker Industry Revenue Share (%), by Country 2025 & 2033
- Figure 74: India Reach Stacker Industry Revenue (billion), by Application 2025 & 2033
- Figure 75: India Reach Stacker Industry Revenue Share (%), by Application 2025 & 2033
- Figure 76: India Reach Stacker Industry Revenue (billion), by Tonnage 2025 & 2033
- Figure 77: India Reach Stacker Industry Revenue Share (%), by Tonnage 2025 & 2033
- Figure 78: India Reach Stacker Industry Revenue (billion), by Power Train Type 2025 & 2033
- Figure 79: India Reach Stacker Industry Revenue Share (%), by Power Train Type 2025 & 2033
- Figure 80: India Reach Stacker Industry Revenue (billion), by Country 2025 & 2033
- Figure 81: India Reach Stacker Industry Revenue Share (%), by Country 2025 & 2033
- Figure 82: Japan Reach Stacker Industry Revenue (billion), by Application 2025 & 2033
- Figure 83: Japan Reach Stacker Industry Revenue Share (%), by Application 2025 & 2033
- Figure 84: Japan Reach Stacker Industry Revenue (billion), by Tonnage 2025 & 2033
- Figure 85: Japan Reach Stacker Industry Revenue Share (%), by Tonnage 2025 & 2033
- Figure 86: Japan Reach Stacker Industry Revenue (billion), by Power Train Type 2025 & 2033
- Figure 87: Japan Reach Stacker Industry Revenue Share (%), by Power Train Type 2025 & 2033
- Figure 88: Japan Reach Stacker Industry Revenue (billion), by Country 2025 & 2033
- Figure 89: Japan Reach Stacker Industry Revenue Share (%), by Country 2025 & 2033
- Figure 90: South Korea Reach Stacker Industry Revenue (billion), by Application 2025 & 2033
- Figure 91: South Korea Reach Stacker Industry Revenue Share (%), by Application 2025 & 2033
- Figure 92: South Korea Reach Stacker Industry Revenue (billion), by Tonnage 2025 & 2033
- Figure 93: South Korea Reach Stacker Industry Revenue Share (%), by Tonnage 2025 & 2033
- Figure 94: South Korea Reach Stacker Industry Revenue (billion), by Power Train Type 2025 & 2033
- Figure 95: South Korea Reach Stacker Industry Revenue Share (%), by Power Train Type 2025 & 2033
- Figure 96: South Korea Reach Stacker Industry Revenue (billion), by Country 2025 & 2033
- Figure 97: South Korea Reach Stacker Industry Revenue Share (%), by Country 2025 & 2033
- Figure 98: Rest of Asia Pacific Reach Stacker Industry Revenue (billion), by Application 2025 & 2033
- Figure 99: Rest of Asia Pacific Reach Stacker Industry Revenue Share (%), by Application 2025 & 2033
- Figure 100: Rest of Asia Pacific Reach Stacker Industry Revenue (billion), by Tonnage 2025 & 2033
- Figure 101: Rest of Asia Pacific Reach Stacker Industry Revenue Share (%), by Tonnage 2025 & 2033
- Figure 102: Rest of Asia Pacific Reach Stacker Industry Revenue (billion), by Power Train Type 2025 & 2033
- Figure 103: Rest of Asia Pacific Reach Stacker Industry Revenue Share (%), by Power Train Type 2025 & 2033
- Figure 104: Rest of Asia Pacific Reach Stacker Industry Revenue (billion), by Country 2025 & 2033
- Figure 105: Rest of Asia Pacific Reach Stacker Industry Revenue Share (%), by Country 2025 & 2033
- Figure 106: Mexico Reach Stacker Industry Revenue (billion), by Application 2025 & 2033
- Figure 107: Mexico Reach Stacker Industry Revenue Share (%), by Application 2025 & 2033
- Figure 108: Mexico Reach Stacker Industry Revenue (billion), by Tonnage 2025 & 2033
- Figure 109: Mexico Reach Stacker Industry Revenue Share (%), by Tonnage 2025 & 2033
- Figure 110: Mexico Reach Stacker Industry Revenue (billion), by Power Train Type 2025 & 2033
- Figure 111: Mexico Reach Stacker Industry Revenue Share (%), by Power Train Type 2025 & 2033
- Figure 112: Mexico Reach Stacker Industry Revenue (billion), by Country 2025 & 2033
- Figure 113: Mexico Reach Stacker Industry Revenue Share (%), by Country 2025 & 2033
- Figure 114: Brazil Reach Stacker Industry Revenue (billion), by Application 2025 & 2033
- Figure 115: Brazil Reach Stacker Industry Revenue Share (%), by Application 2025 & 2033
- Figure 116: Brazil Reach Stacker Industry Revenue (billion), by Tonnage 2025 & 2033
- Figure 117: Brazil Reach Stacker Industry Revenue Share (%), by Tonnage 2025 & 2033
- Figure 118: Brazil Reach Stacker Industry Revenue (billion), by Power Train Type 2025 & 2033
- Figure 119: Brazil Reach Stacker Industry Revenue Share (%), by Power Train Type 2025 & 2033
- Figure 120: Brazil Reach Stacker Industry Revenue (billion), by Country 2025 & 2033
- Figure 121: Brazil Reach Stacker Industry Revenue Share (%), by Country 2025 & 2033
- Figure 122: United Arab Emirates Reach Stacker Industry Revenue (billion), by Application 2025 & 2033
- Figure 123: United Arab Emirates Reach Stacker Industry Revenue Share (%), by Application 2025 & 2033
- Figure 124: United Arab Emirates Reach Stacker Industry Revenue (billion), by Tonnage 2025 & 2033
- Figure 125: United Arab Emirates Reach Stacker Industry Revenue Share (%), by Tonnage 2025 & 2033
- Figure 126: United Arab Emirates Reach Stacker Industry Revenue (billion), by Power Train Type 2025 & 2033
- Figure 127: United Arab Emirates Reach Stacker Industry Revenue Share (%), by Power Train Type 2025 & 2033
- Figure 128: United Arab Emirates Reach Stacker Industry Revenue (billion), by Country 2025 & 2033
- Figure 129: United Arab Emirates Reach Stacker Industry Revenue Share (%), by Country 2025 & 2033
- Figure 130: Other Countries Reach Stacker Industry Revenue (billion), by Application 2025 & 2033
- Figure 131: Other Countries Reach Stacker Industry Revenue Share (%), by Application 2025 & 2033
- Figure 132: Other Countries Reach Stacker Industry Revenue (billion), by Tonnage 2025 & 2033
- Figure 133: Other Countries Reach Stacker Industry Revenue Share (%), by Tonnage 2025 & 2033
- Figure 134: Other Countries Reach Stacker Industry Revenue (billion), by Power Train Type 2025 & 2033
- Figure 135: Other Countries Reach Stacker Industry Revenue Share (%), by Power Train Type 2025 & 2033
- Figure 136: Other Countries Reach Stacker Industry Revenue (billion), by Country 2025 & 2033
- Figure 137: Other Countries Reach Stacker Industry Revenue Share (%), by Country 2025 & 2033
List of Tables
- Table 1: Global Reach Stacker Industry Revenue billion Forecast, by Application 2020 & 2033
- Table 2: Global Reach Stacker Industry Revenue billion Forecast, by Tonnage 2020 & 2033
- Table 3: Global Reach Stacker Industry Revenue billion Forecast, by Power Train Type 2020 & 2033
- Table 4: Global Reach Stacker Industry Revenue billion Forecast, by Region 2020 & 2033
- Table 5: Global Reach Stacker Industry Revenue billion Forecast, by Application 2020 & 2033
- Table 6: Global Reach Stacker Industry Revenue billion Forecast, by Tonnage 2020 & 2033
- Table 7: Global Reach Stacker Industry Revenue billion Forecast, by Power Train Type 2020 & 2033
- Table 8: Global Reach Stacker Industry Revenue billion Forecast, by Country 2020 & 2033
- Table 9: Global Reach Stacker Industry Revenue billion Forecast, by Application 2020 & 2033
- Table 10: Global Reach Stacker Industry Revenue billion Forecast, by Tonnage 2020 & 2033
- Table 11: Global Reach Stacker Industry Revenue billion Forecast, by Power Train Type 2020 & 2033
- Table 12: Global Reach Stacker Industry Revenue billion Forecast, by Country 2020 & 2033
- Table 13: Global Reach Stacker Industry Revenue billion Forecast, by Application 2020 & 2033
- Table 14: Global Reach Stacker Industry Revenue billion Forecast, by Tonnage 2020 & 2033
- Table 15: Global Reach Stacker Industry Revenue billion Forecast, by Power Train Type 2020 & 2033
- Table 16: Global Reach Stacker Industry Revenue billion Forecast, by Country 2020 & 2033
- Table 17: Global Reach Stacker Industry Revenue billion Forecast, by Application 2020 & 2033
- Table 18: Global Reach Stacker Industry Revenue billion Forecast, by Tonnage 2020 & 2033
- Table 19: Global Reach Stacker Industry Revenue billion Forecast, by Power Train Type 2020 & 2033
- Table 20: Global Reach Stacker Industry Revenue billion Forecast, by Country 2020 & 2033
- Table 21: Global Reach Stacker Industry Revenue billion Forecast, by Application 2020 & 2033
- Table 22: Global Reach Stacker Industry Revenue billion Forecast, by Tonnage 2020 & 2033
- Table 23: Global Reach Stacker Industry Revenue billion Forecast, by Power Train Type 2020 & 2033
- Table 24: Global Reach Stacker Industry Revenue billion Forecast, by Country 2020 & 2033
- Table 25: Global Reach Stacker Industry Revenue billion Forecast, by Application 2020 & 2033
- Table 26: Global Reach Stacker Industry Revenue billion Forecast, by Tonnage 2020 & 2033
- Table 27: Global Reach Stacker Industry Revenue billion Forecast, by Power Train Type 2020 & 2033
- Table 28: Global Reach Stacker Industry Revenue billion Forecast, by Country 2020 & 2033
- Table 29: Global Reach Stacker Industry Revenue billion Forecast, by Application 2020 & 2033
- Table 30: Global Reach Stacker Industry Revenue billion Forecast, by Tonnage 2020 & 2033
- Table 31: Global Reach Stacker Industry Revenue billion Forecast, by Power Train Type 2020 & 2033
- Table 32: Global Reach Stacker Industry Revenue billion Forecast, by Country 2020 & 2033
- Table 33: Global Reach Stacker Industry Revenue billion Forecast, by Application 2020 & 2033
- Table 34: Global Reach Stacker Industry Revenue billion Forecast, by Tonnage 2020 & 2033
- Table 35: Global Reach Stacker Industry Revenue billion Forecast, by Power Train Type 2020 & 2033
- Table 36: Global Reach Stacker Industry Revenue billion Forecast, by Country 2020 & 2033
- Table 37: Global Reach Stacker Industry Revenue billion Forecast, by Application 2020 & 2033
- Table 38: Global Reach Stacker Industry Revenue billion Forecast, by Tonnage 2020 & 2033
- Table 39: Global Reach Stacker Industry Revenue billion Forecast, by Power Train Type 2020 & 2033
- Table 40: Global Reach Stacker Industry Revenue billion Forecast, by Country 2020 & 2033
- Table 41: Global Reach Stacker Industry Revenue billion Forecast, by Application 2020 & 2033
- Table 42: Global Reach Stacker Industry Revenue billion Forecast, by Tonnage 2020 & 2033
- Table 43: Global Reach Stacker Industry Revenue billion Forecast, by Power Train Type 2020 & 2033
- Table 44: Global Reach Stacker Industry Revenue billion Forecast, by Country 2020 & 2033
- Table 45: Global Reach Stacker Industry Revenue billion Forecast, by Application 2020 & 2033
- Table 46: Global Reach Stacker Industry Revenue billion Forecast, by Tonnage 2020 & 2033
- Table 47: Global Reach Stacker Industry Revenue billion Forecast, by Power Train Type 2020 & 2033
- Table 48: Global Reach Stacker Industry Revenue billion Forecast, by Country 2020 & 2033
- Table 49: Global Reach Stacker Industry Revenue billion Forecast, by Application 2020 & 2033
- Table 50: Global Reach Stacker Industry Revenue billion Forecast, by Tonnage 2020 & 2033
- Table 51: Global Reach Stacker Industry Revenue billion Forecast, by Power Train Type 2020 & 2033
- Table 52: Global Reach Stacker Industry Revenue billion Forecast, by Country 2020 & 2033
- Table 53: Global Reach Stacker Industry Revenue billion Forecast, by Application 2020 & 2033
- Table 54: Global Reach Stacker Industry Revenue billion Forecast, by Tonnage 2020 & 2033
- Table 55: Global Reach Stacker Industry Revenue billion Forecast, by Power Train Type 2020 & 2033
- Table 56: Global Reach Stacker Industry Revenue billion Forecast, by Country 2020 & 2033
- Table 57: Global Reach Stacker Industry Revenue billion Forecast, by Application 2020 & 2033
- Table 58: Global Reach Stacker Industry Revenue billion Forecast, by Tonnage 2020 & 2033
- Table 59: Global Reach Stacker Industry Revenue billion Forecast, by Power Train Type 2020 & 2033
- Table 60: Global Reach Stacker Industry Revenue billion Forecast, by Country 2020 & 2033
- Table 61: Global Reach Stacker Industry Revenue billion Forecast, by Application 2020 & 2033
- Table 62: Global Reach Stacker Industry Revenue billion Forecast, by Tonnage 2020 & 2033
- Table 63: Global Reach Stacker Industry Revenue billion Forecast, by Power Train Type 2020 & 2033
- Table 64: Global Reach Stacker Industry Revenue billion Forecast, by Country 2020 & 2033
- Table 65: Global Reach Stacker Industry Revenue billion Forecast, by Application 2020 & 2033
- Table 66: Global Reach Stacker Industry Revenue billion Forecast, by Tonnage 2020 & 2033
- Table 67: Global Reach Stacker Industry Revenue billion Forecast, by Power Train Type 2020 & 2033
- Table 68: Global Reach Stacker Industry Revenue billion Forecast, by Country 2020 & 2033
- Table 69: Global Reach Stacker Industry Revenue billion Forecast, by Application 2020 & 2033
- Table 70: Global Reach Stacker Industry Revenue billion Forecast, by Tonnage 2020 & 2033
- Table 71: Global Reach Stacker Industry Revenue billion Forecast, by Power Train Type 2020 & 2033
- Table 72: Global Reach Stacker Industry Revenue billion Forecast, by Country 2020 & 2033
Frequently Asked Questions
1. What is the projected Compound Annual Growth Rate (CAGR) of the Reach Stacker Industry?
The projected CAGR is approximately 6.9%.
2. Which companies are prominent players in the Reach Stacker Industry?
Key companies in the market include Konecranes, Sany Group, Hyster, SMV Global, Liebherr Group, Toyota*List Not Exhaustive, Kalmar Group, CVS Ferrari S P A, Terex.
3. What are the main segments of the Reach Stacker Industry?
The market segments include Application, Tonnage, Power Train Type.
4. Can you provide details about the market size?
The market size is estimated to be USD 3.2 billion as of 2022.
5. What are some drivers contributing to market growth?
Diverse Selection Among Car Models is Anticipated to Drive the Market Growth.
6. What are the notable trends driving market growth?
Electric Reach Stacker to Gain Momentum.
7. Are there any restraints impacting market growth?
Counterfeit and Illegally Imported Vehicles are Restraining the Market Growth.
8. Can you provide examples of recent developments in the market?
N/A
9. What pricing options are available for accessing the report?
Pricing options include single-user, multi-user, and enterprise licenses priced at USD 4750, USD 5250, and USD 8750 respectively.
10. Is the market size provided in terms of value or volume?
The market size is provided in terms of value, measured in billion.
11. Are there any specific market keywords associated with the report?
Yes, the market keyword associated with the report is "Reach Stacker Industry," which aids in identifying and referencing the specific market segment covered.
12. How do I determine which pricing option suits my needs best?
The pricing options vary based on user requirements and access needs. Individual users may opt for single-user licenses, while businesses requiring broader access may choose multi-user or enterprise licenses for cost-effective access to the report.
13. Are there any additional resources or data provided in the Reach Stacker Industry report?
While the report offers comprehensive insights, it's advisable to review the specific contents or supplementary materials provided to ascertain if additional resources or data are available.
14. How can I stay updated on further developments or reports in the Reach Stacker Industry?
To stay informed about further developments, trends, and reports in the Reach Stacker Industry, consider subscribing to industry newsletters, following relevant companies and organizations, or regularly checking reputable industry news sources and publications.
Methodology
Step 1 - Identification of Relevant Samples Size from Population Database


Step 2 - Approaches for Defining Global Market Size (Value, Volume* & Price*)

Note*: In applicable scenarios
Step 3 - Data Sources
Primary Research
- Web Analytics
- Survey Reports
- Research Institute
- Latest Research Reports
- Opinion Leaders
Secondary Research
- Annual Reports
- White Paper
- Latest Press Release
- Industry Association
- Paid Database
- Investor Presentations

Step 4 - Data Triangulation
Involves using different sources of information in order to increase the validity of a study
These sources are likely to be stakeholders in a program - participants, other researchers, program staff, other community members, and so on.
Then we put all data in single framework & apply various statistical tools to find out the dynamic on the market.
During the analysis stage, feedback from the stakeholder groups would be compared to determine areas of agreement as well as areas of divergence