

Key Insights
The global protective eyewear market, encompassing spectacles, welding protection, overspecs, and goggles, is a mature yet evolving sector. Projected to grow at a Compound Annual Growth Rate (CAGR) of 4.54%, the market is estimated to reach $4.38 billion by the base year 2025. Key growth drivers include increasingly stringent safety regulations across diverse industries, particularly manufacturing sectors like automotive, construction, and pharmaceuticals, where eye injuries are a significant concern. Rising workplace safety awareness and the adoption of advanced eyewear with enhanced impact resistance, anti-fog coatings, and prescription capabilities will further stimulate market expansion. Robust global construction and infrastructure development, especially in emerging economies, will also significantly boost demand.
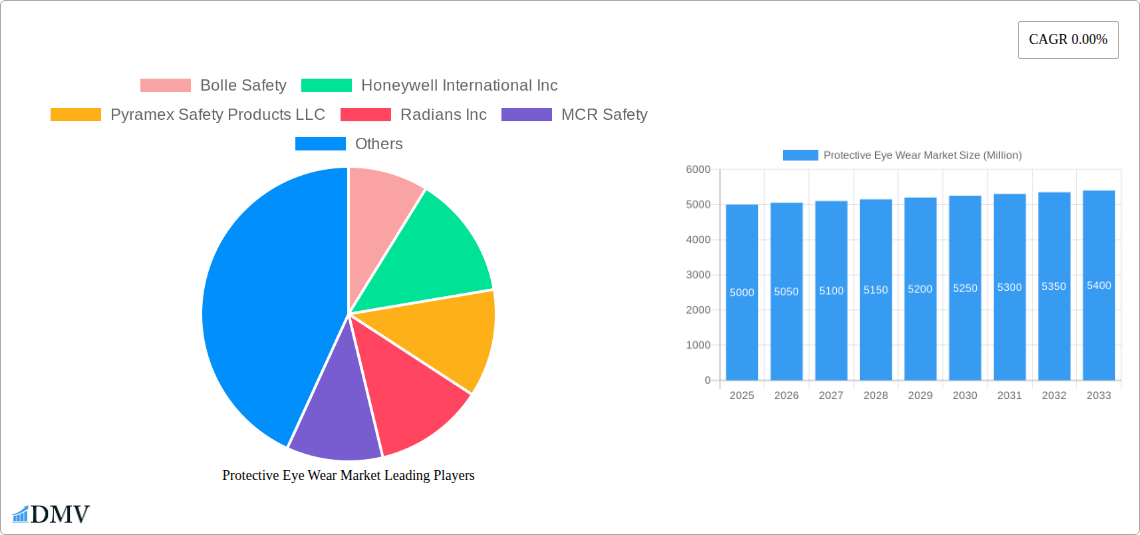
Protective Eye Wear Market Market Size (In Billion)
Potential restraints include economic downturns and fluctuations in raw material costs for specialized lens materials. The market is segmented by product type, with spectacles holding the largest share due to their broad applicability, and by end-user industry, with automotive and construction exhibiting the strongest demand. Leading market participants such as Bolle Safety, Honeywell International Inc., and 3M Company maintain dominance through strong brand recognition, extensive distribution, and comprehensive product portfolios. Future growth will be propelled by innovations in lens technology focused on improved comfort, clarity, and specialized protection against hazards like lasers and chemicals. Market penetration in underserved regions and strategic collaborations will be critical in shaping the market's future.
Protective Eye Wear Market Company Market Share
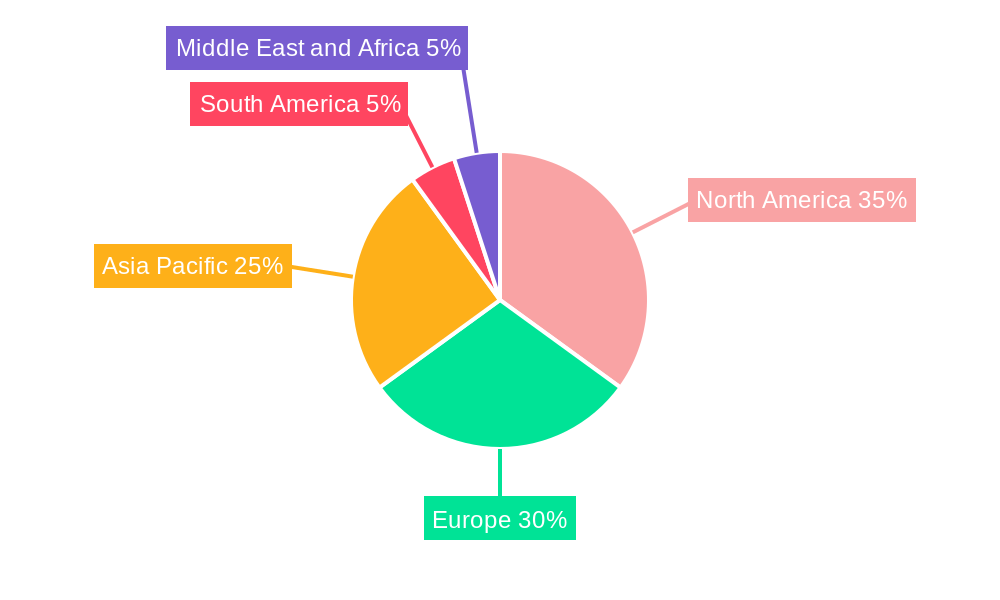
Geographically, North America and Europe currently lead in market share, attributed to stringent safety mandates and high industrial automation. However, the Asia-Pacific region, particularly China and India, presents substantial growth opportunities, driven by rapid industrialization and urbanization. These economies are increasingly adopting safety standards and prioritizing workplace safety, escalating demand for protective eyewear. South America and the Middle East & Africa also offer potential, albeit with slower expansion due to economic and infrastructural factors. The competitive landscape features a blend of large multinational corporations and niche manufacturers, with differentiation strategies centered on product innovation, superior quality, and targeted industry-specific marketing.
Protective Eye Wear Market: A Comprehensive Report (2019-2033)
This insightful report provides a detailed analysis of the global Protective Eye Wear Market, offering a comprehensive overview of market trends, growth drivers, challenges, and future opportunities from 2019 to 2033. The study covers key segments, including product types (spectacles, welding protection glasses, overspecs, goggles) and end-user industries (automotive, construction, food industry, pharmaceutical, mining, oil and gas, and others), providing crucial insights for stakeholders across the value chain. With a base year of 2025 and a forecast period extending to 2033, this report is an essential resource for businesses seeking to navigate the dynamic Protective Eye Wear Market landscape. The market size is estimated at xx Million in 2025 and is projected to reach xx Million by 2033, exhibiting a CAGR of xx%.
Protective Eye Wear Market Composition & Trends
The Protective Eye Wear Market is characterized by a moderately concentrated landscape, with key players such as Bolle Safety, Honeywell International Inc, Pyramex Safety Products LLC, Radians Inc, MCR Safety, uvex group, 3M Company, Phillips Safety Products In, Gateway Safety Inc, and SSP Eyewear holding significant market share. Market share distribution varies across segments, with spectacles and goggles dominating the product type category. Innovation in materials science, lens technology (e.g., anti-fog, UV protection), and design is driving market growth. Stringent safety regulations across various industries mandate the use of protective eyewear, fueling demand. Substitute products, while limited, include traditional eye shields and face masks, but they often lack the precision and comfort offered by specialized eyewear. M&A activity in the market has been moderate, with deal values ranging from xx Million to xx Million in recent years, focusing primarily on expanding product portfolios and geographical reach.
- Market Concentration: Moderately concentrated, with top 10 players holding approximately xx% market share.
- Innovation Catalysts: Advancements in lens materials (polycarbonate, etc.), anti-fog coatings, and ergonomic designs.
- Regulatory Landscape: Stringent safety regulations in multiple industries drive demand.
- Substitute Products: Limited, including basic eye shields and face masks.
- End-User Profiles: Diverse, spanning industrial workers, healthcare professionals, and sports enthusiasts.
- M&A Activity: Moderate activity observed with deals valued between xx Million and xx Million.
Protective Eye Wear Market Industry Evolution
The Protective Eye Wear Market has witnessed significant growth over the historical period (2019-2024), driven by increasing awareness of eye safety, rising industrialization, and stricter regulatory frameworks. Technological advancements, such as the integration of smart sensors and improved lens coatings, have enhanced the functionality and performance of protective eyewear. Consumer demand is shifting towards lightweight, comfortable, and aesthetically pleasing designs without compromising on safety features. The market growth trajectory exhibits a steady upward trend, with a projected CAGR of xx% during the forecast period (2025-2033). The adoption rate of advanced protective eyewear features, like integrated prescription lenses and Bluetooth connectivity, is growing, albeit gradually. This evolution is being shaped by factors such as rising disposable incomes, improved workplace safety standards, and a growing focus on occupational health.
Leading Regions, Countries, or Segments in Protective Eye Wear Market
North America currently dominates the Protective Eye Wear Market, followed by Europe and Asia-Pacific. The dominance of North America is attributed to robust industrial activity, stringent safety regulations, and high disposable incomes. Within product types, spectacles and goggles represent the largest segments due to their versatility and widespread applicability across numerous end-user industries. The construction and automotive sectors are key drivers in terms of end-user industries, reflecting their substantial demand for protective eyewear.
- Key Drivers (North America): Stringent safety regulations, strong industrial activity, and high disposable incomes.
- Key Drivers (Construction Sector): High occupational hazards and mandatory safety standards.
- Key Drivers (Automotive Sector): Stringent safety protocols and potential for eye injuries.
- Dominance Factors: Stringent safety regulations, high per capita income, and established industrial infrastructure.
Protective Eye Wear Market Product Innovations
Recent innovations in protective eyewear focus on improved comfort, enhanced protection, and integration of advanced features. Manufacturers are incorporating lighter materials, ergonomic designs, and advanced lens coatings (e.g., anti-scratch, anti-fog, UV protection) to enhance user experience and safety. The integration of prescription lenses into safety eyewear is another significant trend, addressing the needs of individuals requiring vision correction. Unique selling propositions frequently include superior optical clarity, impact resistance, and advanced comfort features.
Propelling Factors for Protective Eye Wear Market Growth
Several factors contribute to the Protective Eye Wear Market's growth. Technological advancements, such as improved lens materials and anti-fog coatings, are enhancing product performance and user experience. Stringent safety regulations in industries like construction and manufacturing mandate the use of protective eyewear, driving demand. Rising industrialization in developing economies is expanding the market's addressable base. Government initiatives promoting workplace safety further stimulate market growth.
Obstacles in the Protective Eye Wear Market Market
The Protective Eye Wear Market faces challenges such as fluctuating raw material prices, potential supply chain disruptions, and intense competition among established players. The market is also susceptible to economic downturns, impacting demand from end-user industries. Furthermore, regulatory changes and evolving safety standards can necessitate product adaptations, adding costs.
Future Opportunities in Protective Eye Wear Market
Emerging markets in developing economies represent significant growth opportunities. The integration of smart technologies, such as sensors and connectivity features, offers potential for innovative product development. Customization and personalization options based on user needs and preferences will be key areas for future growth. Growing awareness of eye health and safety will continue to drive demand.
Major Players in the Protective Eye Wear Market Ecosystem
- Bolle Safety
- Honeywell International Inc
- Pyramex Safety Products LLC
- Radians Inc
- MCR Safety
- uvex group
- 3M Company
- Phillips Safety Products In
- Gateway Safety Inc
- SSP Eyewear
Key Developments in Protective Eye Wear Market Industry
- June 2021: MCR Safety launched the new Memphis safety glass series, featuring anti-fog lenses and UV protection.
- October 2021: Uvex Group launched the Uvex i-range, offering three variations with UV 400 protection.
- October 2021: Uvex Group launched Uvex-Purefit, 100% recyclable safety spectacles made of polycarbonate.
Strategic Protective Eye Wear Market Market Forecast
The Protective Eye Wear Market is poised for sustained growth driven by technological advancements, increasing awareness of eye safety, and expanding industrial activity globally. Opportunities lie in developing innovative products incorporating smart technologies, focusing on personalization, and penetrating emerging markets. The market's future trajectory promises considerable potential, particularly in sectors with stringent safety requirements and a rising demand for comfortable, high-performance eyewear.
Protective Eye Wear Market Segmentation
-
1. Product Type
- 1.1. Spectacles
- 1.2. Welding Protection Glasses
- 1.3. Overspecs
- 1.4. Goggles
-
2. End-User Industry
- 2.1. Automotive
- 2.2. Construction
- 2.3. Food Industry
- 2.4. Pharmaceutical
- 2.5. Mining
- 2.6. Oil and Gas
- 2.7. Other End-User Industries
Protective Eye Wear Market Segmentation By Geography
-
1. North America
- 1.1. United States
- 1.2. Canada
- 1.3. Mexico
- 1.4. Rest of North America
-
2. Europe
- 2.1. Spain
- 2.2. United Kingdom
- 2.3. Germany
- 2.4. France
- 2.5. Italy
- 2.6. Russia
- 2.7. Rest of Europe
-
3. Asia Pacific
- 3.1. China
- 3.2. Japan
- 3.3. India
- 3.4. Australia
- 3.5. Rest of Asia Pacific
-
4. South America
- 4.1. Brazil
- 4.2. Argentina
- 4.3. Rest of South America
-
5. Middle East and Africa
- 5.1. South Africa
- 5.2. United Arab Emirates
- 5.3. Rest of Middle East and Africa
Protective Eye Wear Market Regional Market Share
Geographic Coverage of Protective Eye Wear Market
Protective Eye Wear Market REPORT HIGHLIGHTS
| Aspects | Details |
|---|---|
| Study Period | 2020-2034 |
| Base Year | 2025 |
| Estimated Year | 2026 |
| Forecast Period | 2026-2034 |
| Historical Period | 2020-2025 |
| Growth Rate | CAGR of 4.54% from 2020-2034 |
| Segmentation |
|
Table of Contents
- 1. Introduction
- 1.1. Research Scope
- 1.2. Market Segmentation
- 1.3. Research Objective
- 1.4. Definitions and Assumptions
- 2. Executive Summary
- 2.1. Market Snapshot
- 3. Market Dynamics
- 3.1. Market Drivers
- 3.2. Market Restrains
- 3.3. Market Trends
- 3.4. Market Opportunities
- 4. Market Factor Analysis
- 4.1. Porters Five Forces
- 4.1.1. Bargaining Power of Suppliers
- 4.1.2. Bargaining Power of Buyers
- 4.1.3. Threat of New Entrants
- 4.1.4. Threat of Substitutes
- 4.1.5. Competitive Rivalry
- 4.2. PESTEL analysis
- 4.3. BCG Analysis
- 4.3.1. Stars (High Growth, High Market Share)
- 4.3.2. Cash Cows (Low Growth, High Market Share)
- 4.3.3. Question Mark (High Growth, Low Market Share)
- 4.3.4. Dogs (Low Growth, Low Market Share)
- 4.4. Ansoff Matrix Analysis
- 4.5. Supply Chain Analysis
- 4.6. Regulatory Landscape
- 4.7. Current Market Potential and Opportunity Assessment (TAM–SAM–SOM Framework)
- 4.8. DMV Analyst Note
- 4.1. Porters Five Forces
- 5. Market Analysis, Insights and Forecast 2021-2033
- 5.1. Market Analysis, Insights and Forecast - by Product Type
- 5.1.1. Spectacles
- 5.1.2. Welding Protection Glasses
- 5.1.3. Overspecs
- 5.1.4. Goggles
- 5.2. Market Analysis, Insights and Forecast - by End-User Industry
- 5.2.1. Automotive
- 5.2.2. Construction
- 5.2.3. Food Industry
- 5.2.4. Pharmaceutical
- 5.2.5. Mining
- 5.2.6. Oil and Gas
- 5.2.7. Other End-User Industries
- 5.3. Market Analysis, Insights and Forecast - by Region
- 5.3.1. North America
- 5.3.2. Europe
- 5.3.3. Asia Pacific
- 5.3.4. South America
- 5.3.5. Middle East and Africa
- 5.1. Market Analysis, Insights and Forecast - by Product Type
- 6. Global Protective Eye Wear Market Analysis, Insights and Forecast, 2021-2033
- 6.1. Market Analysis, Insights and Forecast - by Product Type
- 6.1.1. Spectacles
- 6.1.2. Welding Protection Glasses
- 6.1.3. Overspecs
- 6.1.4. Goggles
- 6.2. Market Analysis, Insights and Forecast - by End-User Industry
- 6.2.1. Automotive
- 6.2.2. Construction
- 6.2.3. Food Industry
- 6.2.4. Pharmaceutical
- 6.2.5. Mining
- 6.2.6. Oil and Gas
- 6.2.7. Other End-User Industries
- 6.1. Market Analysis, Insights and Forecast - by Product Type
- 7. North America Protective Eye Wear Market Analysis, Insights and Forecast, 2020-2032
- 7.1. Market Analysis, Insights and Forecast - by Product Type
- 7.1.1. Spectacles
- 7.1.2. Welding Protection Glasses
- 7.1.3. Overspecs
- 7.1.4. Goggles
- 7.2. Market Analysis, Insights and Forecast - by End-User Industry
- 7.2.1. Automotive
- 7.2.2. Construction
- 7.2.3. Food Industry
- 7.2.4. Pharmaceutical
- 7.2.5. Mining
- 7.2.6. Oil and Gas
- 7.2.7. Other End-User Industries
- 7.1. Market Analysis, Insights and Forecast - by Product Type
- 8. Europe Protective Eye Wear Market Analysis, Insights and Forecast, 2020-2032
- 8.1. Market Analysis, Insights and Forecast - by Product Type
- 8.1.1. Spectacles
- 8.1.2. Welding Protection Glasses
- 8.1.3. Overspecs
- 8.1.4. Goggles
- 8.2. Market Analysis, Insights and Forecast - by End-User Industry
- 8.2.1. Automotive
- 8.2.2. Construction
- 8.2.3. Food Industry
- 8.2.4. Pharmaceutical
- 8.2.5. Mining
- 8.2.6. Oil and Gas
- 8.2.7. Other End-User Industries
- 8.1. Market Analysis, Insights and Forecast - by Product Type
- 9. Asia Pacific Protective Eye Wear Market Analysis, Insights and Forecast, 2020-2032
- 9.1. Market Analysis, Insights and Forecast - by Product Type
- 9.1.1. Spectacles
- 9.1.2. Welding Protection Glasses
- 9.1.3. Overspecs
- 9.1.4. Goggles
- 9.2. Market Analysis, Insights and Forecast - by End-User Industry
- 9.2.1. Automotive
- 9.2.2. Construction
- 9.2.3. Food Industry
- 9.2.4. Pharmaceutical
- 9.2.5. Mining
- 9.2.6. Oil and Gas
- 9.2.7. Other End-User Industries
- 9.1. Market Analysis, Insights and Forecast - by Product Type
- 10. South America Protective Eye Wear Market Analysis, Insights and Forecast, 2020-2032
- 10.1. Market Analysis, Insights and Forecast - by Product Type
- 10.1.1. Spectacles
- 10.1.2. Welding Protection Glasses
- 10.1.3. Overspecs
- 10.1.4. Goggles
- 10.2. Market Analysis, Insights and Forecast - by End-User Industry
- 10.2.1. Automotive
- 10.2.2. Construction
- 10.2.3. Food Industry
- 10.2.4. Pharmaceutical
- 10.2.5. Mining
- 10.2.6. Oil and Gas
- 10.2.7. Other End-User Industries
- 10.1. Market Analysis, Insights and Forecast - by Product Type
- 11. Middle East and Africa Protective Eye Wear Market Analysis, Insights and Forecast, 2020-2032
- 11.1. Market Analysis, Insights and Forecast - by Product Type
- 11.1.1. Spectacles
- 11.1.2. Welding Protection Glasses
- 11.1.3. Overspecs
- 11.1.4. Goggles
- 11.2. Market Analysis, Insights and Forecast - by End-User Industry
- 11.2.1. Automotive
- 11.2.2. Construction
- 11.2.3. Food Industry
- 11.2.4. Pharmaceutical
- 11.2.5. Mining
- 11.2.6. Oil and Gas
- 11.2.7. Other End-User Industries
- 11.1. Market Analysis, Insights and Forecast - by Product Type
- 12. Competitive Analysis
- 12.1. Company Profiles
- 12.1.1 Bolle Safety
- 12.1.1.1. Company Overview
- 12.1.1.2. Products
- 12.1.1.3. Company Financials
- 12.1.1.4. SWOT Analysis
- 12.1.2 Honeywell International Inc
- 12.1.2.1. Company Overview
- 12.1.2.2. Products
- 12.1.2.3. Company Financials
- 12.1.2.4. SWOT Analysis
- 12.1.3 Pyramex Safety Products LLC
- 12.1.3.1. Company Overview
- 12.1.3.2. Products
- 12.1.3.3. Company Financials
- 12.1.3.4. SWOT Analysis
- 12.1.4 Radians Inc
- 12.1.4.1. Company Overview
- 12.1.4.2. Products
- 12.1.4.3. Company Financials
- 12.1.4.4. SWOT Analysis
- 12.1.5 MCR Safety
- 12.1.5.1. Company Overview
- 12.1.5.2. Products
- 12.1.5.3. Company Financials
- 12.1.5.4. SWOT Analysis
- 12.1.6 uvex group
- 12.1.6.1. Company Overview
- 12.1.6.2. Products
- 12.1.6.3. Company Financials
- 12.1.6.4. SWOT Analysis
- 12.1.7 3M Company
- 12.1.7.1. Company Overview
- 12.1.7.2. Products
- 12.1.7.3. Company Financials
- 12.1.7.4. SWOT Analysis
- 12.1.8 Phillips Safety Products In
- 12.1.8.1. Company Overview
- 12.1.8.2. Products
- 12.1.8.3. Company Financials
- 12.1.8.4. SWOT Analysis
- 12.1.9 Gateway Safety Inc
- 12.1.9.1. Company Overview
- 12.1.9.2. Products
- 12.1.9.3. Company Financials
- 12.1.9.4. SWOT Analysis
- 12.1.10 SSP Eyewear
- 12.1.10.1. Company Overview
- 12.1.10.2. Products
- 12.1.10.3. Company Financials
- 12.1.10.4. SWOT Analysis
- 12.1.1 Bolle Safety
- 12.2. Market Entropy
- 12.2.1 Company's Key Areas Served
- 12.2.2 Recent Developments
- 12.3. Company Market Share Analysis 2025
- 12.3.1 Top 5 Companies Market Share Analysis
- 12.3.2 Top 3 Companies Market Share Analysis
- 12.4. List of Potential Customers
- 13. Research Methodology
List of Figures
- Figure 1: Global Protective Eye Wear Market Revenue Breakdown (billion, %) by Region 2025 & 2033
- Figure 2: Global Protective Eye Wear Market Volume Breakdown (K Units, %) by Region 2025 & 2033
- Figure 3: North America Protective Eye Wear Market Revenue (billion), by Product Type 2025 & 2033
- Figure 4: North America Protective Eye Wear Market Volume (K Units), by Product Type 2025 & 2033
- Figure 5: North America Protective Eye Wear Market Revenue Share (%), by Product Type 2025 & 2033
- Figure 6: North America Protective Eye Wear Market Volume Share (%), by Product Type 2025 & 2033
- Figure 7: North America Protective Eye Wear Market Revenue (billion), by End-User Industry 2025 & 2033
- Figure 8: North America Protective Eye Wear Market Volume (K Units), by End-User Industry 2025 & 2033
- Figure 9: North America Protective Eye Wear Market Revenue Share (%), by End-User Industry 2025 & 2033
- Figure 10: North America Protective Eye Wear Market Volume Share (%), by End-User Industry 2025 & 2033
- Figure 11: North America Protective Eye Wear Market Revenue (billion), by Country 2025 & 2033
- Figure 12: North America Protective Eye Wear Market Volume (K Units), by Country 2025 & 2033
- Figure 13: North America Protective Eye Wear Market Revenue Share (%), by Country 2025 & 2033
- Figure 14: North America Protective Eye Wear Market Volume Share (%), by Country 2025 & 2033
- Figure 15: Europe Protective Eye Wear Market Revenue (billion), by Product Type 2025 & 2033
- Figure 16: Europe Protective Eye Wear Market Volume (K Units), by Product Type 2025 & 2033
- Figure 17: Europe Protective Eye Wear Market Revenue Share (%), by Product Type 2025 & 2033
- Figure 18: Europe Protective Eye Wear Market Volume Share (%), by Product Type 2025 & 2033
- Figure 19: Europe Protective Eye Wear Market Revenue (billion), by End-User Industry 2025 & 2033
- Figure 20: Europe Protective Eye Wear Market Volume (K Units), by End-User Industry 2025 & 2033
- Figure 21: Europe Protective Eye Wear Market Revenue Share (%), by End-User Industry 2025 & 2033
- Figure 22: Europe Protective Eye Wear Market Volume Share (%), by End-User Industry 2025 & 2033
- Figure 23: Europe Protective Eye Wear Market Revenue (billion), by Country 2025 & 2033
- Figure 24: Europe Protective Eye Wear Market Volume (K Units), by Country 2025 & 2033
- Figure 25: Europe Protective Eye Wear Market Revenue Share (%), by Country 2025 & 2033
- Figure 26: Europe Protective Eye Wear Market Volume Share (%), by Country 2025 & 2033
- Figure 27: Asia Pacific Protective Eye Wear Market Revenue (billion), by Product Type 2025 & 2033
- Figure 28: Asia Pacific Protective Eye Wear Market Volume (K Units), by Product Type 2025 & 2033
- Figure 29: Asia Pacific Protective Eye Wear Market Revenue Share (%), by Product Type 2025 & 2033
- Figure 30: Asia Pacific Protective Eye Wear Market Volume Share (%), by Product Type 2025 & 2033
- Figure 31: Asia Pacific Protective Eye Wear Market Revenue (billion), by End-User Industry 2025 & 2033
- Figure 32: Asia Pacific Protective Eye Wear Market Volume (K Units), by End-User Industry 2025 & 2033
- Figure 33: Asia Pacific Protective Eye Wear Market Revenue Share (%), by End-User Industry 2025 & 2033
- Figure 34: Asia Pacific Protective Eye Wear Market Volume Share (%), by End-User Industry 2025 & 2033
- Figure 35: Asia Pacific Protective Eye Wear Market Revenue (billion), by Country 2025 & 2033
- Figure 36: Asia Pacific Protective Eye Wear Market Volume (K Units), by Country 2025 & 2033
- Figure 37: Asia Pacific Protective Eye Wear Market Revenue Share (%), by Country 2025 & 2033
- Figure 38: Asia Pacific Protective Eye Wear Market Volume Share (%), by Country 2025 & 2033
- Figure 39: South America Protective Eye Wear Market Revenue (billion), by Product Type 2025 & 2033
- Figure 40: South America Protective Eye Wear Market Volume (K Units), by Product Type 2025 & 2033
- Figure 41: South America Protective Eye Wear Market Revenue Share (%), by Product Type 2025 & 2033
- Figure 42: South America Protective Eye Wear Market Volume Share (%), by Product Type 2025 & 2033
- Figure 43: South America Protective Eye Wear Market Revenue (billion), by End-User Industry 2025 & 2033
- Figure 44: South America Protective Eye Wear Market Volume (K Units), by End-User Industry 2025 & 2033
- Figure 45: South America Protective Eye Wear Market Revenue Share (%), by End-User Industry 2025 & 2033
- Figure 46: South America Protective Eye Wear Market Volume Share (%), by End-User Industry 2025 & 2033
- Figure 47: South America Protective Eye Wear Market Revenue (billion), by Country 2025 & 2033
- Figure 48: South America Protective Eye Wear Market Volume (K Units), by Country 2025 & 2033
- Figure 49: South America Protective Eye Wear Market Revenue Share (%), by Country 2025 & 2033
- Figure 50: South America Protective Eye Wear Market Volume Share (%), by Country 2025 & 2033
- Figure 51: Middle East and Africa Protective Eye Wear Market Revenue (billion), by Product Type 2025 & 2033
- Figure 52: Middle East and Africa Protective Eye Wear Market Volume (K Units), by Product Type 2025 & 2033
- Figure 53: Middle East and Africa Protective Eye Wear Market Revenue Share (%), by Product Type 2025 & 2033
- Figure 54: Middle East and Africa Protective Eye Wear Market Volume Share (%), by Product Type 2025 & 2033
- Figure 55: Middle East and Africa Protective Eye Wear Market Revenue (billion), by End-User Industry 2025 & 2033
- Figure 56: Middle East and Africa Protective Eye Wear Market Volume (K Units), by End-User Industry 2025 & 2033
- Figure 57: Middle East and Africa Protective Eye Wear Market Revenue Share (%), by End-User Industry 2025 & 2033
- Figure 58: Middle East and Africa Protective Eye Wear Market Volume Share (%), by End-User Industry 2025 & 2033
- Figure 59: Middle East and Africa Protective Eye Wear Market Revenue (billion), by Country 2025 & 2033
- Figure 60: Middle East and Africa Protective Eye Wear Market Volume (K Units), by Country 2025 & 2033
- Figure 61: Middle East and Africa Protective Eye Wear Market Revenue Share (%), by Country 2025 & 2033
- Figure 62: Middle East and Africa Protective Eye Wear Market Volume Share (%), by Country 2025 & 2033
List of Tables
- Table 1: Global Protective Eye Wear Market Revenue billion Forecast, by Product Type 2020 & 2033
- Table 2: Global Protective Eye Wear Market Volume K Units Forecast, by Product Type 2020 & 2033
- Table 3: Global Protective Eye Wear Market Revenue billion Forecast, by End-User Industry 2020 & 2033
- Table 4: Global Protective Eye Wear Market Volume K Units Forecast, by End-User Industry 2020 & 2033
- Table 5: Global Protective Eye Wear Market Revenue billion Forecast, by Region 2020 & 2033
- Table 6: Global Protective Eye Wear Market Volume K Units Forecast, by Region 2020 & 2033
- Table 7: Global Protective Eye Wear Market Revenue billion Forecast, by Product Type 2020 & 2033
- Table 8: Global Protective Eye Wear Market Volume K Units Forecast, by Product Type 2020 & 2033
- Table 9: Global Protective Eye Wear Market Revenue billion Forecast, by End-User Industry 2020 & 2033
- Table 10: Global Protective Eye Wear Market Volume K Units Forecast, by End-User Industry 2020 & 2033
- Table 11: Global Protective Eye Wear Market Revenue billion Forecast, by Country 2020 & 2033
- Table 12: Global Protective Eye Wear Market Volume K Units Forecast, by Country 2020 & 2033
- Table 13: United States Protective Eye Wear Market Revenue (billion) Forecast, by Application 2020 & 2033
- Table 14: United States Protective Eye Wear Market Volume (K Units) Forecast, by Application 2020 & 2033
- Table 15: Canada Protective Eye Wear Market Revenue (billion) Forecast, by Application 2020 & 2033
- Table 16: Canada Protective Eye Wear Market Volume (K Units) Forecast, by Application 2020 & 2033
- Table 17: Mexico Protective Eye Wear Market Revenue (billion) Forecast, by Application 2020 & 2033
- Table 18: Mexico Protective Eye Wear Market Volume (K Units) Forecast, by Application 2020 & 2033
- Table 19: Rest of North America Protective Eye Wear Market Revenue (billion) Forecast, by Application 2020 & 2033
- Table 20: Rest of North America Protective Eye Wear Market Volume (K Units) Forecast, by Application 2020 & 2033
- Table 21: Global Protective Eye Wear Market Revenue billion Forecast, by Product Type 2020 & 2033
- Table 22: Global Protective Eye Wear Market Volume K Units Forecast, by Product Type 2020 & 2033
- Table 23: Global Protective Eye Wear Market Revenue billion Forecast, by End-User Industry 2020 & 2033
- Table 24: Global Protective Eye Wear Market Volume K Units Forecast, by End-User Industry 2020 & 2033
- Table 25: Global Protective Eye Wear Market Revenue billion Forecast, by Country 2020 & 2033
- Table 26: Global Protective Eye Wear Market Volume K Units Forecast, by Country 2020 & 2033
- Table 27: Spain Protective Eye Wear Market Revenue (billion) Forecast, by Application 2020 & 2033
- Table 28: Spain Protective Eye Wear Market Volume (K Units) Forecast, by Application 2020 & 2033
- Table 29: United Kingdom Protective Eye Wear Market Revenue (billion) Forecast, by Application 2020 & 2033
- Table 30: United Kingdom Protective Eye Wear Market Volume (K Units) Forecast, by Application 2020 & 2033
- Table 31: Germany Protective Eye Wear Market Revenue (billion) Forecast, by Application 2020 & 2033
- Table 32: Germany Protective Eye Wear Market Volume (K Units) Forecast, by Application 2020 & 2033
- Table 33: France Protective Eye Wear Market Revenue (billion) Forecast, by Application 2020 & 2033
- Table 34: France Protective Eye Wear Market Volume (K Units) Forecast, by Application 2020 & 2033
- Table 35: Italy Protective Eye Wear Market Revenue (billion) Forecast, by Application 2020 & 2033
- Table 36: Italy Protective Eye Wear Market Volume (K Units) Forecast, by Application 2020 & 2033
- Table 37: Russia Protective Eye Wear Market Revenue (billion) Forecast, by Application 2020 & 2033
- Table 38: Russia Protective Eye Wear Market Volume (K Units) Forecast, by Application 2020 & 2033
- Table 39: Rest of Europe Protective Eye Wear Market Revenue (billion) Forecast, by Application 2020 & 2033
- Table 40: Rest of Europe Protective Eye Wear Market Volume (K Units) Forecast, by Application 2020 & 2033
- Table 41: Global Protective Eye Wear Market Revenue billion Forecast, by Product Type 2020 & 2033
- Table 42: Global Protective Eye Wear Market Volume K Units Forecast, by Product Type 2020 & 2033
- Table 43: Global Protective Eye Wear Market Revenue billion Forecast, by End-User Industry 2020 & 2033
- Table 44: Global Protective Eye Wear Market Volume K Units Forecast, by End-User Industry 2020 & 2033
- Table 45: Global Protective Eye Wear Market Revenue billion Forecast, by Country 2020 & 2033
- Table 46: Global Protective Eye Wear Market Volume K Units Forecast, by Country 2020 & 2033
- Table 47: China Protective Eye Wear Market Revenue (billion) Forecast, by Application 2020 & 2033
- Table 48: China Protective Eye Wear Market Volume (K Units) Forecast, by Application 2020 & 2033
- Table 49: Japan Protective Eye Wear Market Revenue (billion) Forecast, by Application 2020 & 2033
- Table 50: Japan Protective Eye Wear Market Volume (K Units) Forecast, by Application 2020 & 2033
- Table 51: India Protective Eye Wear Market Revenue (billion) Forecast, by Application 2020 & 2033
- Table 52: India Protective Eye Wear Market Volume (K Units) Forecast, by Application 2020 & 2033
- Table 53: Australia Protective Eye Wear Market Revenue (billion) Forecast, by Application 2020 & 2033
- Table 54: Australia Protective Eye Wear Market Volume (K Units) Forecast, by Application 2020 & 2033
- Table 55: Rest of Asia Pacific Protective Eye Wear Market Revenue (billion) Forecast, by Application 2020 & 2033
- Table 56: Rest of Asia Pacific Protective Eye Wear Market Volume (K Units) Forecast, by Application 2020 & 2033
- Table 57: Global Protective Eye Wear Market Revenue billion Forecast, by Product Type 2020 & 2033
- Table 58: Global Protective Eye Wear Market Volume K Units Forecast, by Product Type 2020 & 2033
- Table 59: Global Protective Eye Wear Market Revenue billion Forecast, by End-User Industry 2020 & 2033
- Table 60: Global Protective Eye Wear Market Volume K Units Forecast, by End-User Industry 2020 & 2033
- Table 61: Global Protective Eye Wear Market Revenue billion Forecast, by Country 2020 & 2033
- Table 62: Global Protective Eye Wear Market Volume K Units Forecast, by Country 2020 & 2033
- Table 63: Brazil Protective Eye Wear Market Revenue (billion) Forecast, by Application 2020 & 2033
- Table 64: Brazil Protective Eye Wear Market Volume (K Units) Forecast, by Application 2020 & 2033
- Table 65: Argentina Protective Eye Wear Market Revenue (billion) Forecast, by Application 2020 & 2033
- Table 66: Argentina Protective Eye Wear Market Volume (K Units) Forecast, by Application 2020 & 2033
- Table 67: Rest of South America Protective Eye Wear Market Revenue (billion) Forecast, by Application 2020 & 2033
- Table 68: Rest of South America Protective Eye Wear Market Volume (K Units) Forecast, by Application 2020 & 2033
- Table 69: Global Protective Eye Wear Market Revenue billion Forecast, by Product Type 2020 & 2033
- Table 70: Global Protective Eye Wear Market Volume K Units Forecast, by Product Type 2020 & 2033
- Table 71: Global Protective Eye Wear Market Revenue billion Forecast, by End-User Industry 2020 & 2033
- Table 72: Global Protective Eye Wear Market Volume K Units Forecast, by End-User Industry 2020 & 2033
- Table 73: Global Protective Eye Wear Market Revenue billion Forecast, by Country 2020 & 2033
- Table 74: Global Protective Eye Wear Market Volume K Units Forecast, by Country 2020 & 2033
- Table 75: South Africa Protective Eye Wear Market Revenue (billion) Forecast, by Application 2020 & 2033
- Table 76: South Africa Protective Eye Wear Market Volume (K Units) Forecast, by Application 2020 & 2033
- Table 77: United Arab Emirates Protective Eye Wear Market Revenue (billion) Forecast, by Application 2020 & 2033
- Table 78: United Arab Emirates Protective Eye Wear Market Volume (K Units) Forecast, by Application 2020 & 2033
- Table 79: Rest of Middle East and Africa Protective Eye Wear Market Revenue (billion) Forecast, by Application 2020 & 2033
- Table 80: Rest of Middle East and Africa Protective Eye Wear Market Volume (K Units) Forecast, by Application 2020 & 2033
Frequently Asked Questions
1. What is the projected Compound Annual Growth Rate (CAGR) of the Protective Eye Wear Market?
The projected CAGR is approximately 4.54%.
2. Which companies are prominent players in the Protective Eye Wear Market?
Key companies in the market include Bolle Safety, Honeywell International Inc, Pyramex Safety Products LLC, Radians Inc, MCR Safety, uvex group, 3M Company, Phillips Safety Products In, Gateway Safety Inc, SSP Eyewear.
3. What are the main segments of the Protective Eye Wear Market?
The market segments include Product Type, End-User Industry.
4. Can you provide details about the market size?
The market size is estimated to be USD 4.38 billion as of 2022.
5. What are some drivers contributing to market growth?
Shift in Shopping Mode Preferences of the people; Increasing Urbanization; Growing Disposable Income.
6. What are the notable trends driving market growth?
Increasing Prevalence of Eye Injuries at Workplace.
7. Are there any restraints impacting market growth?
High-priced products and additional delivery charges; Inconsistency in product quality.
8. Can you provide examples of recent developments in the market?
October 2021: Uvex Group launched the Uvex i-range, an innovative safety eyewear for multiple applications. The products comprise 3 different varieties uvex i-lite, uvex i-guard, and uvex i-guard plus. The products are coated with UV 400 protection.
9. What pricing options are available for accessing the report?
Pricing options include single-user, multi-user, and enterprise licenses priced at USD 4750, USD 5250, and USD 8750 respectively.
10. Is the market size provided in terms of value or volume?
The market size is provided in terms of value, measured in billion and volume, measured in K Units.
11. Are there any specific market keywords associated with the report?
Yes, the market keyword associated with the report is "Protective Eye Wear Market," which aids in identifying and referencing the specific market segment covered.
12. How do I determine which pricing option suits my needs best?
The pricing options vary based on user requirements and access needs. Individual users may opt for single-user licenses, while businesses requiring broader access may choose multi-user or enterprise licenses for cost-effective access to the report.
13. Are there any additional resources or data provided in the Protective Eye Wear Market report?
While the report offers comprehensive insights, it's advisable to review the specific contents or supplementary materials provided to ascertain if additional resources or data are available.
14. How can I stay updated on further developments or reports in the Protective Eye Wear Market?
To stay informed about further developments, trends, and reports in the Protective Eye Wear Market, consider subscribing to industry newsletters, following relevant companies and organizations, or regularly checking reputable industry news sources and publications.
Methodology
Step 1 - Identification of Relevant Samples Size from Population Database


Step 2 - Approaches for Defining Global Market Size (Value, Volume* & Price*)

Note*: In applicable scenarios
Step 3 - Data Sources
Primary Research
- Web Analytics
- Survey Reports
- Research Institute
- Latest Research Reports
- Opinion Leaders
Secondary Research
- Annual Reports
- White Paper
- Latest Press Release
- Industry Association
- Paid Database
- Investor Presentations

Step 4 - Data Triangulation
Involves using different sources of information in order to increase the validity of a study
These sources are likely to be stakeholders in a program - participants, other researchers, program staff, other community members, and so on.
Then we put all data in single framework & apply various statistical tools to find out the dynamic on the market.
During the analysis stage, feedback from the stakeholder groups would be compared to determine areas of agreement as well as areas of divergence