

Key Insights
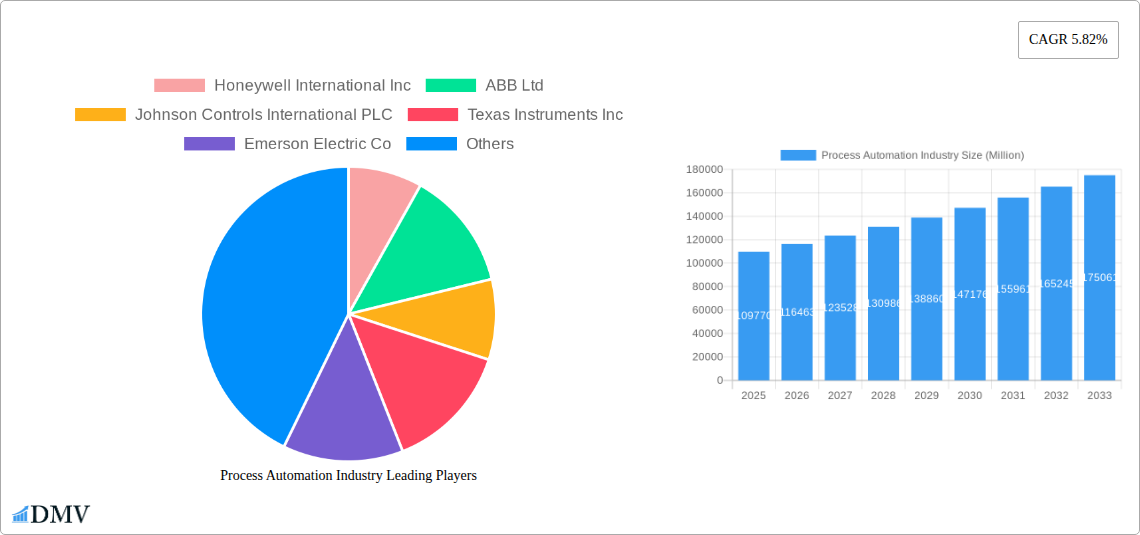
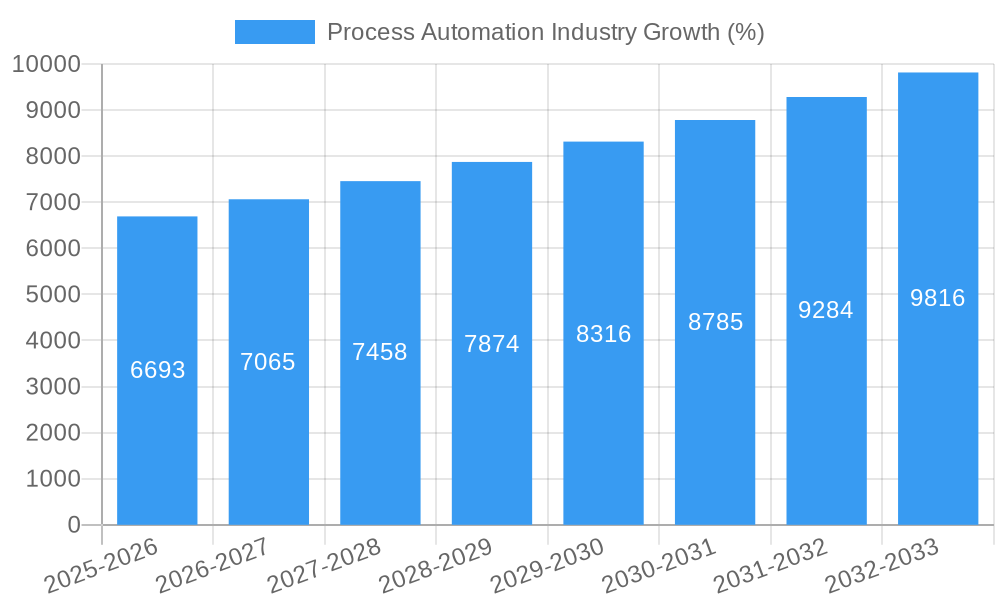
The global process automation market, valued at $109.77 billion in 2025, is projected to experience robust growth, driven by increasing industrial automation adoption across diverse sectors. A compound annual growth rate (CAGR) of 5.82% from 2025 to 2033 indicates a significant expansion, primarily fueled by the rising demand for enhanced operational efficiency, improved safety standards, and optimized resource utilization. Key drivers include the growing adoption of Industry 4.0 technologies like cloud computing, big data analytics, and artificial intelligence, enabling predictive maintenance, real-time process monitoring, and sophisticated control systems. The increasing complexity of industrial processes and the need for precise control across various sectors, such as oil & gas, pharmaceuticals, and food & beverages, are further propelling market growth. Significant investments in infrastructure upgrades and modernization across developing economies also contribute to the expansion.
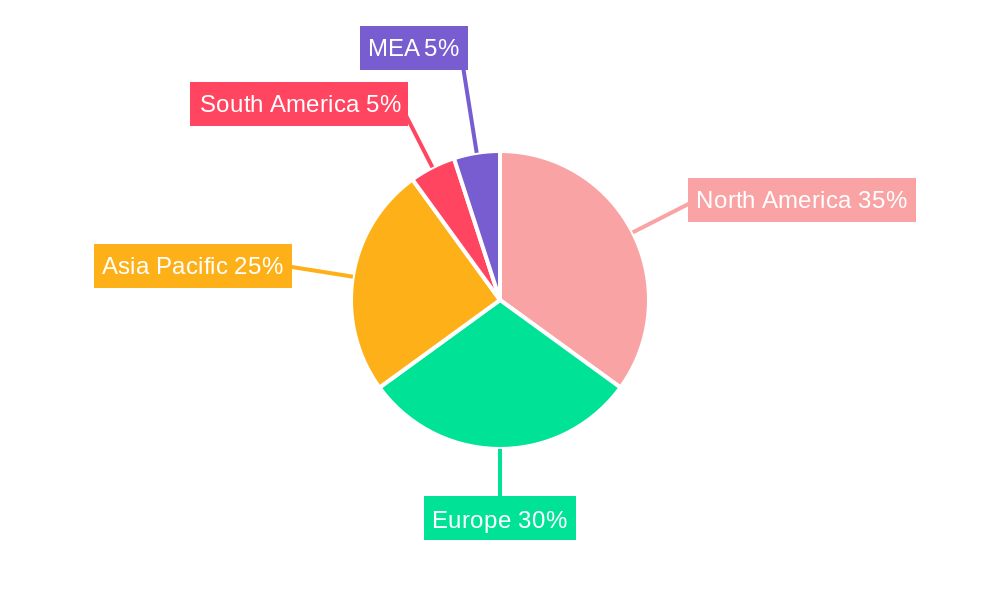
Segment-wise, SCADA, PLC, and DCS systems currently hold significant market share, but the adoption of advanced systems like MES is gaining traction, reflecting a shift towards integrated and data-driven process management. Wireless communication protocols are witnessing increasing adoption due to their flexibility and cost-effectiveness, while wired protocols continue to dominate in applications requiring high reliability and security. Geographically, North America and Europe currently hold larger market shares due to their established industrial base and early adoption of automation technologies. However, the Asia-Pacific region is expected to exhibit the fastest growth rate, driven by rapid industrialization and rising investments in manufacturing capabilities. Competitive forces are strong, with major players like Honeywell, ABB, and Siemens constantly innovating and expanding their product portfolios to maintain market leadership. While regulatory compliance and cybersecurity concerns pose certain restraints, the overall market outlook remains positive, indicating sustained growth and transformation within the process automation landscape over the forecast period.
Process Automation Industry Market Report: 2019-2033
This comprehensive report provides a detailed analysis of the global process automation industry, offering invaluable insights for stakeholders seeking to navigate this dynamic market. The study covers the period 2019-2033, with a focus on the 2025-2033 forecast period. The market is segmented by system type, communication protocol, and end-user industry, encompassing key players like Honeywell International Inc., ABB Ltd., and Siemens Corporation. This report projects a market valuation exceeding xx Million by 2033, driven by technological advancements and increasing industry demand.
Process Automation Industry Market Composition & Trends
The global process automation market is experiencing robust growth, driven by several key factors. Market concentration is moderately high, with the top ten players holding an estimated 60% market share in 2025. Innovation is spurred by the need for enhanced efficiency, safety, and sustainability across various industries. Stringent regulatory requirements regarding safety and emissions further accelerate adoption. Substitute products, such as manual control systems, are gradually losing ground due to the clear advantages of automation.
- Market Share Distribution (2025): Honeywell (12%), ABB (10%), Siemens (9%), Emerson Electric (8%), Rockwell Automation (7%), Others (54%)
- M&A Activity (2019-2024): Over 150 significant mergers and acquisitions, totaling approximately $xx Million in deal value, highlight the industry's consolidation and expansion efforts.
- End-User Profile: The chemical and petrochemical, oil and gas, and energy and utilities sectors are major drivers, with growing adoption in pharmaceuticals and food and beverages.
The regulatory landscape is constantly evolving, particularly concerning data security and environmental compliance. This leads to ongoing investment in advanced security protocols and sustainable automation solutions.
Process Automation Industry Industry Evolution
The process automation industry has witnessed a dramatic transformation in recent years, transitioning from basic automation to sophisticated, interconnected systems leveraging IIoT and AI. The market has consistently exhibited robust growth, with a Compound Annual Growth Rate (CAGR) of approximately 8% during the historical period (2019-2024). This growth is expected to continue at a CAGR of 7% during the forecast period (2025-2033), reaching a projected value exceeding xx Million by 2033. Technological advancements, such as the increasing adoption of cloud-based solutions, AI-powered predictive maintenance, and advanced analytics, have significantly improved efficiency and reduced operational costs. The shift in consumer demands towards enhanced safety, sustainability, and reduced operational expenses further fuel this industry growth. Adoption rates for advanced automation solutions like predictive maintenance are steadily increasing, currently exceeding 25% across key industries, projected to reach 40% by 2033.
Leading Regions, Countries, or Segments in Process Automation Industry
The North American region holds the largest market share, driven by robust investment in the oil and gas, chemical, and energy sectors. Within system types, Programmable Logic Controllers (PLCs) and Distributed Control Systems (DCS) dominate, followed by SCADA and MES. Wired protocols currently maintain a significant share but the adoption of wireless protocols is rapidly growing, driven by advancements in reliability and security.
- Key Drivers (North America):
- Significant investments in infrastructure modernization.
- Favorable regulatory environment promoting automation adoption.
- Strong presence of major automation vendors.
- Dominance Factors (PLCs and DCS):
- Established technology and widespread adoption.
- Scalability and flexibility across various industrial applications.
- Robust ecosystem of supporting services and expertise.
- Emerging Trends (Wireless Protocols): Enhanced security features, reduced installation costs, and increased flexibility are driving adoption.
Process Automation Industry Product Innovations
Recent innovations focus on enhancing system integration, improving data analytics capabilities, and implementing advanced security measures. Cloud-based solutions offer remote monitoring and control, increasing efficiency and reducing downtime. AI-powered predictive maintenance minimizes unexpected shutdowns, saving considerable costs. The integration of augmented reality (AR) technologies is revolutionizing maintenance and training procedures, enhancing worker safety and operational efficiency.
Propelling Factors for Process Automation Industry Growth
Several factors are fueling industry growth, including: technological advancements such as AI, IoT, and cloud computing; increasing government initiatives promoting automation in various sectors; and rising demand for operational efficiency and cost reduction across industries. The need for enhanced safety and environmental compliance also plays a significant role.
Obstacles in the Process Automation Industry Market
Significant challenges include the high initial investment costs associated with implementing automation systems, potential supply chain disruptions impacting component availability, and intense competition from established and emerging players. Cybersecurity risks and concerns regarding data privacy are also considerable hurdles. The average implementation cost for a large-scale automation project can exceed $xx Million, representing a major barrier to entry for smaller companies.
Future Opportunities in Process Automation Industry
The industry presents significant growth opportunities in emerging markets, particularly in Asia and developing regions. The increasing adoption of digital twin technology, AI-driven optimization, and edge computing presents immense opportunities. Focus on sustainable automation solutions aligns with global efforts to reduce carbon footprint, providing considerable market potential.
Major Players in the Process Automation Industry Ecosystem
- Honeywell International Inc
- ABB Ltd
- Johnson Controls International PLC
- Texas Instruments Inc
- Emerson Electric Co
- Mitsubishi Electric Corporation
- Schneider Electric SE
- Eaton Corporation PLC
- Siemens Corporation
- Rockwell Automation Inc
- Bosch Rexroth AG (Robert Bosch GmBH)
- Dassault Systemes SE
- Yokogawa Electric Corporation
Key Developments in Process Automation Industry Industry
- 2023 Q2: Siemens launched a new AI-powered predictive maintenance platform.
- 2022 Q4: ABB acquired a smaller automation solutions provider, expanding its market presence.
- 2021 Q3: Honeywell partnered with a leading cloud provider to enhance its cloud-based automation offerings. (Further details on specific developments would be included in the full report).
Strategic Process Automation Industry Market Forecast
The process automation market is poised for sustained growth, propelled by technological advancements, increasing industrial digitization, and the global push towards greater sustainability. The expansion into new sectors and geographical regions presents considerable untapped potential. The focus on developing robust and secure industrial automation solutions, aligning with the increasing demand for efficient, safe, and environmentally friendly industrial operations will be pivotal for future market leadership.
Process Automation Industry Segmentation
-
1. System Type
- 1.1. Supervisory Control and Data Acquisition (SCADA)
- 1.2. Programmable Logic Controller (PLC)
- 1.3. Distributed Control System (DCS)
- 1.4. Machine Execution System (MES)
- 1.5. Valves and Actuators
- 1.6. Electric Motors
- 1.7. Human Machine Interface (HMI)
- 1.8. Process Safety Systems
- 1.9. Sensors and Transmitters
- 1.10. Other Systems
-
2. Communication Protocol
- 2.1. Wired Protocol
- 2.2. Wireless Protocol
-
3. End-user Industry
- 3.1. Chemical and Petrochemical
- 3.2. Paper and Pulp
- 3.3. Water and Wastewater Treatment
- 3.4. Energy and Utilities
- 3.5. Oil and Gas
- 3.6. Pharmaceutical
- 3.7. Food and Beverages
- 3.8. Other End-user Industries
Process Automation Industry Segmentation By Geography
-
1. North America
- 1.1. United States
- 1.2. Canada
-
2. Europe
- 2.1. United Kingdom
- 2.2. Germany
- 2.3. France
- 2.4. Rest of Europe
-
3. Asia Pacific
- 3.1. China
- 3.2. India
- 3.3. Japan
- 3.4. Rest of Asia Pacific
- 4. Latin America
- 5. Middle East and Africa
Process Automation Industry REPORT HIGHLIGHTS
| Aspects | Details |
|---|---|
| Study Period | 2019-2033 |
| Base Year | 2024 |
| Estimated Year | 2025 |
| Forecast Period | 2025-2033 |
| Historical Period | 2019-2024 |
| Growth Rate | CAGR of 5.82% from 2019-2033 |
| Segmentation |
|
Table of Contents
- 1. Introduction
- 1.1. Research Scope
- 1.2. Market Segmentation
- 1.3. Research Methodology
- 1.4. Definitions and Assumptions
- 2. Executive Summary
- 2.1. Introduction
- 3. Market Dynamics
- 3.1. Introduction
- 3.2. Market Drivers
- 3.2.1. ; Rising Adoption of Robotics; Growing Emphasis on Energy Efficiency and Cost Reduction; Emergence of IIoT; Demand for Safety Automation Systems
- 3.3. Market Restrains
- 3.3.1. High Up-front Installation Costs and Interoperability Issues; Unavailability for Skilled Workforce
- 3.4. Market Trends
- 3.4.1. Paper and Pulp Segment is Expected to Register a Significant Growth
- 4. Market Factor Analysis
- 4.1. Porters Five Forces
- 4.2. Supply/Value Chain
- 4.3. PESTEL analysis
- 4.4. Market Entropy
- 4.5. Patent/Trademark Analysis
- 5. Global Process Automation Industry Analysis, Insights and Forecast, 2019-2031
- 5.1. Market Analysis, Insights and Forecast - by System Type
- 5.1.1. Supervisory Control and Data Acquisition (SCADA)
- 5.1.2. Programmable Logic Controller (PLC)
- 5.1.3. Distributed Control System (DCS)
- 5.1.4. Machine Execution System (MES)
- 5.1.5. Valves and Actuators
- 5.1.6. Electric Motors
- 5.1.7. Human Machine Interface (HMI)
- 5.1.8. Process Safety Systems
- 5.1.9. Sensors and Transmitters
- 5.1.10. Other Systems
- 5.2. Market Analysis, Insights and Forecast - by Communication Protocol
- 5.2.1. Wired Protocol
- 5.2.2. Wireless Protocol
- 5.3. Market Analysis, Insights and Forecast - by End-user Industry
- 5.3.1. Chemical and Petrochemical
- 5.3.2. Paper and Pulp
- 5.3.3. Water and Wastewater Treatment
- 5.3.4. Energy and Utilities
- 5.3.5. Oil and Gas
- 5.3.6. Pharmaceutical
- 5.3.7. Food and Beverages
- 5.3.8. Other End-user Industries
- 5.4. Market Analysis, Insights and Forecast - by Region
- 5.4.1. North America
- 5.4.2. Europe
- 5.4.3. Asia Pacific
- 5.4.4. Latin America
- 5.4.5. Middle East and Africa
- 5.1. Market Analysis, Insights and Forecast - by System Type
- 6. North America Process Automation Industry Analysis, Insights and Forecast, 2019-2031
- 6.1. Market Analysis, Insights and Forecast - by System Type
- 6.1.1. Supervisory Control and Data Acquisition (SCADA)
- 6.1.2. Programmable Logic Controller (PLC)
- 6.1.3. Distributed Control System (DCS)
- 6.1.4. Machine Execution System (MES)
- 6.1.5. Valves and Actuators
- 6.1.6. Electric Motors
- 6.1.7. Human Machine Interface (HMI)
- 6.1.8. Process Safety Systems
- 6.1.9. Sensors and Transmitters
- 6.1.10. Other Systems
- 6.2. Market Analysis, Insights and Forecast - by Communication Protocol
- 6.2.1. Wired Protocol
- 6.2.2. Wireless Protocol
- 6.3. Market Analysis, Insights and Forecast - by End-user Industry
- 6.3.1. Chemical and Petrochemical
- 6.3.2. Paper and Pulp
- 6.3.3. Water and Wastewater Treatment
- 6.3.4. Energy and Utilities
- 6.3.5. Oil and Gas
- 6.3.6. Pharmaceutical
- 6.3.7. Food and Beverages
- 6.3.8. Other End-user Industries
- 6.1. Market Analysis, Insights and Forecast - by System Type
- 7. Europe Process Automation Industry Analysis, Insights and Forecast, 2019-2031
- 7.1. Market Analysis, Insights and Forecast - by System Type
- 7.1.1. Supervisory Control and Data Acquisition (SCADA)
- 7.1.2. Programmable Logic Controller (PLC)
- 7.1.3. Distributed Control System (DCS)
- 7.1.4. Machine Execution System (MES)
- 7.1.5. Valves and Actuators
- 7.1.6. Electric Motors
- 7.1.7. Human Machine Interface (HMI)
- 7.1.8. Process Safety Systems
- 7.1.9. Sensors and Transmitters
- 7.1.10. Other Systems
- 7.2. Market Analysis, Insights and Forecast - by Communication Protocol
- 7.2.1. Wired Protocol
- 7.2.2. Wireless Protocol
- 7.3. Market Analysis, Insights and Forecast - by End-user Industry
- 7.3.1. Chemical and Petrochemical
- 7.3.2. Paper and Pulp
- 7.3.3. Water and Wastewater Treatment
- 7.3.4. Energy and Utilities
- 7.3.5. Oil and Gas
- 7.3.6. Pharmaceutical
- 7.3.7. Food and Beverages
- 7.3.8. Other End-user Industries
- 7.1. Market Analysis, Insights and Forecast - by System Type
- 8. Asia Pacific Process Automation Industry Analysis, Insights and Forecast, 2019-2031
- 8.1. Market Analysis, Insights and Forecast - by System Type
- 8.1.1. Supervisory Control and Data Acquisition (SCADA)
- 8.1.2. Programmable Logic Controller (PLC)
- 8.1.3. Distributed Control System (DCS)
- 8.1.4. Machine Execution System (MES)
- 8.1.5. Valves and Actuators
- 8.1.6. Electric Motors
- 8.1.7. Human Machine Interface (HMI)
- 8.1.8. Process Safety Systems
- 8.1.9. Sensors and Transmitters
- 8.1.10. Other Systems
- 8.2. Market Analysis, Insights and Forecast - by Communication Protocol
- 8.2.1. Wired Protocol
- 8.2.2. Wireless Protocol
- 8.3. Market Analysis, Insights and Forecast - by End-user Industry
- 8.3.1. Chemical and Petrochemical
- 8.3.2. Paper and Pulp
- 8.3.3. Water and Wastewater Treatment
- 8.3.4. Energy and Utilities
- 8.3.5. Oil and Gas
- 8.3.6. Pharmaceutical
- 8.3.7. Food and Beverages
- 8.3.8. Other End-user Industries
- 8.1. Market Analysis, Insights and Forecast - by System Type
- 9. Latin America Process Automation Industry Analysis, Insights and Forecast, 2019-2031
- 9.1. Market Analysis, Insights and Forecast - by System Type
- 9.1.1. Supervisory Control and Data Acquisition (SCADA)
- 9.1.2. Programmable Logic Controller (PLC)
- 9.1.3. Distributed Control System (DCS)
- 9.1.4. Machine Execution System (MES)
- 9.1.5. Valves and Actuators
- 9.1.6. Electric Motors
- 9.1.7. Human Machine Interface (HMI)
- 9.1.8. Process Safety Systems
- 9.1.9. Sensors and Transmitters
- 9.1.10. Other Systems
- 9.2. Market Analysis, Insights and Forecast - by Communication Protocol
- 9.2.1. Wired Protocol
- 9.2.2. Wireless Protocol
- 9.3. Market Analysis, Insights and Forecast - by End-user Industry
- 9.3.1. Chemical and Petrochemical
- 9.3.2. Paper and Pulp
- 9.3.3. Water and Wastewater Treatment
- 9.3.4. Energy and Utilities
- 9.3.5. Oil and Gas
- 9.3.6. Pharmaceutical
- 9.3.7. Food and Beverages
- 9.3.8. Other End-user Industries
- 9.1. Market Analysis, Insights and Forecast - by System Type
- 10. Middle East and Africa Process Automation Industry Analysis, Insights and Forecast, 2019-2031
- 10.1. Market Analysis, Insights and Forecast - by System Type
- 10.1.1. Supervisory Control and Data Acquisition (SCADA)
- 10.1.2. Programmable Logic Controller (PLC)
- 10.1.3. Distributed Control System (DCS)
- 10.1.4. Machine Execution System (MES)
- 10.1.5. Valves and Actuators
- 10.1.6. Electric Motors
- 10.1.7. Human Machine Interface (HMI)
- 10.1.8. Process Safety Systems
- 10.1.9. Sensors and Transmitters
- 10.1.10. Other Systems
- 10.2. Market Analysis, Insights and Forecast - by Communication Protocol
- 10.2.1. Wired Protocol
- 10.2.2. Wireless Protocol
- 10.3. Market Analysis, Insights and Forecast - by End-user Industry
- 10.3.1. Chemical and Petrochemical
- 10.3.2. Paper and Pulp
- 10.3.3. Water and Wastewater Treatment
- 10.3.4. Energy and Utilities
- 10.3.5. Oil and Gas
- 10.3.6. Pharmaceutical
- 10.3.7. Food and Beverages
- 10.3.8. Other End-user Industries
- 10.1. Market Analysis, Insights and Forecast - by System Type
- 11. North America Process Automation Industry Analysis, Insights and Forecast, 2019-2031
- 11.1. Market Analysis, Insights and Forecast - By Country/Sub-region
- 11.1.1 United States
- 11.1.2 Canada
- 11.1.3 Mexico
- 12. Europe Process Automation Industry Analysis, Insights and Forecast, 2019-2031
- 12.1. Market Analysis, Insights and Forecast - By Country/Sub-region
- 12.1.1 Germany
- 12.1.2 United Kingdom
- 12.1.3 France
- 12.1.4 Spain
- 12.1.5 Italy
- 12.1.6 Spain
- 12.1.7 Belgium
- 12.1.8 Netherland
- 12.1.9 Nordics
- 12.1.10 Rest of Europe
- 13. Asia Pacific Process Automation Industry Analysis, Insights and Forecast, 2019-2031
- 13.1. Market Analysis, Insights and Forecast - By Country/Sub-region
- 13.1.1 China
- 13.1.2 Japan
- 13.1.3 India
- 13.1.4 South Korea
- 13.1.5 Southeast Asia
- 13.1.6 Australia
- 13.1.7 Indonesia
- 13.1.8 Phillipes
- 13.1.9 Singapore
- 13.1.10 Thailandc
- 13.1.11 Rest of Asia Pacific
- 14. South America Process Automation Industry Analysis, Insights and Forecast, 2019-2031
- 14.1. Market Analysis, Insights and Forecast - By Country/Sub-region
- 14.1.1 Brazil
- 14.1.2 Argentina
- 14.1.3 Peru
- 14.1.4 Chile
- 14.1.5 Colombia
- 14.1.6 Ecuador
- 14.1.7 Venezuela
- 14.1.8 Rest of South America
- 15. MEA Process Automation Industry Analysis, Insights and Forecast, 2019-2031
- 15.1. Market Analysis, Insights and Forecast - By Country/Sub-region
- 15.1.1 United Arab Emirates
- 15.1.2 Saudi Arabia
- 15.1.3 South Africa
- 15.1.4 Rest of Middle East and Africa
- 16. Competitive Analysis
- 16.1. Global Market Share Analysis 2024
- 16.2. Company Profiles
- 16.2.1 Honeywell International Inc
- 16.2.1.1. Overview
- 16.2.1.2. Products
- 16.2.1.3. SWOT Analysis
- 16.2.1.4. Recent Developments
- 16.2.1.5. Financials (Based on Availability)
- 16.2.2 ABB Ltd
- 16.2.2.1. Overview
- 16.2.2.2. Products
- 16.2.2.3. SWOT Analysis
- 16.2.2.4. Recent Developments
- 16.2.2.5. Financials (Based on Availability)
- 16.2.3 Johnson Controls International PLC
- 16.2.3.1. Overview
- 16.2.3.2. Products
- 16.2.3.3. SWOT Analysis
- 16.2.3.4. Recent Developments
- 16.2.3.5. Financials (Based on Availability)
- 16.2.4 Texas Instruments Inc
- 16.2.4.1. Overview
- 16.2.4.2. Products
- 16.2.4.3. SWOT Analysis
- 16.2.4.4. Recent Developments
- 16.2.4.5. Financials (Based on Availability)
- 16.2.5 Emerson Electric Co
- 16.2.5.1. Overview
- 16.2.5.2. Products
- 16.2.5.3. SWOT Analysis
- 16.2.5.4. Recent Developments
- 16.2.5.5. Financials (Based on Availability)
- 16.2.6 Mitsubishi Electric Corporation
- 16.2.6.1. Overview
- 16.2.6.2. Products
- 16.2.6.3. SWOT Analysis
- 16.2.6.4. Recent Developments
- 16.2.6.5. Financials (Based on Availability)
- 16.2.7 Schneider Electric SE
- 16.2.7.1. Overview
- 16.2.7.2. Products
- 16.2.7.3. SWOT Analysis
- 16.2.7.4. Recent Developments
- 16.2.7.5. Financials (Based on Availability)
- 16.2.8 Eaton Corporation PLC
- 16.2.8.1. Overview
- 16.2.8.2. Products
- 16.2.8.3. SWOT Analysis
- 16.2.8.4. Recent Developments
- 16.2.8.5. Financials (Based on Availability)
- 16.2.9 Siemens Corporation
- 16.2.9.1. Overview
- 16.2.9.2. Products
- 16.2.9.3. SWOT Analysis
- 16.2.9.4. Recent Developments
- 16.2.9.5. Financials (Based on Availability)
- 16.2.10 Rockwell Automation Inc
- 16.2.10.1. Overview
- 16.2.10.2. Products
- 16.2.10.3. SWOT Analysis
- 16.2.10.4. Recent Developments
- 16.2.10.5. Financials (Based on Availability)
- 16.2.11 Bosch Rexroth AG (Robert Bosch GmBH)
- 16.2.11.1. Overview
- 16.2.11.2. Products
- 16.2.11.3. SWOT Analysis
- 16.2.11.4. Recent Developments
- 16.2.11.5. Financials (Based on Availability)
- 16.2.12 Dassault Systemes SE
- 16.2.12.1. Overview
- 16.2.12.2. Products
- 16.2.12.3. SWOT Analysis
- 16.2.12.4. Recent Developments
- 16.2.12.5. Financials (Based on Availability)
- 16.2.13 Yokogawa Electric Corporation
- 16.2.13.1. Overview
- 16.2.13.2. Products
- 16.2.13.3. SWOT Analysis
- 16.2.13.4. Recent Developments
- 16.2.13.5. Financials (Based on Availability)
- 16.2.1 Honeywell International Inc
List of Figures
- Figure 1: Global Process Automation Industry Revenue Breakdown (Million, %) by Region 2024 & 2032
- Figure 2: North America Process Automation Industry Revenue (Million), by Country 2024 & 2032
- Figure 3: North America Process Automation Industry Revenue Share (%), by Country 2024 & 2032
- Figure 4: Europe Process Automation Industry Revenue (Million), by Country 2024 & 2032
- Figure 5: Europe Process Automation Industry Revenue Share (%), by Country 2024 & 2032
- Figure 6: Asia Pacific Process Automation Industry Revenue (Million), by Country 2024 & 2032
- Figure 7: Asia Pacific Process Automation Industry Revenue Share (%), by Country 2024 & 2032
- Figure 8: South America Process Automation Industry Revenue (Million), by Country 2024 & 2032
- Figure 9: South America Process Automation Industry Revenue Share (%), by Country 2024 & 2032
- Figure 10: MEA Process Automation Industry Revenue (Million), by Country 2024 & 2032
- Figure 11: MEA Process Automation Industry Revenue Share (%), by Country 2024 & 2032
- Figure 12: North America Process Automation Industry Revenue (Million), by System Type 2024 & 2032
- Figure 13: North America Process Automation Industry Revenue Share (%), by System Type 2024 & 2032
- Figure 14: North America Process Automation Industry Revenue (Million), by Communication Protocol 2024 & 2032
- Figure 15: North America Process Automation Industry Revenue Share (%), by Communication Protocol 2024 & 2032
- Figure 16: North America Process Automation Industry Revenue (Million), by End-user Industry 2024 & 2032
- Figure 17: North America Process Automation Industry Revenue Share (%), by End-user Industry 2024 & 2032
- Figure 18: North America Process Automation Industry Revenue (Million), by Country 2024 & 2032
- Figure 19: North America Process Automation Industry Revenue Share (%), by Country 2024 & 2032
- Figure 20: Europe Process Automation Industry Revenue (Million), by System Type 2024 & 2032
- Figure 21: Europe Process Automation Industry Revenue Share (%), by System Type 2024 & 2032
- Figure 22: Europe Process Automation Industry Revenue (Million), by Communication Protocol 2024 & 2032
- Figure 23: Europe Process Automation Industry Revenue Share (%), by Communication Protocol 2024 & 2032
- Figure 24: Europe Process Automation Industry Revenue (Million), by End-user Industry 2024 & 2032
- Figure 25: Europe Process Automation Industry Revenue Share (%), by End-user Industry 2024 & 2032
- Figure 26: Europe Process Automation Industry Revenue (Million), by Country 2024 & 2032
- Figure 27: Europe Process Automation Industry Revenue Share (%), by Country 2024 & 2032
- Figure 28: Asia Pacific Process Automation Industry Revenue (Million), by System Type 2024 & 2032
- Figure 29: Asia Pacific Process Automation Industry Revenue Share (%), by System Type 2024 & 2032
- Figure 30: Asia Pacific Process Automation Industry Revenue (Million), by Communication Protocol 2024 & 2032
- Figure 31: Asia Pacific Process Automation Industry Revenue Share (%), by Communication Protocol 2024 & 2032
- Figure 32: Asia Pacific Process Automation Industry Revenue (Million), by End-user Industry 2024 & 2032
- Figure 33: Asia Pacific Process Automation Industry Revenue Share (%), by End-user Industry 2024 & 2032
- Figure 34: Asia Pacific Process Automation Industry Revenue (Million), by Country 2024 & 2032
- Figure 35: Asia Pacific Process Automation Industry Revenue Share (%), by Country 2024 & 2032
- Figure 36: Latin America Process Automation Industry Revenue (Million), by System Type 2024 & 2032
- Figure 37: Latin America Process Automation Industry Revenue Share (%), by System Type 2024 & 2032
- Figure 38: Latin America Process Automation Industry Revenue (Million), by Communication Protocol 2024 & 2032
- Figure 39: Latin America Process Automation Industry Revenue Share (%), by Communication Protocol 2024 & 2032
- Figure 40: Latin America Process Automation Industry Revenue (Million), by End-user Industry 2024 & 2032
- Figure 41: Latin America Process Automation Industry Revenue Share (%), by End-user Industry 2024 & 2032
- Figure 42: Latin America Process Automation Industry Revenue (Million), by Country 2024 & 2032
- Figure 43: Latin America Process Automation Industry Revenue Share (%), by Country 2024 & 2032
- Figure 44: Middle East and Africa Process Automation Industry Revenue (Million), by System Type 2024 & 2032
- Figure 45: Middle East and Africa Process Automation Industry Revenue Share (%), by System Type 2024 & 2032
- Figure 46: Middle East and Africa Process Automation Industry Revenue (Million), by Communication Protocol 2024 & 2032
- Figure 47: Middle East and Africa Process Automation Industry Revenue Share (%), by Communication Protocol 2024 & 2032
- Figure 48: Middle East and Africa Process Automation Industry Revenue (Million), by End-user Industry 2024 & 2032
- Figure 49: Middle East and Africa Process Automation Industry Revenue Share (%), by End-user Industry 2024 & 2032
- Figure 50: Middle East and Africa Process Automation Industry Revenue (Million), by Country 2024 & 2032
- Figure 51: Middle East and Africa Process Automation Industry Revenue Share (%), by Country 2024 & 2032
List of Tables
- Table 1: Global Process Automation Industry Revenue Million Forecast, by Region 2019 & 2032
- Table 2: Global Process Automation Industry Revenue Million Forecast, by System Type 2019 & 2032
- Table 3: Global Process Automation Industry Revenue Million Forecast, by Communication Protocol 2019 & 2032
- Table 4: Global Process Automation Industry Revenue Million Forecast, by End-user Industry 2019 & 2032
- Table 5: Global Process Automation Industry Revenue Million Forecast, by Region 2019 & 2032
- Table 6: Global Process Automation Industry Revenue Million Forecast, by Country 2019 & 2032
- Table 7: United States Process Automation Industry Revenue (Million) Forecast, by Application 2019 & 2032
- Table 8: Canada Process Automation Industry Revenue (Million) Forecast, by Application 2019 & 2032
- Table 9: Mexico Process Automation Industry Revenue (Million) Forecast, by Application 2019 & 2032
- Table 10: Global Process Automation Industry Revenue Million Forecast, by Country 2019 & 2032
- Table 11: Germany Process Automation Industry Revenue (Million) Forecast, by Application 2019 & 2032
- Table 12: United Kingdom Process Automation Industry Revenue (Million) Forecast, by Application 2019 & 2032
- Table 13: France Process Automation Industry Revenue (Million) Forecast, by Application 2019 & 2032
- Table 14: Spain Process Automation Industry Revenue (Million) Forecast, by Application 2019 & 2032
- Table 15: Italy Process Automation Industry Revenue (Million) Forecast, by Application 2019 & 2032
- Table 16: Spain Process Automation Industry Revenue (Million) Forecast, by Application 2019 & 2032
- Table 17: Belgium Process Automation Industry Revenue (Million) Forecast, by Application 2019 & 2032
- Table 18: Netherland Process Automation Industry Revenue (Million) Forecast, by Application 2019 & 2032
- Table 19: Nordics Process Automation Industry Revenue (Million) Forecast, by Application 2019 & 2032
- Table 20: Rest of Europe Process Automation Industry Revenue (Million) Forecast, by Application 2019 & 2032
- Table 21: Global Process Automation Industry Revenue Million Forecast, by Country 2019 & 2032
- Table 22: China Process Automation Industry Revenue (Million) Forecast, by Application 2019 & 2032
- Table 23: Japan Process Automation Industry Revenue (Million) Forecast, by Application 2019 & 2032
- Table 24: India Process Automation Industry Revenue (Million) Forecast, by Application 2019 & 2032
- Table 25: South Korea Process Automation Industry Revenue (Million) Forecast, by Application 2019 & 2032
- Table 26: Southeast Asia Process Automation Industry Revenue (Million) Forecast, by Application 2019 & 2032
- Table 27: Australia Process Automation Industry Revenue (Million) Forecast, by Application 2019 & 2032
- Table 28: Indonesia Process Automation Industry Revenue (Million) Forecast, by Application 2019 & 2032
- Table 29: Phillipes Process Automation Industry Revenue (Million) Forecast, by Application 2019 & 2032
- Table 30: Singapore Process Automation Industry Revenue (Million) Forecast, by Application 2019 & 2032
- Table 31: Thailandc Process Automation Industry Revenue (Million) Forecast, by Application 2019 & 2032
- Table 32: Rest of Asia Pacific Process Automation Industry Revenue (Million) Forecast, by Application 2019 & 2032
- Table 33: Global Process Automation Industry Revenue Million Forecast, by Country 2019 & 2032
- Table 34: Brazil Process Automation Industry Revenue (Million) Forecast, by Application 2019 & 2032
- Table 35: Argentina Process Automation Industry Revenue (Million) Forecast, by Application 2019 & 2032
- Table 36: Peru Process Automation Industry Revenue (Million) Forecast, by Application 2019 & 2032
- Table 37: Chile Process Automation Industry Revenue (Million) Forecast, by Application 2019 & 2032
- Table 38: Colombia Process Automation Industry Revenue (Million) Forecast, by Application 2019 & 2032
- Table 39: Ecuador Process Automation Industry Revenue (Million) Forecast, by Application 2019 & 2032
- Table 40: Venezuela Process Automation Industry Revenue (Million) Forecast, by Application 2019 & 2032
- Table 41: Rest of South America Process Automation Industry Revenue (Million) Forecast, by Application 2019 & 2032
- Table 42: Global Process Automation Industry Revenue Million Forecast, by Country 2019 & 2032
- Table 43: United Arab Emirates Process Automation Industry Revenue (Million) Forecast, by Application 2019 & 2032
- Table 44: Saudi Arabia Process Automation Industry Revenue (Million) Forecast, by Application 2019 & 2032
- Table 45: South Africa Process Automation Industry Revenue (Million) Forecast, by Application 2019 & 2032
- Table 46: Rest of Middle East and Africa Process Automation Industry Revenue (Million) Forecast, by Application 2019 & 2032
- Table 47: Global Process Automation Industry Revenue Million Forecast, by System Type 2019 & 2032
- Table 48: Global Process Automation Industry Revenue Million Forecast, by Communication Protocol 2019 & 2032
- Table 49: Global Process Automation Industry Revenue Million Forecast, by End-user Industry 2019 & 2032
- Table 50: Global Process Automation Industry Revenue Million Forecast, by Country 2019 & 2032
- Table 51: United States Process Automation Industry Revenue (Million) Forecast, by Application 2019 & 2032
- Table 52: Canada Process Automation Industry Revenue (Million) Forecast, by Application 2019 & 2032
- Table 53: Global Process Automation Industry Revenue Million Forecast, by System Type 2019 & 2032
- Table 54: Global Process Automation Industry Revenue Million Forecast, by Communication Protocol 2019 & 2032
- Table 55: Global Process Automation Industry Revenue Million Forecast, by End-user Industry 2019 & 2032
- Table 56: Global Process Automation Industry Revenue Million Forecast, by Country 2019 & 2032
- Table 57: United Kingdom Process Automation Industry Revenue (Million) Forecast, by Application 2019 & 2032
- Table 58: Germany Process Automation Industry Revenue (Million) Forecast, by Application 2019 & 2032
- Table 59: France Process Automation Industry Revenue (Million) Forecast, by Application 2019 & 2032
- Table 60: Rest of Europe Process Automation Industry Revenue (Million) Forecast, by Application 2019 & 2032
- Table 61: Global Process Automation Industry Revenue Million Forecast, by System Type 2019 & 2032
- Table 62: Global Process Automation Industry Revenue Million Forecast, by Communication Protocol 2019 & 2032
- Table 63: Global Process Automation Industry Revenue Million Forecast, by End-user Industry 2019 & 2032
- Table 64: Global Process Automation Industry Revenue Million Forecast, by Country 2019 & 2032
- Table 65: China Process Automation Industry Revenue (Million) Forecast, by Application 2019 & 2032
- Table 66: India Process Automation Industry Revenue (Million) Forecast, by Application 2019 & 2032
- Table 67: Japan Process Automation Industry Revenue (Million) Forecast, by Application 2019 & 2032
- Table 68: Rest of Asia Pacific Process Automation Industry Revenue (Million) Forecast, by Application 2019 & 2032
- Table 69: Global Process Automation Industry Revenue Million Forecast, by System Type 2019 & 2032
- Table 70: Global Process Automation Industry Revenue Million Forecast, by Communication Protocol 2019 & 2032
- Table 71: Global Process Automation Industry Revenue Million Forecast, by End-user Industry 2019 & 2032
- Table 72: Global Process Automation Industry Revenue Million Forecast, by Country 2019 & 2032
- Table 73: Global Process Automation Industry Revenue Million Forecast, by System Type 2019 & 2032
- Table 74: Global Process Automation Industry Revenue Million Forecast, by Communication Protocol 2019 & 2032
- Table 75: Global Process Automation Industry Revenue Million Forecast, by End-user Industry 2019 & 2032
- Table 76: Global Process Automation Industry Revenue Million Forecast, by Country 2019 & 2032
Frequently Asked Questions
1. What is the projected Compound Annual Growth Rate (CAGR) of the Process Automation Industry?
The projected CAGR is approximately 5.82%.
2. Which companies are prominent players in the Process Automation Industry?
Key companies in the market include Honeywell International Inc, ABB Ltd, Johnson Controls International PLC, Texas Instruments Inc, Emerson Electric Co, Mitsubishi Electric Corporation, Schneider Electric SE, Eaton Corporation PLC, Siemens Corporation, Rockwell Automation Inc, Bosch Rexroth AG (Robert Bosch GmBH), Dassault Systemes SE, Yokogawa Electric Corporation.
3. What are the main segments of the Process Automation Industry?
The market segments include System Type, Communication Protocol, End-user Industry.
4. Can you provide details about the market size?
The market size is estimated to be USD 109.77 Million as of 2022.
5. What are some drivers contributing to market growth?
; Rising Adoption of Robotics; Growing Emphasis on Energy Efficiency and Cost Reduction; Emergence of IIoT; Demand for Safety Automation Systems.
6. What are the notable trends driving market growth?
Paper and Pulp Segment is Expected to Register a Significant Growth.
7. Are there any restraints impacting market growth?
High Up-front Installation Costs and Interoperability Issues; Unavailability for Skilled Workforce.
8. Can you provide examples of recent developments in the market?
N/A
9. What pricing options are available for accessing the report?
Pricing options include single-user, multi-user, and enterprise licenses priced at USD 4750, USD 5250, and USD 8750 respectively.
10. Is the market size provided in terms of value or volume?
The market size is provided in terms of value, measured in Million.
11. Are there any specific market keywords associated with the report?
Yes, the market keyword associated with the report is "Process Automation Industry," which aids in identifying and referencing the specific market segment covered.
12. How do I determine which pricing option suits my needs best?
The pricing options vary based on user requirements and access needs. Individual users may opt for single-user licenses, while businesses requiring broader access may choose multi-user or enterprise licenses for cost-effective access to the report.
13. Are there any additional resources or data provided in the Process Automation Industry report?
While the report offers comprehensive insights, it's advisable to review the specific contents or supplementary materials provided to ascertain if additional resources or data are available.
14. How can I stay updated on further developments or reports in the Process Automation Industry?
To stay informed about further developments, trends, and reports in the Process Automation Industry, consider subscribing to industry newsletters, following relevant companies and organizations, or regularly checking reputable industry news sources and publications.
Methodology
Step 1 - Identification of Relevant Samples Size from Population Database


Step 2 - Approaches for Defining Global Market Size (Value, Volume* & Price*)

Note*: In applicable scenarios
Step 3 - Data Sources
Primary Research
- Web Analytics
- Survey Reports
- Research Institute
- Latest Research Reports
- Opinion Leaders
Secondary Research
- Annual Reports
- White Paper
- Latest Press Release
- Industry Association
- Paid Database
- Investor Presentations

Step 4 - Data Triangulation
Involves using different sources of information in order to increase the validity of a study
These sources are likely to be stakeholders in a program - participants, other researchers, program staff, other community members, and so on.
Then we put all data in single framework & apply various statistical tools to find out the dynamic on the market.
During the analysis stage, feedback from the stakeholder groups would be compared to determine areas of agreement as well as areas of divergence
