

Key Insights
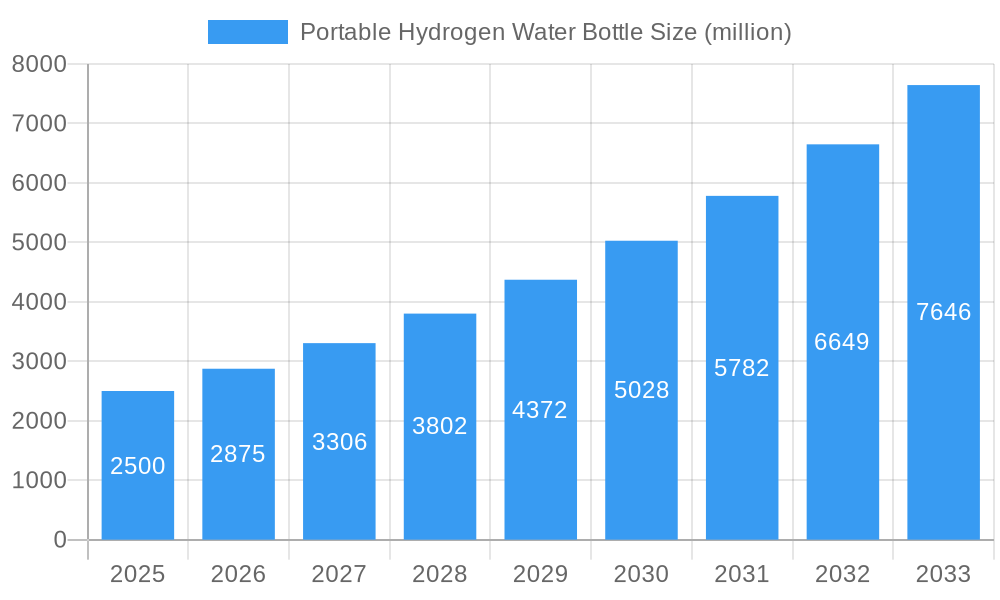
The global Portable Hydrogen Water Bottle market is experiencing robust growth, projected to reach an estimated market size of USD 2.5 billion by 2025 and expand at a Compound Annual Growth Rate (CAGR) of 15% through 2033. This expansion is primarily fueled by increasing consumer awareness regarding the potential health benefits of hydrogen-infused water, such as its antioxidant properties and ability to combat oxidative stress. The convenience and portability offered by these devices, allowing individuals to easily access hydrogen water on the go, are also significant drivers. Furthermore, a growing wellness and fitness trend across developed and emerging economies is creating a fertile ground for the adoption of such health-enhancing products. The market is witnessing a strong preference for bottles with longer runtime capabilities, indicating a demand for more efficient hydrogen generation and sustained infusion.
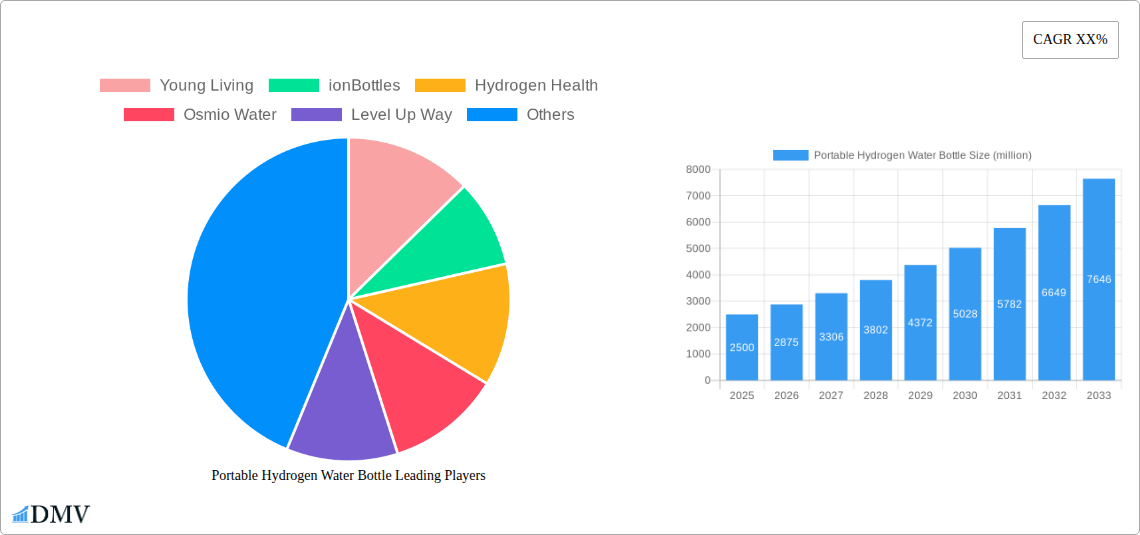
Portable Hydrogen Water Bottle Market Size (In Billion)
The market landscape is characterized by intense competition among established players and emerging innovators, including Young Living, ionBottles, and Hydrogen Health. These companies are actively engaged in product development, focusing on enhanced hydrogen generation efficiency, durable materials, and user-friendly designs. Geographically, North America currently leads the market share, driven by high disposable incomes and a proactive approach to health and wellness. However, the Asia Pacific region is anticipated to exhibit the fastest growth, propelled by rising health consciousness, increasing urbanization, and a growing middle class with a greater propensity to spend on premium health products. While the market shows considerable promise, potential restraints include the relatively high initial cost of premium devices and the need for continued consumer education to fully grasp the long-term benefits and scientific backing of hydrogen water consumption. Online sales channels are demonstrating significant traction, reflecting the broader e-commerce boom and making these innovative products more accessible globally.
Portable Hydrogen Water Bottle Company Market Share
Portable Hydrogen Water Bottle Market Composition & Trends
The global portable hydrogen water bottle market exhibits a dynamic and evolving landscape characterized by increasing innovation and a growing consumer focus on health and wellness. Market concentration is moderately fragmented, with several key players actively vying for market share. Companies like ionBottles, Hydrogen Health, Osmio Water, and Level Up Way are at the forefront, consistently introducing advanced technologies and expanding their product lines. Innovation catalysts include the burgeoning demand for functional beverages, the increasing awareness of molecular hydrogen's potential health benefits, and advancements in electrolysis technology for efficient hydrogen generation. Regulatory landscapes are still forming, with a focus on product safety and efficacy claims, creating both opportunities and challenges for market entrants. Substitute products, such as traditional water filters and other health supplements, offer indirect competition, but the unique selling proposition of portable hydrogen water generation sets it apart. End-user profiles span health-conscious individuals, athletes seeking enhanced recovery, and those exploring preventative health measures. Merger and acquisition (M&A) activities are anticipated to increase as larger health and wellness corporations look to capitalize on this growing segment. We project M&A deal values to reach upwards of $50 million within the forecast period.
- Market Share Distribution: Leading companies hold an estimated 30% of the current market, with significant growth potential for emerging brands.
- M&A Deal Values: Projected to reach $50 million by 2033, indicating consolidation and strategic investments.
- Key Innovation Areas: Enhanced battery life, improved hydrogen infusion rates, and user-friendly interfaces.
- Regulatory Focus: Ensuring compliance with health and safety standards, particularly for devices generating hydrogen for consumption.
Portable Hydrogen Water Bottle Industry Evolution
The portable hydrogen water bottle industry has witnessed a remarkable evolution from its nascent stages to a significant player in the health and wellness technology sector. Over the historical period of 2019–2024, the market has been shaped by increasing consumer awareness regarding the potential therapeutic benefits of molecular hydrogen. Initial adoption was driven by early adopters and the wellness enthusiast community. As research into hydrogen's antioxidant and anti-inflammatory properties gained traction, broader consumer interest began to surge. The study period, 2019–2033, encompasses this critical growth phase. During the base year of 2025, the market is estimated to be valued at approximately $500 million, with a projected compound annual growth rate (CAGR) of 15% for the forecast period of 2025–2033. This robust growth trajectory is underpinned by significant technological advancements. Early models often had limited hydrogen generation capacity and shorter battery life. However, modern portable hydrogen water bottles, particularly those with a Runtime of 10 Minutes, offer more efficient and effective hydrogen infusion. Companies like Gosoit, H2 Life, and Biogenis have been instrumental in pushing these technological boundaries, incorporating advanced SPE (Solid Polymer Electrolyte) and PEM (Proton Exchange Membrane) technologies that ensure water purity and optimize hydrogen gas generation. Shifting consumer demands are also a key driver. Today's consumers are not just looking for hydration but are seeking functional benefits from their water intake. The desire for improved energy levels, enhanced athletic performance, and overall well-being has propelled the demand for portable hydrogen water solutions. The market has seen a rise in product diversification, catering to different user needs, from portable and sleek designs for on-the-go individuals to more robust options for outdoor enthusiasts. The increasing availability of online sales channels has also democratized access to these products, further accelerating industry evolution. Educational content and influencer marketing have played a crucial role in demystifying molecular hydrogen and its applications, leading to greater consumer adoption and market expansion. By 2033, the market is projected to reach a valuation of $1.5 billion, reflecting sustained innovation and growing consumer acceptance. The industry's evolution is a testament to its ability to adapt to scientific discoveries, technological breakthroughs, and the ever-changing preferences of health-conscious consumers.
Leading Regions, Countries, or Segments in Portable Hydrogen Water Bottle
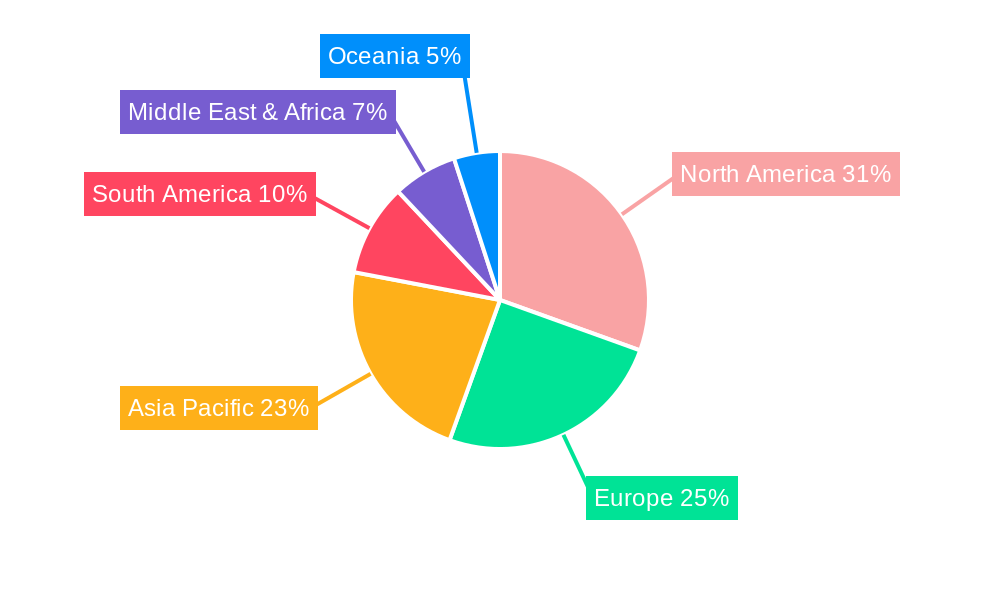
The portable hydrogen water bottle market demonstrates distinct regional leadership and segment dominance, driven by a confluence of factors including consumer health consciousness, disposable income, and market penetration strategies. Among the applications, Online Sales have emerged as the dominant channel, accounting for an estimated 65% of total sales revenue in the base year of 2025. This digital prevalence is fueled by the global reach of e-commerce platforms, the convenience offered to consumers in researching and purchasing products, and the ability of manufacturers and distributors to target specific demographics with greater precision. Companies like PIURIFY and Fossduck have heavily invested in their online presence and direct-to-consumer strategies, leveraging social media marketing and online reviews to build brand awareness and trust. The ease with which consumers can compare features, prices, and read testimonials online makes this segment particularly attractive.
In terms of product types, portable hydrogen water bottles with a Runtime of 10 Minutes are leading the market. This specific operational characteristic offers a balanced approach between efficient hydrogen infusion and reasonable energy consumption, making it practical for everyday use. This runtime typically ensures an optimal concentration of dissolved hydrogen for immediate consumption, catering to the immediate health needs of users. Brands are increasingly highlighting this metric as a key selling point, as it directly relates to the product's efficacy and user experience. The perceived value of achieving therapeutic hydrogen levels within a short infusion period resonates strongly with busy consumers.
Geographically, North America, particularly the United States, has been a frontrunner in adopting portable hydrogen water bottles. This leadership is attributed to a deeply ingrained health and wellness culture, higher disposable incomes, and a proactive approach to adopting new health technologies. Consumer awareness regarding the benefits of antioxidants and hydration is already high, making the introduction of hydrogen-infused water a natural progression. Government initiatives promoting healthy lifestyles and a robust digital infrastructure further bolster online sales in this region. Europe, with countries like Germany and the UK showing significant traction, follows closely. The growing interest in natural health solutions and the presence of established players like MUTOKEJI contributing to market growth. Asia-Pacific, driven by emerging economies like China and South Korea, presents a rapidly expanding market. Increasing disposable incomes, a growing middle class, and a cultural emphasis on health and longevity are fueling demand. The adoption of online sales channels is particularly high in this region, mirroring global trends. Investment trends are robust across all leading regions, with companies continuously pouring capital into research and development, marketing, and expanding distribution networks. Regulatory support, while still evolving, is generally favorable towards health-enhancing products, providing a conducive environment for market expansion.
- Dominant Application: Online Sales, capturing an estimated 65% market share.
- Leading Product Type: Runtime = 10 Minutes, favored for its balance of efficiency and convenience.
- Key Regional Drivers: High health consciousness, disposable income, and digital infrastructure in North America.
- Emerging Market Potential: Rapid growth in Asia-Pacific due to rising incomes and health awareness.
- Investment Trends: Continuous investment in R&D, marketing, and distribution networks across leading regions.
Portable Hydrogen Water Bottle Product Innovations
Portable hydrogen water bottles are experiencing a wave of product innovations focused on enhancing user experience, efficacy, and portability. Key advancements include the integration of advanced SPE/PEM electrolysis technology, ensuring higher hydrogen concentration and purity while preventing ozone and chlorine byproducts. Battery technology has seen significant improvements, leading to longer usage times between charges, with some models offering up to 30 days of use on a single charge. Smart features are also emerging, such as mobile app connectivity for tracking hydrogen infusion levels, personalized hydration goals, and even filter replacement reminders. Materials science plays a crucial role, with the adoption of high-grade, BPA-free plastics, durable borosilicate glass, and stainless steel for increased longevity and aesthetic appeal. Performance metrics like hydrogen saturation levels (e.g., achieving 1000-1500 ppb in a short timeframe) and infusion speed are now key differentiators. The focus is on creating devices that are not only functional but also aesthetically pleasing and easy to integrate into a daily routine, offering a competitive edge in a growing market.
Propelling Factors for Portable Hydrogen Water Growth
Several key growth drivers are propelling the portable hydrogen water bottle market forward. The escalating global health and wellness trend is a primary catalyst, with consumers actively seeking products that enhance their well-being. Growing scientific research and awareness surrounding the potential antioxidant and anti-inflammatory benefits of molecular hydrogen are significantly influencing consumer perception and demand. Technological advancements in electrolysis, leading to more efficient, portable, and user-friendly devices, are making these products more accessible and appealing. Furthermore, the increasing disposable income in various regions allows consumers to invest in premium health-enhancing gadgets. The rise of online retail and social media marketing plays a crucial role in educating consumers and driving product awareness, further accelerating adoption and market growth.
Obstacles in the Portable Hydrogen Water Market
Despite the promising growth, the portable hydrogen water market faces several obstacles. Regulatory uncertainties and a lack of standardized guidelines for health claims associated with hydrogen water can create consumer skepticism and hinder widespread adoption. The relatively high price point of premium hydrogen water bottles, compared to conventional water bottles, can be a significant barrier for price-sensitive consumers. Supply chain disruptions, particularly concerning specialized components for electrolysis technology, can impact production and availability. Intense competition from established beverage companies and other health supplement providers necessitates continuous innovation and effective marketing to maintain market share. Consumer education remains a challenge, as many are still unfamiliar with the concept of hydrogen-infused water and its purported benefits.
Future Opportunities in Portable Hydrogen Water
The future for portable hydrogen water bottles is replete with emerging opportunities. The untapped potential of emerging markets in Asia and Latin America presents a significant avenue for expansion, driven by rising disposable incomes and a growing health consciousness. The development of more affordable product lines could broaden market accessibility. Innovations in battery technology, aiming for even longer life and faster charging, will enhance user convenience. Integrating smart features, such as personalized health tracking and AI-driven hydration recommendations, will further differentiate products and appeal to tech-savvy consumers. Partnerships with wellness influencers, fitness centers, and health practitioners can create new distribution channels and build credibility. Furthermore, exploring new applications for hydrogen-rich water in areas like skincare and pet care could unlock niche market segments.
Major Players in the Portable Hydrogen Water Ecosystem
- Young Living
- ionBottles
- Hydrogen Health
- Osmio Water
- Level Up Way
- Gosoit
- H2 Life
- Biogenis
- PIURIFY
- Fossduck
- MUTOKEJI
- Segway
Key Developments in Portable Hydrogen Water Industry
- 2023: Increased consumer adoption driven by influencer marketing and social media trends.
- 2023: Launch of advanced SPE/PEM technology in multiple product lines, improving hydrogen saturation levels.
- 2022: Rise in online sales channels, accounting for an estimated 60% of market revenue.
- 2021: Growing scientific publications on the health benefits of molecular hydrogen, boosting consumer interest.
- 2020: Market expansion into new geographical regions, particularly in Europe and Asia.
- 2019: Introduction of smart features and app connectivity in high-end models.
Strategic Portable Hydrogen Water Market Forecast
The strategic forecast for the portable hydrogen water market is overwhelmingly positive, driven by the confluence of escalating global health consciousness and continuous technological innovation. The market is poised for robust growth, with significant potential in both established and emerging economies. The increasing scientific validation of molecular hydrogen's health benefits will continue to educate consumers and fuel demand. Advancements in electrolysis technology, leading to more efficient, durable, and user-friendly devices, will further democratize access. The expansion of online sales channels and targeted digital marketing strategies will play a crucial role in reaching a wider audience. Strategic collaborations and potential M&A activities are expected to consolidate the market and drive further innovation, positioning portable hydrogen water bottles as an indispensable tool in the modern health and wellness regimen.
Portable Hydrogen Water Bottle Segmentation
-
1. Application
- 1.1. Online Sales
- 1.2. Offline Sales
-
2. Types
- 2.1. Runtime < 10 Minutes
- 2.2. Runtime >= 10 Minutes
- 2.3. Others
Portable Hydrogen Water Bottle Segmentation By Geography
-
1. North America
- 1.1. United States
- 1.2. Canada
- 1.3. Mexico
-
2. South America
- 2.1. Brazil
- 2.2. Argentina
- 2.3. Rest of South America
-
3. Europe
- 3.1. United Kingdom
- 3.2. Germany
- 3.3. France
- 3.4. Italy
- 3.5. Spain
- 3.6. Russia
- 3.7. Benelux
- 3.8. Nordics
- 3.9. Rest of Europe
-
4. Middle East & Africa
- 4.1. Turkey
- 4.2. Israel
- 4.3. GCC
- 4.4. North Africa
- 4.5. South Africa
- 4.6. Rest of Middle East & Africa
-
5. Asia Pacific
- 5.1. China
- 5.2. India
- 5.3. Japan
- 5.4. South Korea
- 5.5. ASEAN
- 5.6. Oceania
- 5.7. Rest of Asia Pacific
Portable Hydrogen Water Bottle Regional Market Share
Geographic Coverage of Portable Hydrogen Water Bottle
Portable Hydrogen Water Bottle REPORT HIGHLIGHTS
| Aspects | Details |
|---|---|
| Study Period | 2020-2034 |
| Base Year | 2025 |
| Estimated Year | 2026 |
| Forecast Period | 2026-2034 |
| Historical Period | 2020-2025 |
| Growth Rate | CAGR of XX% from 2020-2034 |
| Segmentation |
|
Table of Contents
- 1. Introduction
- 1.1. Research Scope
- 1.2. Market Segmentation
- 1.3. Research Methodology
- 1.4. Definitions and Assumptions
- 2. Executive Summary
- 2.1. Introduction
- 3. Market Dynamics
- 3.1. Introduction
- 3.2. Market Drivers
- 3.3. Market Restrains
- 3.4. Market Trends
- 4. Market Factor Analysis
- 4.1. Porters Five Forces
- 4.2. Supply/Value Chain
- 4.3. PESTEL analysis
- 4.4. Market Entropy
- 4.5. Patent/Trademark Analysis
- 5. Global Portable Hydrogen Water Bottle Analysis, Insights and Forecast, 2020-2032
- 5.1. Market Analysis, Insights and Forecast - by Application
- 5.1.1. Online Sales
- 5.1.2. Offline Sales
- 5.2. Market Analysis, Insights and Forecast - by Types
- 5.2.1. Runtime < 10 Minutes
- 5.2.2. Runtime >= 10 Minutes
- 5.2.3. Others
- 5.3. Market Analysis, Insights and Forecast - by Region
- 5.3.1. North America
- 5.3.2. South America
- 5.3.3. Europe
- 5.3.4. Middle East & Africa
- 5.3.5. Asia Pacific
- 5.1. Market Analysis, Insights and Forecast - by Application
- 6. North America Portable Hydrogen Water Bottle Analysis, Insights and Forecast, 2020-2032
- 6.1. Market Analysis, Insights and Forecast - by Application
- 6.1.1. Online Sales
- 6.1.2. Offline Sales
- 6.2. Market Analysis, Insights and Forecast - by Types
- 6.2.1. Runtime < 10 Minutes
- 6.2.2. Runtime >= 10 Minutes
- 6.2.3. Others
- 6.1. Market Analysis, Insights and Forecast - by Application
- 7. South America Portable Hydrogen Water Bottle Analysis, Insights and Forecast, 2020-2032
- 7.1. Market Analysis, Insights and Forecast - by Application
- 7.1.1. Online Sales
- 7.1.2. Offline Sales
- 7.2. Market Analysis, Insights and Forecast - by Types
- 7.2.1. Runtime < 10 Minutes
- 7.2.2. Runtime >= 10 Minutes
- 7.2.3. Others
- 7.1. Market Analysis, Insights and Forecast - by Application
- 8. Europe Portable Hydrogen Water Bottle Analysis, Insights and Forecast, 2020-2032
- 8.1. Market Analysis, Insights and Forecast - by Application
- 8.1.1. Online Sales
- 8.1.2. Offline Sales
- 8.2. Market Analysis, Insights and Forecast - by Types
- 8.2.1. Runtime < 10 Minutes
- 8.2.2. Runtime >= 10 Minutes
- 8.2.3. Others
- 8.1. Market Analysis, Insights and Forecast - by Application
- 9. Middle East & Africa Portable Hydrogen Water Bottle Analysis, Insights and Forecast, 2020-2032
- 9.1. Market Analysis, Insights and Forecast - by Application
- 9.1.1. Online Sales
- 9.1.2. Offline Sales
- 9.2. Market Analysis, Insights and Forecast - by Types
- 9.2.1. Runtime < 10 Minutes
- 9.2.2. Runtime >= 10 Minutes
- 9.2.3. Others
- 9.1. Market Analysis, Insights and Forecast - by Application
- 10. Asia Pacific Portable Hydrogen Water Bottle Analysis, Insights and Forecast, 2020-2032
- 10.1. Market Analysis, Insights and Forecast - by Application
- 10.1.1. Online Sales
- 10.1.2. Offline Sales
- 10.2. Market Analysis, Insights and Forecast - by Types
- 10.2.1. Runtime < 10 Minutes
- 10.2.2. Runtime >= 10 Minutes
- 10.2.3. Others
- 10.1. Market Analysis, Insights and Forecast - by Application
- 11. Competitive Analysis
- 11.1. Global Market Share Analysis 2025
- 11.2. Company Profiles
- 11.2.1 Young Living
- 11.2.1.1. Overview
- 11.2.1.2. Products
- 11.2.1.3. SWOT Analysis
- 11.2.1.4. Recent Developments
- 11.2.1.5. Financials (Based on Availability)
- 11.2.2 ionBottles
- 11.2.2.1. Overview
- 11.2.2.2. Products
- 11.2.2.3. SWOT Analysis
- 11.2.2.4. Recent Developments
- 11.2.2.5. Financials (Based on Availability)
- 11.2.3 Hydrogen Health
- 11.2.3.1. Overview
- 11.2.3.2. Products
- 11.2.3.3. SWOT Analysis
- 11.2.3.4. Recent Developments
- 11.2.3.5. Financials (Based on Availability)
- 11.2.4 Osmio Water
- 11.2.4.1. Overview
- 11.2.4.2. Products
- 11.2.4.3. SWOT Analysis
- 11.2.4.4. Recent Developments
- 11.2.4.5. Financials (Based on Availability)
- 11.2.5 Level Up Way
- 11.2.5.1. Overview
- 11.2.5.2. Products
- 11.2.5.3. SWOT Analysis
- 11.2.5.4. Recent Developments
- 11.2.5.5. Financials (Based on Availability)
- 11.2.6 Gosoit
- 11.2.6.1. Overview
- 11.2.6.2. Products
- 11.2.6.3. SWOT Analysis
- 11.2.6.4. Recent Developments
- 11.2.6.5. Financials (Based on Availability)
- 11.2.7 H2 Life
- 11.2.7.1. Overview
- 11.2.7.2. Products
- 11.2.7.3. SWOT Analysis
- 11.2.7.4. Recent Developments
- 11.2.7.5. Financials (Based on Availability)
- 11.2.8 Biogenis
- 11.2.8.1. Overview
- 11.2.8.2. Products
- 11.2.8.3. SWOT Analysis
- 11.2.8.4. Recent Developments
- 11.2.8.5. Financials (Based on Availability)
- 11.2.9 PIURIFY
- 11.2.9.1. Overview
- 11.2.9.2. Products
- 11.2.9.3. SWOT Analysis
- 11.2.9.4. Recent Developments
- 11.2.9.5. Financials (Based on Availability)
- 11.2.10 Fossduck
- 11.2.10.1. Overview
- 11.2.10.2. Products
- 11.2.10.3. SWOT Analysis
- 11.2.10.4. Recent Developments
- 11.2.10.5. Financials (Based on Availability)
- 11.2.11 MUTOKEJI
- 11.2.11.1. Overview
- 11.2.11.2. Products
- 11.2.11.3. SWOT Analysis
- 11.2.11.4. Recent Developments
- 11.2.11.5. Financials (Based on Availability)
- 11.2.1 Young Living
List of Figures
- Figure 1: Global Portable Hydrogen Water Bottle Revenue Breakdown (million, %) by Region 2025 & 2033
- Figure 2: Global Portable Hydrogen Water Bottle Volume Breakdown (K, %) by Region 2025 & 2033
- Figure 3: North America Portable Hydrogen Water Bottle Revenue (million), by Application 2025 & 2033
- Figure 4: North America Portable Hydrogen Water Bottle Volume (K), by Application 2025 & 2033
- Figure 5: North America Portable Hydrogen Water Bottle Revenue Share (%), by Application 2025 & 2033
- Figure 6: North America Portable Hydrogen Water Bottle Volume Share (%), by Application 2025 & 2033
- Figure 7: North America Portable Hydrogen Water Bottle Revenue (million), by Types 2025 & 2033
- Figure 8: North America Portable Hydrogen Water Bottle Volume (K), by Types 2025 & 2033
- Figure 9: North America Portable Hydrogen Water Bottle Revenue Share (%), by Types 2025 & 2033
- Figure 10: North America Portable Hydrogen Water Bottle Volume Share (%), by Types 2025 & 2033
- Figure 11: North America Portable Hydrogen Water Bottle Revenue (million), by Country 2025 & 2033
- Figure 12: North America Portable Hydrogen Water Bottle Volume (K), by Country 2025 & 2033
- Figure 13: North America Portable Hydrogen Water Bottle Revenue Share (%), by Country 2025 & 2033
- Figure 14: North America Portable Hydrogen Water Bottle Volume Share (%), by Country 2025 & 2033
- Figure 15: South America Portable Hydrogen Water Bottle Revenue (million), by Application 2025 & 2033
- Figure 16: South America Portable Hydrogen Water Bottle Volume (K), by Application 2025 & 2033
- Figure 17: South America Portable Hydrogen Water Bottle Revenue Share (%), by Application 2025 & 2033
- Figure 18: South America Portable Hydrogen Water Bottle Volume Share (%), by Application 2025 & 2033
- Figure 19: South America Portable Hydrogen Water Bottle Revenue (million), by Types 2025 & 2033
- Figure 20: South America Portable Hydrogen Water Bottle Volume (K), by Types 2025 & 2033
- Figure 21: South America Portable Hydrogen Water Bottle Revenue Share (%), by Types 2025 & 2033
- Figure 22: South America Portable Hydrogen Water Bottle Volume Share (%), by Types 2025 & 2033
- Figure 23: South America Portable Hydrogen Water Bottle Revenue (million), by Country 2025 & 2033
- Figure 24: South America Portable Hydrogen Water Bottle Volume (K), by Country 2025 & 2033
- Figure 25: South America Portable Hydrogen Water Bottle Revenue Share (%), by Country 2025 & 2033
- Figure 26: South America Portable Hydrogen Water Bottle Volume Share (%), by Country 2025 & 2033
- Figure 27: Europe Portable Hydrogen Water Bottle Revenue (million), by Application 2025 & 2033
- Figure 28: Europe Portable Hydrogen Water Bottle Volume (K), by Application 2025 & 2033
- Figure 29: Europe Portable Hydrogen Water Bottle Revenue Share (%), by Application 2025 & 2033
- Figure 30: Europe Portable Hydrogen Water Bottle Volume Share (%), by Application 2025 & 2033
- Figure 31: Europe Portable Hydrogen Water Bottle Revenue (million), by Types 2025 & 2033
- Figure 32: Europe Portable Hydrogen Water Bottle Volume (K), by Types 2025 & 2033
- Figure 33: Europe Portable Hydrogen Water Bottle Revenue Share (%), by Types 2025 & 2033
- Figure 34: Europe Portable Hydrogen Water Bottle Volume Share (%), by Types 2025 & 2033
- Figure 35: Europe Portable Hydrogen Water Bottle Revenue (million), by Country 2025 & 2033
- Figure 36: Europe Portable Hydrogen Water Bottle Volume (K), by Country 2025 & 2033
- Figure 37: Europe Portable Hydrogen Water Bottle Revenue Share (%), by Country 2025 & 2033
- Figure 38: Europe Portable Hydrogen Water Bottle Volume Share (%), by Country 2025 & 2033
- Figure 39: Middle East & Africa Portable Hydrogen Water Bottle Revenue (million), by Application 2025 & 2033
- Figure 40: Middle East & Africa Portable Hydrogen Water Bottle Volume (K), by Application 2025 & 2033
- Figure 41: Middle East & Africa Portable Hydrogen Water Bottle Revenue Share (%), by Application 2025 & 2033
- Figure 42: Middle East & Africa Portable Hydrogen Water Bottle Volume Share (%), by Application 2025 & 2033
- Figure 43: Middle East & Africa Portable Hydrogen Water Bottle Revenue (million), by Types 2025 & 2033
- Figure 44: Middle East & Africa Portable Hydrogen Water Bottle Volume (K), by Types 2025 & 2033
- Figure 45: Middle East & Africa Portable Hydrogen Water Bottle Revenue Share (%), by Types 2025 & 2033
- Figure 46: Middle East & Africa Portable Hydrogen Water Bottle Volume Share (%), by Types 2025 & 2033
- Figure 47: Middle East & Africa Portable Hydrogen Water Bottle Revenue (million), by Country 2025 & 2033
- Figure 48: Middle East & Africa Portable Hydrogen Water Bottle Volume (K), by Country 2025 & 2033
- Figure 49: Middle East & Africa Portable Hydrogen Water Bottle Revenue Share (%), by Country 2025 & 2033
- Figure 50: Middle East & Africa Portable Hydrogen Water Bottle Volume Share (%), by Country 2025 & 2033
- Figure 51: Asia Pacific Portable Hydrogen Water Bottle Revenue (million), by Application 2025 & 2033
- Figure 52: Asia Pacific Portable Hydrogen Water Bottle Volume (K), by Application 2025 & 2033
- Figure 53: Asia Pacific Portable Hydrogen Water Bottle Revenue Share (%), by Application 2025 & 2033
- Figure 54: Asia Pacific Portable Hydrogen Water Bottle Volume Share (%), by Application 2025 & 2033
- Figure 55: Asia Pacific Portable Hydrogen Water Bottle Revenue (million), by Types 2025 & 2033
- Figure 56: Asia Pacific Portable Hydrogen Water Bottle Volume (K), by Types 2025 & 2033
- Figure 57: Asia Pacific Portable Hydrogen Water Bottle Revenue Share (%), by Types 2025 & 2033
- Figure 58: Asia Pacific Portable Hydrogen Water Bottle Volume Share (%), by Types 2025 & 2033
- Figure 59: Asia Pacific Portable Hydrogen Water Bottle Revenue (million), by Country 2025 & 2033
- Figure 60: Asia Pacific Portable Hydrogen Water Bottle Volume (K), by Country 2025 & 2033
- Figure 61: Asia Pacific Portable Hydrogen Water Bottle Revenue Share (%), by Country 2025 & 2033
- Figure 62: Asia Pacific Portable Hydrogen Water Bottle Volume Share (%), by Country 2025 & 2033
List of Tables
- Table 1: Global Portable Hydrogen Water Bottle Revenue million Forecast, by Application 2020 & 2033
- Table 2: Global Portable Hydrogen Water Bottle Volume K Forecast, by Application 2020 & 2033
- Table 3: Global Portable Hydrogen Water Bottle Revenue million Forecast, by Types 2020 & 2033
- Table 4: Global Portable Hydrogen Water Bottle Volume K Forecast, by Types 2020 & 2033
- Table 5: Global Portable Hydrogen Water Bottle Revenue million Forecast, by Region 2020 & 2033
- Table 6: Global Portable Hydrogen Water Bottle Volume K Forecast, by Region 2020 & 2033
- Table 7: Global Portable Hydrogen Water Bottle Revenue million Forecast, by Application 2020 & 2033
- Table 8: Global Portable Hydrogen Water Bottle Volume K Forecast, by Application 2020 & 2033
- Table 9: Global Portable Hydrogen Water Bottle Revenue million Forecast, by Types 2020 & 2033
- Table 10: Global Portable Hydrogen Water Bottle Volume K Forecast, by Types 2020 & 2033
- Table 11: Global Portable Hydrogen Water Bottle Revenue million Forecast, by Country 2020 & 2033
- Table 12: Global Portable Hydrogen Water Bottle Volume K Forecast, by Country 2020 & 2033
- Table 13: United States Portable Hydrogen Water Bottle Revenue (million) Forecast, by Application 2020 & 2033
- Table 14: United States Portable Hydrogen Water Bottle Volume (K) Forecast, by Application 2020 & 2033
- Table 15: Canada Portable Hydrogen Water Bottle Revenue (million) Forecast, by Application 2020 & 2033
- Table 16: Canada Portable Hydrogen Water Bottle Volume (K) Forecast, by Application 2020 & 2033
- Table 17: Mexico Portable Hydrogen Water Bottle Revenue (million) Forecast, by Application 2020 & 2033
- Table 18: Mexico Portable Hydrogen Water Bottle Volume (K) Forecast, by Application 2020 & 2033
- Table 19: Global Portable Hydrogen Water Bottle Revenue million Forecast, by Application 2020 & 2033
- Table 20: Global Portable Hydrogen Water Bottle Volume K Forecast, by Application 2020 & 2033
- Table 21: Global Portable Hydrogen Water Bottle Revenue million Forecast, by Types 2020 & 2033
- Table 22: Global Portable Hydrogen Water Bottle Volume K Forecast, by Types 2020 & 2033
- Table 23: Global Portable Hydrogen Water Bottle Revenue million Forecast, by Country 2020 & 2033
- Table 24: Global Portable Hydrogen Water Bottle Volume K Forecast, by Country 2020 & 2033
- Table 25: Brazil Portable Hydrogen Water Bottle Revenue (million) Forecast, by Application 2020 & 2033
- Table 26: Brazil Portable Hydrogen Water Bottle Volume (K) Forecast, by Application 2020 & 2033
- Table 27: Argentina Portable Hydrogen Water Bottle Revenue (million) Forecast, by Application 2020 & 2033
- Table 28: Argentina Portable Hydrogen Water Bottle Volume (K) Forecast, by Application 2020 & 2033
- Table 29: Rest of South America Portable Hydrogen Water Bottle Revenue (million) Forecast, by Application 2020 & 2033
- Table 30: Rest of South America Portable Hydrogen Water Bottle Volume (K) Forecast, by Application 2020 & 2033
- Table 31: Global Portable Hydrogen Water Bottle Revenue million Forecast, by Application 2020 & 2033
- Table 32: Global Portable Hydrogen Water Bottle Volume K Forecast, by Application 2020 & 2033
- Table 33: Global Portable Hydrogen Water Bottle Revenue million Forecast, by Types 2020 & 2033
- Table 34: Global Portable Hydrogen Water Bottle Volume K Forecast, by Types 2020 & 2033
- Table 35: Global Portable Hydrogen Water Bottle Revenue million Forecast, by Country 2020 & 2033
- Table 36: Global Portable Hydrogen Water Bottle Volume K Forecast, by Country 2020 & 2033
- Table 37: United Kingdom Portable Hydrogen Water Bottle Revenue (million) Forecast, by Application 2020 & 2033
- Table 38: United Kingdom Portable Hydrogen Water Bottle Volume (K) Forecast, by Application 2020 & 2033
- Table 39: Germany Portable Hydrogen Water Bottle Revenue (million) Forecast, by Application 2020 & 2033
- Table 40: Germany Portable Hydrogen Water Bottle Volume (K) Forecast, by Application 2020 & 2033
- Table 41: France Portable Hydrogen Water Bottle Revenue (million) Forecast, by Application 2020 & 2033
- Table 42: France Portable Hydrogen Water Bottle Volume (K) Forecast, by Application 2020 & 2033
- Table 43: Italy Portable Hydrogen Water Bottle Revenue (million) Forecast, by Application 2020 & 2033
- Table 44: Italy Portable Hydrogen Water Bottle Volume (K) Forecast, by Application 2020 & 2033
- Table 45: Spain Portable Hydrogen Water Bottle Revenue (million) Forecast, by Application 2020 & 2033
- Table 46: Spain Portable Hydrogen Water Bottle Volume (K) Forecast, by Application 2020 & 2033
- Table 47: Russia Portable Hydrogen Water Bottle Revenue (million) Forecast, by Application 2020 & 2033
- Table 48: Russia Portable Hydrogen Water Bottle Volume (K) Forecast, by Application 2020 & 2033
- Table 49: Benelux Portable Hydrogen Water Bottle Revenue (million) Forecast, by Application 2020 & 2033
- Table 50: Benelux Portable Hydrogen Water Bottle Volume (K) Forecast, by Application 2020 & 2033
- Table 51: Nordics Portable Hydrogen Water Bottle Revenue (million) Forecast, by Application 2020 & 2033
- Table 52: Nordics Portable Hydrogen Water Bottle Volume (K) Forecast, by Application 2020 & 2033
- Table 53: Rest of Europe Portable Hydrogen Water Bottle Revenue (million) Forecast, by Application 2020 & 2033
- Table 54: Rest of Europe Portable Hydrogen Water Bottle Volume (K) Forecast, by Application 2020 & 2033
- Table 55: Global Portable Hydrogen Water Bottle Revenue million Forecast, by Application 2020 & 2033
- Table 56: Global Portable Hydrogen Water Bottle Volume K Forecast, by Application 2020 & 2033
- Table 57: Global Portable Hydrogen Water Bottle Revenue million Forecast, by Types 2020 & 2033
- Table 58: Global Portable Hydrogen Water Bottle Volume K Forecast, by Types 2020 & 2033
- Table 59: Global Portable Hydrogen Water Bottle Revenue million Forecast, by Country 2020 & 2033
- Table 60: Global Portable Hydrogen Water Bottle Volume K Forecast, by Country 2020 & 2033
- Table 61: Turkey Portable Hydrogen Water Bottle Revenue (million) Forecast, by Application 2020 & 2033
- Table 62: Turkey Portable Hydrogen Water Bottle Volume (K) Forecast, by Application 2020 & 2033
- Table 63: Israel Portable Hydrogen Water Bottle Revenue (million) Forecast, by Application 2020 & 2033
- Table 64: Israel Portable Hydrogen Water Bottle Volume (K) Forecast, by Application 2020 & 2033
- Table 65: GCC Portable Hydrogen Water Bottle Revenue (million) Forecast, by Application 2020 & 2033
- Table 66: GCC Portable Hydrogen Water Bottle Volume (K) Forecast, by Application 2020 & 2033
- Table 67: North Africa Portable Hydrogen Water Bottle Revenue (million) Forecast, by Application 2020 & 2033
- Table 68: North Africa Portable Hydrogen Water Bottle Volume (K) Forecast, by Application 2020 & 2033
- Table 69: South Africa Portable Hydrogen Water Bottle Revenue (million) Forecast, by Application 2020 & 2033
- Table 70: South Africa Portable Hydrogen Water Bottle Volume (K) Forecast, by Application 2020 & 2033
- Table 71: Rest of Middle East & Africa Portable Hydrogen Water Bottle Revenue (million) Forecast, by Application 2020 & 2033
- Table 72: Rest of Middle East & Africa Portable Hydrogen Water Bottle Volume (K) Forecast, by Application 2020 & 2033
- Table 73: Global Portable Hydrogen Water Bottle Revenue million Forecast, by Application 2020 & 2033
- Table 74: Global Portable Hydrogen Water Bottle Volume K Forecast, by Application 2020 & 2033
- Table 75: Global Portable Hydrogen Water Bottle Revenue million Forecast, by Types 2020 & 2033
- Table 76: Global Portable Hydrogen Water Bottle Volume K Forecast, by Types 2020 & 2033
- Table 77: Global Portable Hydrogen Water Bottle Revenue million Forecast, by Country 2020 & 2033
- Table 78: Global Portable Hydrogen Water Bottle Volume K Forecast, by Country 2020 & 2033
- Table 79: China Portable Hydrogen Water Bottle Revenue (million) Forecast, by Application 2020 & 2033
- Table 80: China Portable Hydrogen Water Bottle Volume (K) Forecast, by Application 2020 & 2033
- Table 81: India Portable Hydrogen Water Bottle Revenue (million) Forecast, by Application 2020 & 2033
- Table 82: India Portable Hydrogen Water Bottle Volume (K) Forecast, by Application 2020 & 2033
- Table 83: Japan Portable Hydrogen Water Bottle Revenue (million) Forecast, by Application 2020 & 2033
- Table 84: Japan Portable Hydrogen Water Bottle Volume (K) Forecast, by Application 2020 & 2033
- Table 85: South Korea Portable Hydrogen Water Bottle Revenue (million) Forecast, by Application 2020 & 2033
- Table 86: South Korea Portable Hydrogen Water Bottle Volume (K) Forecast, by Application 2020 & 2033
- Table 87: ASEAN Portable Hydrogen Water Bottle Revenue (million) Forecast, by Application 2020 & 2033
- Table 88: ASEAN Portable Hydrogen Water Bottle Volume (K) Forecast, by Application 2020 & 2033
- Table 89: Oceania Portable Hydrogen Water Bottle Revenue (million) Forecast, by Application 2020 & 2033
- Table 90: Oceania Portable Hydrogen Water Bottle Volume (K) Forecast, by Application 2020 & 2033
- Table 91: Rest of Asia Pacific Portable Hydrogen Water Bottle Revenue (million) Forecast, by Application 2020 & 2033
- Table 92: Rest of Asia Pacific Portable Hydrogen Water Bottle Volume (K) Forecast, by Application 2020 & 2033
Frequently Asked Questions
1. What is the projected Compound Annual Growth Rate (CAGR) of the Portable Hydrogen Water Bottle?
The projected CAGR is approximately XX%.
2. Which companies are prominent players in the Portable Hydrogen Water Bottle?
Key companies in the market include Young Living, ionBottles, Hydrogen Health, Osmio Water, Level Up Way, Gosoit, H2 Life, Biogenis, PIURIFY, Fossduck, MUTOKEJI.
3. What are the main segments of the Portable Hydrogen Water Bottle?
The market segments include Application, Types.
4. Can you provide details about the market size?
The market size is estimated to be USD XXX million as of 2022.
5. What are some drivers contributing to market growth?
N/A
6. What are the notable trends driving market growth?
N/A
7. Are there any restraints impacting market growth?
N/A
8. Can you provide examples of recent developments in the market?
N/A
9. What pricing options are available for accessing the report?
Pricing options include single-user, multi-user, and enterprise licenses priced at USD 3950.00, USD 5925.00, and USD 7900.00 respectively.
10. Is the market size provided in terms of value or volume?
The market size is provided in terms of value, measured in million and volume, measured in K.
11. Are there any specific market keywords associated with the report?
Yes, the market keyword associated with the report is "Portable Hydrogen Water Bottle," which aids in identifying and referencing the specific market segment covered.
12. How do I determine which pricing option suits my needs best?
The pricing options vary based on user requirements and access needs. Individual users may opt for single-user licenses, while businesses requiring broader access may choose multi-user or enterprise licenses for cost-effective access to the report.
13. Are there any additional resources or data provided in the Portable Hydrogen Water Bottle report?
While the report offers comprehensive insights, it's advisable to review the specific contents or supplementary materials provided to ascertain if additional resources or data are available.
14. How can I stay updated on further developments or reports in the Portable Hydrogen Water Bottle?
To stay informed about further developments, trends, and reports in the Portable Hydrogen Water Bottle, consider subscribing to industry newsletters, following relevant companies and organizations, or regularly checking reputable industry news sources and publications.
Methodology
Step 1 - Identification of Relevant Samples Size from Population Database


Step 2 - Approaches for Defining Global Market Size (Value, Volume* & Price*)

Note*: In applicable scenarios
Step 3 - Data Sources
Primary Research
- Web Analytics
- Survey Reports
- Research Institute
- Latest Research Reports
- Opinion Leaders
Secondary Research
- Annual Reports
- White Paper
- Latest Press Release
- Industry Association
- Paid Database
- Investor Presentations

Step 4 - Data Triangulation
Involves using different sources of information in order to increase the validity of a study
These sources are likely to be stakeholders in a program - participants, other researchers, program staff, other community members, and so on.
Then we put all data in single framework & apply various statistical tools to find out the dynamic on the market.
During the analysis stage, feedback from the stakeholder groups would be compared to determine areas of agreement as well as areas of divergence