

Key Insights
The global pop-up power outlet market is projected for robust expansion, driven by the increasing need for adaptable and space-efficient power solutions across various sectors. Key growth drivers include the widespread adoption of smart home technologies, the rising popularity of ergonomic workspace designs, and the demand for accessible power in public areas such as airports and cafes. The market is segmented by product type (USB-only, USB and AC combinations, wireless charging), installation (desk, floor, wall), and application (residential, commercial, industrial). Manufacturers are prioritizing innovation, integrating features like USB-C ports, rapid charging, and refined aesthetics to meet evolving consumer expectations. The competitive landscape features established players like Legrand, Hubbell, and Leviton Manufacturing, alongside emerging Asian competitors. Future market growth is anticipated to be further boosted by advancements in wireless charging and the integration of pop-up power outlets into furniture and built-in fixtures. The commercial sector, especially offices and retail environments, is expected to see significant growth due to the demand for flexible power solutions in dynamic workspaces. Challenges include potential fluctuations in raw material costs and the risk of technological obsolescence. To counter these, manufacturers are investing in efficient, smart-home-integrated designs. North America and Europe currently hold substantial market shares, while the Asia-Pacific region is expected to experience considerable growth driven by urbanization and infrastructure development. The market size is estimated at 500 million in the base year 2025, with an anticipated Compound Annual Growth Rate (CAGR) of 8%.
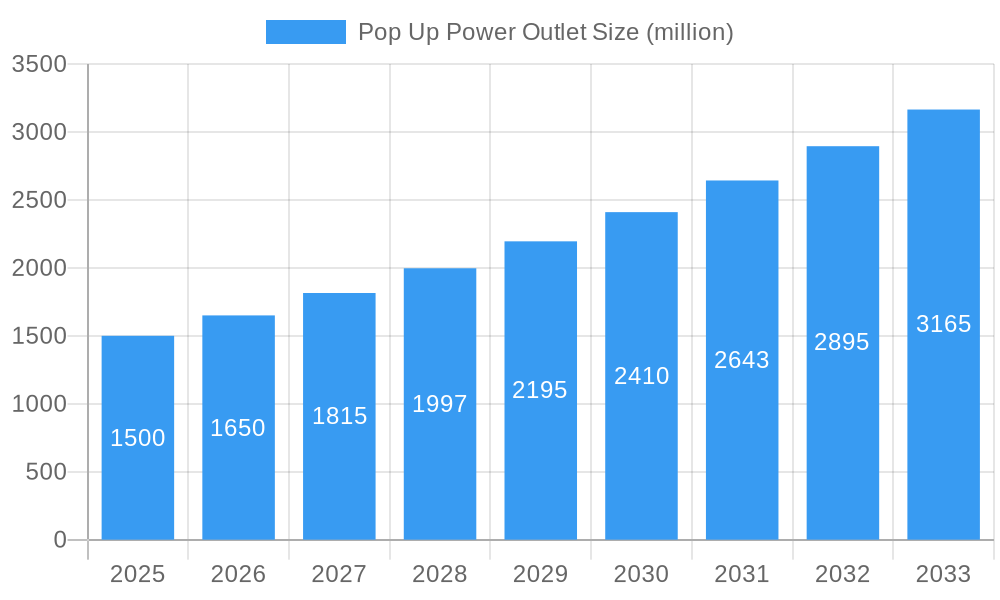
Pop Up Power Outlet Market Size (In Million)
Pop Up Power Outlet Market Report: A Comprehensive Analysis (2019-2033)
This insightful report provides a comprehensive analysis of the global Pop Up Power Outlet market, projecting a multi-million dollar market valuation by 2033. The study period spans from 2019 to 2033, with 2025 serving as both the base and estimated year. This detailed forecast (2025-2033) builds upon historical data (2019-2024) to deliver actionable intelligence for stakeholders. Key players like Legrand, Hubbell, and Leviton Manufacturing are analyzed, alongside emerging competitors, to understand market dynamics and future growth potential. The report uses both quantitative data and qualitative analysis to offer a robust overview of the Pop Up Power Outlet market landscape.
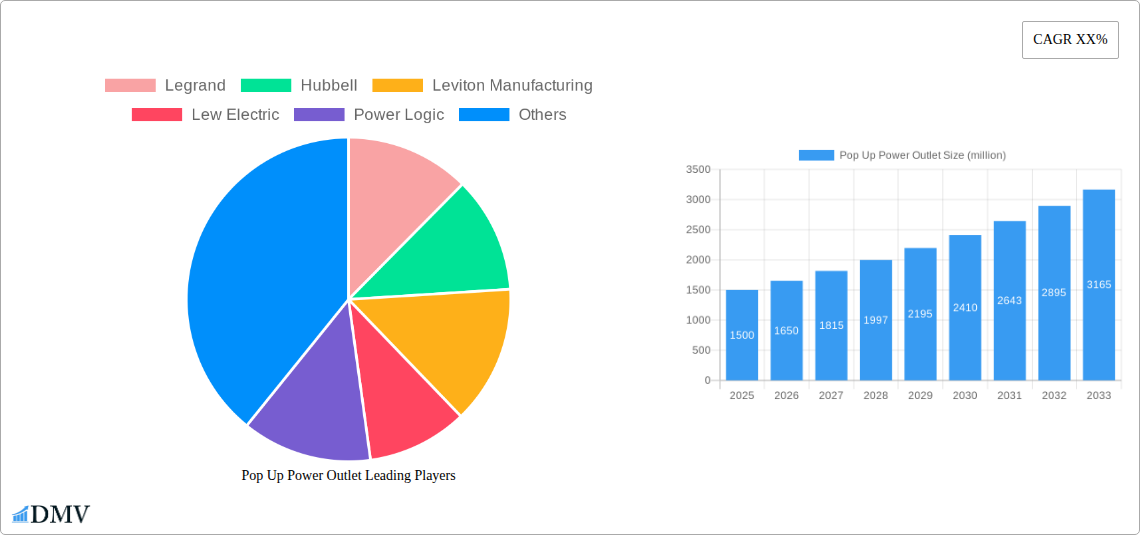
Pop Up Power Outlet Company Market Share
Pop Up Power Outlet Market Composition & Trends
This section delves into the competitive landscape of the pop-up power outlet market, examining market concentration, innovation drivers, regulatory influences, substitute products, end-user profiles, and mergers & acquisitions (M&A) activities. The market is characterized by a moderately concentrated structure, with a few major players commanding significant market share. Legrand, Hubbell, and Leviton Manufacturing hold collectively xx% of the global market share in 2025, while other significant players such as Clipsal (Schneider Electric), Mockett, and Point Pod contribute to the remaining share.
- Market Share Distribution (2025): Legrand (xx%), Hubbell (xx%), Leviton Manufacturing (xx%), Others (xx%).
- Innovation Catalysts: Increasing demand for flexible workspace solutions and aesthetically pleasing power solutions is driving innovation in design and functionality.
- Regulatory Landscape: Regulations concerning energy efficiency and safety standards influence product design and manufacturing.
- Substitute Products: Traditional power outlets and integrated power strips remain primary substitutes.
- End-User Profiles: The primary end users include residential, commercial, and industrial sectors, with the commercial segment projected to experience significant growth.
- M&A Activities: In the period 2019-2024, an estimated xx million dollars were invested in M&A deals within the pop-up power outlet industry, primarily focused on technology integration and market expansion. Further significant acquisitions are anticipated during the forecast period.
Pop Up Power Outlet Industry Evolution
This section analyzes the evolutionary trajectory of the pop-up power outlet market, focusing on market growth, technological advancements, and evolving consumer demands. The market has witnessed a consistent compound annual growth rate (CAGR) of xx% during the historical period (2019-2024), primarily driven by increasing demand for convenient and aesthetically pleasing power solutions. Technological advancements, including USB-C integration, wireless charging capabilities, and smart home compatibility, are key factors driving this growth. Consumer preference is shifting towards sleek, modern designs that seamlessly integrate into various environments. Adoption rates for pop-up power outlets in commercial spaces are particularly high, reflecting a trend towards advanced workspace designs. The estimated market size in 2025 is xx million, projecting a significant expansion to xx million by 2033, fueled by technological innovations and rising demand across diverse sectors.
Leading Regions, Countries, or Segments in Pop Up Power Outlet
North America currently dominates the global pop-up power outlet market, driven primarily by the robust construction sector and high consumer disposable income. This region's dominance is further supported by significant investments in commercial infrastructure and a strong emphasis on aesthetically pleasing home designs.
- Key Drivers in North America:
- High consumer demand for modern home designs.
- Robust investments in commercial and residential construction.
- Strong regulatory support for energy-efficient power solutions.
- Other key regions: Europe and Asia-Pacific show promising growth potential, driven by rising urbanization and increasing adoption of smart home technologies. However, initial market penetration in these regions is still relatively lower compared to North America.
Pop Up Power Outlet Product Innovations
Recent product innovations focus on enhanced functionality and aesthetics. New models integrate USB-C ports, wireless charging pads, and smart home integration capabilities. These innovations cater to the rising demand for versatile and user-friendly power solutions. The emphasis on minimalist designs and seamless integration into various surfaces further differentiates these products, offering compelling unique selling propositions. Performance metrics like power output, charging speeds, and safety features are constantly being improved.
Propelling Factors for Pop Up Power Outlet Growth
Several factors drive the growth of the pop-up power outlet market. Technological advancements, such as increased power capacity and the integration of smart features, are key drivers. Economic factors, including rising disposable incomes in developing economies, contribute to increased demand. Favorable regulatory policies promoting energy efficiency also stimulate market growth.
Obstacles in the Pop Up Power Outlet Market
The market faces challenges, including supply chain disruptions that may lead to increased costs and limited availability. Furthermore, intense competition among established players and emerging entrants creates pricing pressure. Stringent safety and regulatory standards also pose a barrier to entry for some smaller manufacturers.
Future Opportunities in Pop Up Power Outlet
Emerging opportunities include expanding into new markets, particularly in developing countries, and integrating pop-up power outlets into innovative applications, such as furniture and automotive interiors. The development of advanced features, such as advanced power management and enhanced security, will further drive market expansion.
Major Players in the Pop Up Power Outlet Ecosystem
- Legrand
- Hubbell
- Leviton Manufacturing
- Lew Electric
- Power Logic
- Clipsal(Schneider Electric)
- Mockett
- Point Pod
- Anssin Electric
- Wenzhou Sunny Electrical
- Sinoamigo Electrical
- Ningbo Turn-Link Network Communication Equipment
- Philex Electronic
- Guangzhou Boente Technology
- Yueqing Winston Electric
- Zhejiang Lide Electric
Key Developments in Pop Up Power Outlet Industry
- 2022 Q4: Legrand launched a new line of smart pop-up power outlets with integrated USB-C ports.
- 2023 Q1: Hubbell announced a strategic partnership to expand its distribution network in Asia.
- 2024 Q2: Leviton Manufacturing introduced a new series of pop-up outlets with enhanced safety features.
- Further developments to be included in the final report.
Strategic Pop Up Power Outlet Market Forecast
The pop-up power outlet market is poised for robust growth, driven by continuous technological advancements, increasing consumer demand for convenience and aesthetic appeal, and the expansion into new applications and markets. The market's strategic outlook is positive, indicating significant market potential over the forecast period, with a projected CAGR of xx% leading to substantial revenue generation by 2033. Continuous innovation, strategic partnerships, and focused market expansion will be crucial for success in this rapidly evolving market.
Pop Up Power Outlet Segmentation
-
1. Application
- 1.1. Kitchen
- 1.2. Office
- 1.3. Library
- 1.4. Others
-
2. Types
- 2.1. Square Pop Up Power Outlet
- 2.2. Round Pop Up Power Outlet
- 2.3. Others
Pop Up Power Outlet Segmentation By Geography
-
1. North America
- 1.1. United States
- 1.2. Canada
- 1.3. Mexico
-
2. South America
- 2.1. Brazil
- 2.2. Argentina
- 2.3. Rest of South America
-
3. Europe
- 3.1. United Kingdom
- 3.2. Germany
- 3.3. France
- 3.4. Italy
- 3.5. Spain
- 3.6. Russia
- 3.7. Benelux
- 3.8. Nordics
- 3.9. Rest of Europe
-
4. Middle East & Africa
- 4.1. Turkey
- 4.2. Israel
- 4.3. GCC
- 4.4. North Africa
- 4.5. South Africa
- 4.6. Rest of Middle East & Africa
-
5. Asia Pacific
- 5.1. China
- 5.2. India
- 5.3. Japan
- 5.4. South Korea
- 5.5. ASEAN
- 5.6. Oceania
- 5.7. Rest of Asia Pacific

Pop Up Power Outlet Regional Market Share
Geographic Coverage of Pop Up Power Outlet
Pop Up Power Outlet REPORT HIGHLIGHTS
| Aspects | Details |
|---|---|
| Study Period | 2020-2034 |
| Base Year | 2025 |
| Estimated Year | 2026 |
| Forecast Period | 2026-2034 |
| Historical Period | 2020-2025 |
| Growth Rate | CAGR of 8% from 2020-2034 |
| Segmentation |
|
Table of Contents
- 1. Introduction
- 1.1. Research Scope
- 1.2. Market Segmentation
- 1.3. Research Methodology
- 1.4. Definitions and Assumptions
- 2. Executive Summary
- 2.1. Introduction
- 3. Market Dynamics
- 3.1. Introduction
- 3.2. Market Drivers
- 3.3. Market Restrains
- 3.4. Market Trends
- 4. Market Factor Analysis
- 4.1. Porters Five Forces
- 4.2. Supply/Value Chain
- 4.3. PESTEL analysis
- 4.4. Market Entropy
- 4.5. Patent/Trademark Analysis
- 5. Global Pop Up Power Outlet Analysis, Insights and Forecast, 2020-2032
- 5.1. Market Analysis, Insights and Forecast - by Application
- 5.1.1. Kitchen
- 5.1.2. Office
- 5.1.3. Library
- 5.1.4. Others
- 5.2. Market Analysis, Insights and Forecast - by Types
- 5.2.1. Square Pop Up Power Outlet
- 5.2.2. Round Pop Up Power Outlet
- 5.2.3. Others
- 5.3. Market Analysis, Insights and Forecast - by Region
- 5.3.1. North America
- 5.3.2. South America
- 5.3.3. Europe
- 5.3.4. Middle East & Africa
- 5.3.5. Asia Pacific
- 5.1. Market Analysis, Insights and Forecast - by Application
- 6. North America Pop Up Power Outlet Analysis, Insights and Forecast, 2020-2032
- 6.1. Market Analysis, Insights and Forecast - by Application
- 6.1.1. Kitchen
- 6.1.2. Office
- 6.1.3. Library
- 6.1.4. Others
- 6.2. Market Analysis, Insights and Forecast - by Types
- 6.2.1. Square Pop Up Power Outlet
- 6.2.2. Round Pop Up Power Outlet
- 6.2.3. Others
- 6.1. Market Analysis, Insights and Forecast - by Application
- 7. South America Pop Up Power Outlet Analysis, Insights and Forecast, 2020-2032
- 7.1. Market Analysis, Insights and Forecast - by Application
- 7.1.1. Kitchen
- 7.1.2. Office
- 7.1.3. Library
- 7.1.4. Others
- 7.2. Market Analysis, Insights and Forecast - by Types
- 7.2.1. Square Pop Up Power Outlet
- 7.2.2. Round Pop Up Power Outlet
- 7.2.3. Others
- 7.1. Market Analysis, Insights and Forecast - by Application
- 8. Europe Pop Up Power Outlet Analysis, Insights and Forecast, 2020-2032
- 8.1. Market Analysis, Insights and Forecast - by Application
- 8.1.1. Kitchen
- 8.1.2. Office
- 8.1.3. Library
- 8.1.4. Others
- 8.2. Market Analysis, Insights and Forecast - by Types
- 8.2.1. Square Pop Up Power Outlet
- 8.2.2. Round Pop Up Power Outlet
- 8.2.3. Others
- 8.1. Market Analysis, Insights and Forecast - by Application
- 9. Middle East & Africa Pop Up Power Outlet Analysis, Insights and Forecast, 2020-2032
- 9.1. Market Analysis, Insights and Forecast - by Application
- 9.1.1. Kitchen
- 9.1.2. Office
- 9.1.3. Library
- 9.1.4. Others
- 9.2. Market Analysis, Insights and Forecast - by Types
- 9.2.1. Square Pop Up Power Outlet
- 9.2.2. Round Pop Up Power Outlet
- 9.2.3. Others
- 9.1. Market Analysis, Insights and Forecast - by Application
- 10. Asia Pacific Pop Up Power Outlet Analysis, Insights and Forecast, 2020-2032
- 10.1. Market Analysis, Insights and Forecast - by Application
- 10.1.1. Kitchen
- 10.1.2. Office
- 10.1.3. Library
- 10.1.4. Others
- 10.2. Market Analysis, Insights and Forecast - by Types
- 10.2.1. Square Pop Up Power Outlet
- 10.2.2. Round Pop Up Power Outlet
- 10.2.3. Others
- 10.1. Market Analysis, Insights and Forecast - by Application
- 11. Competitive Analysis
- 11.1. Global Market Share Analysis 2025
- 11.2. Company Profiles
- 11.2.1 Legrand
- 11.2.1.1. Overview
- 11.2.1.2. Products
- 11.2.1.3. SWOT Analysis
- 11.2.1.4. Recent Developments
- 11.2.1.5. Financials (Based on Availability)
- 11.2.2 Hubbell
- 11.2.2.1. Overview
- 11.2.2.2. Products
- 11.2.2.3. SWOT Analysis
- 11.2.2.4. Recent Developments
- 11.2.2.5. Financials (Based on Availability)
- 11.2.3 Leviton Manufacturing
- 11.2.3.1. Overview
- 11.2.3.2. Products
- 11.2.3.3. SWOT Analysis
- 11.2.3.4. Recent Developments
- 11.2.3.5. Financials (Based on Availability)
- 11.2.4 Lew Electric
- 11.2.4.1. Overview
- 11.2.4.2. Products
- 11.2.4.3. SWOT Analysis
- 11.2.4.4. Recent Developments
- 11.2.4.5. Financials (Based on Availability)
- 11.2.5 Power Logic
- 11.2.5.1. Overview
- 11.2.5.2. Products
- 11.2.5.3. SWOT Analysis
- 11.2.5.4. Recent Developments
- 11.2.5.5. Financials (Based on Availability)
- 11.2.6 Clipsal(Schneider Electric )
- 11.2.6.1. Overview
- 11.2.6.2. Products
- 11.2.6.3. SWOT Analysis
- 11.2.6.4. Recent Developments
- 11.2.6.5. Financials (Based on Availability)
- 11.2.7 Mockett
- 11.2.7.1. Overview
- 11.2.7.2. Products
- 11.2.7.3. SWOT Analysis
- 11.2.7.4. Recent Developments
- 11.2.7.5. Financials (Based on Availability)
- 11.2.8 Point Pod
- 11.2.8.1. Overview
- 11.2.8.2. Products
- 11.2.8.3. SWOT Analysis
- 11.2.8.4. Recent Developments
- 11.2.8.5. Financials (Based on Availability)
- 11.2.9 Anssin Electric
- 11.2.9.1. Overview
- 11.2.9.2. Products
- 11.2.9.3. SWOT Analysis
- 11.2.9.4. Recent Developments
- 11.2.9.5. Financials (Based on Availability)
- 11.2.10 Wenzhou Sunny Electrical
- 11.2.10.1. Overview
- 11.2.10.2. Products
- 11.2.10.3. SWOT Analysis
- 11.2.10.4. Recent Developments
- 11.2.10.5. Financials (Based on Availability)
- 11.2.11 Sinoamigo Electrical
- 11.2.11.1. Overview
- 11.2.11.2. Products
- 11.2.11.3. SWOT Analysis
- 11.2.11.4. Recent Developments
- 11.2.11.5. Financials (Based on Availability)
- 11.2.12 Ningbo Turn-Link Network Communication Equipment
- 11.2.12.1. Overview
- 11.2.12.2. Products
- 11.2.12.3. SWOT Analysis
- 11.2.12.4. Recent Developments
- 11.2.12.5. Financials (Based on Availability)
- 11.2.13 Philex Electronic
- 11.2.13.1. Overview
- 11.2.13.2. Products
- 11.2.13.3. SWOT Analysis
- 11.2.13.4. Recent Developments
- 11.2.13.5. Financials (Based on Availability)
- 11.2.14 Guangzhou Boente Technology
- 11.2.14.1. Overview
- 11.2.14.2. Products
- 11.2.14.3. SWOT Analysis
- 11.2.14.4. Recent Developments
- 11.2.14.5. Financials (Based on Availability)
- 11.2.15 Yueqing Winston Electric
- 11.2.15.1. Overview
- 11.2.15.2. Products
- 11.2.15.3. SWOT Analysis
- 11.2.15.4. Recent Developments
- 11.2.15.5. Financials (Based on Availability)
- 11.2.16 Zhejiang Lide Electric
- 11.2.16.1. Overview
- 11.2.16.2. Products
- 11.2.16.3. SWOT Analysis
- 11.2.16.4. Recent Developments
- 11.2.16.5. Financials (Based on Availability)
- 11.2.1 Legrand
List of Figures
- Figure 1: Global Pop Up Power Outlet Revenue Breakdown (million, %) by Region 2025 & 2033
- Figure 2: Global Pop Up Power Outlet Volume Breakdown (K, %) by Region 2025 & 2033
- Figure 3: North America Pop Up Power Outlet Revenue (million), by Application 2025 & 2033
- Figure 4: North America Pop Up Power Outlet Volume (K), by Application 2025 & 2033
- Figure 5: North America Pop Up Power Outlet Revenue Share (%), by Application 2025 & 2033
- Figure 6: North America Pop Up Power Outlet Volume Share (%), by Application 2025 & 2033
- Figure 7: North America Pop Up Power Outlet Revenue (million), by Types 2025 & 2033
- Figure 8: North America Pop Up Power Outlet Volume (K), by Types 2025 & 2033
- Figure 9: North America Pop Up Power Outlet Revenue Share (%), by Types 2025 & 2033
- Figure 10: North America Pop Up Power Outlet Volume Share (%), by Types 2025 & 2033
- Figure 11: North America Pop Up Power Outlet Revenue (million), by Country 2025 & 2033
- Figure 12: North America Pop Up Power Outlet Volume (K), by Country 2025 & 2033
- Figure 13: North America Pop Up Power Outlet Revenue Share (%), by Country 2025 & 2033
- Figure 14: North America Pop Up Power Outlet Volume Share (%), by Country 2025 & 2033
- Figure 15: South America Pop Up Power Outlet Revenue (million), by Application 2025 & 2033
- Figure 16: South America Pop Up Power Outlet Volume (K), by Application 2025 & 2033
- Figure 17: South America Pop Up Power Outlet Revenue Share (%), by Application 2025 & 2033
- Figure 18: South America Pop Up Power Outlet Volume Share (%), by Application 2025 & 2033
- Figure 19: South America Pop Up Power Outlet Revenue (million), by Types 2025 & 2033
- Figure 20: South America Pop Up Power Outlet Volume (K), by Types 2025 & 2033
- Figure 21: South America Pop Up Power Outlet Revenue Share (%), by Types 2025 & 2033
- Figure 22: South America Pop Up Power Outlet Volume Share (%), by Types 2025 & 2033
- Figure 23: South America Pop Up Power Outlet Revenue (million), by Country 2025 & 2033
- Figure 24: South America Pop Up Power Outlet Volume (K), by Country 2025 & 2033
- Figure 25: South America Pop Up Power Outlet Revenue Share (%), by Country 2025 & 2033
- Figure 26: South America Pop Up Power Outlet Volume Share (%), by Country 2025 & 2033
- Figure 27: Europe Pop Up Power Outlet Revenue (million), by Application 2025 & 2033
- Figure 28: Europe Pop Up Power Outlet Volume (K), by Application 2025 & 2033
- Figure 29: Europe Pop Up Power Outlet Revenue Share (%), by Application 2025 & 2033
- Figure 30: Europe Pop Up Power Outlet Volume Share (%), by Application 2025 & 2033
- Figure 31: Europe Pop Up Power Outlet Revenue (million), by Types 2025 & 2033
- Figure 32: Europe Pop Up Power Outlet Volume (K), by Types 2025 & 2033
- Figure 33: Europe Pop Up Power Outlet Revenue Share (%), by Types 2025 & 2033
- Figure 34: Europe Pop Up Power Outlet Volume Share (%), by Types 2025 & 2033
- Figure 35: Europe Pop Up Power Outlet Revenue (million), by Country 2025 & 2033
- Figure 36: Europe Pop Up Power Outlet Volume (K), by Country 2025 & 2033
- Figure 37: Europe Pop Up Power Outlet Revenue Share (%), by Country 2025 & 2033
- Figure 38: Europe Pop Up Power Outlet Volume Share (%), by Country 2025 & 2033
- Figure 39: Middle East & Africa Pop Up Power Outlet Revenue (million), by Application 2025 & 2033
- Figure 40: Middle East & Africa Pop Up Power Outlet Volume (K), by Application 2025 & 2033
- Figure 41: Middle East & Africa Pop Up Power Outlet Revenue Share (%), by Application 2025 & 2033
- Figure 42: Middle East & Africa Pop Up Power Outlet Volume Share (%), by Application 2025 & 2033
- Figure 43: Middle East & Africa Pop Up Power Outlet Revenue (million), by Types 2025 & 2033
- Figure 44: Middle East & Africa Pop Up Power Outlet Volume (K), by Types 2025 & 2033
- Figure 45: Middle East & Africa Pop Up Power Outlet Revenue Share (%), by Types 2025 & 2033
- Figure 46: Middle East & Africa Pop Up Power Outlet Volume Share (%), by Types 2025 & 2033
- Figure 47: Middle East & Africa Pop Up Power Outlet Revenue (million), by Country 2025 & 2033
- Figure 48: Middle East & Africa Pop Up Power Outlet Volume (K), by Country 2025 & 2033
- Figure 49: Middle East & Africa Pop Up Power Outlet Revenue Share (%), by Country 2025 & 2033
- Figure 50: Middle East & Africa Pop Up Power Outlet Volume Share (%), by Country 2025 & 2033
- Figure 51: Asia Pacific Pop Up Power Outlet Revenue (million), by Application 2025 & 2033
- Figure 52: Asia Pacific Pop Up Power Outlet Volume (K), by Application 2025 & 2033
- Figure 53: Asia Pacific Pop Up Power Outlet Revenue Share (%), by Application 2025 & 2033
- Figure 54: Asia Pacific Pop Up Power Outlet Volume Share (%), by Application 2025 & 2033
- Figure 55: Asia Pacific Pop Up Power Outlet Revenue (million), by Types 2025 & 2033
- Figure 56: Asia Pacific Pop Up Power Outlet Volume (K), by Types 2025 & 2033
- Figure 57: Asia Pacific Pop Up Power Outlet Revenue Share (%), by Types 2025 & 2033
- Figure 58: Asia Pacific Pop Up Power Outlet Volume Share (%), by Types 2025 & 2033
- Figure 59: Asia Pacific Pop Up Power Outlet Revenue (million), by Country 2025 & 2033
- Figure 60: Asia Pacific Pop Up Power Outlet Volume (K), by Country 2025 & 2033
- Figure 61: Asia Pacific Pop Up Power Outlet Revenue Share (%), by Country 2025 & 2033
- Figure 62: Asia Pacific Pop Up Power Outlet Volume Share (%), by Country 2025 & 2033
List of Tables
- Table 1: Global Pop Up Power Outlet Revenue million Forecast, by Application 2020 & 2033
- Table 2: Global Pop Up Power Outlet Volume K Forecast, by Application 2020 & 2033
- Table 3: Global Pop Up Power Outlet Revenue million Forecast, by Types 2020 & 2033
- Table 4: Global Pop Up Power Outlet Volume K Forecast, by Types 2020 & 2033
- Table 5: Global Pop Up Power Outlet Revenue million Forecast, by Region 2020 & 2033
- Table 6: Global Pop Up Power Outlet Volume K Forecast, by Region 2020 & 2033
- Table 7: Global Pop Up Power Outlet Revenue million Forecast, by Application 2020 & 2033
- Table 8: Global Pop Up Power Outlet Volume K Forecast, by Application 2020 & 2033
- Table 9: Global Pop Up Power Outlet Revenue million Forecast, by Types 2020 & 2033
- Table 10: Global Pop Up Power Outlet Volume K Forecast, by Types 2020 & 2033
- Table 11: Global Pop Up Power Outlet Revenue million Forecast, by Country 2020 & 2033
- Table 12: Global Pop Up Power Outlet Volume K Forecast, by Country 2020 & 2033
- Table 13: United States Pop Up Power Outlet Revenue (million) Forecast, by Application 2020 & 2033
- Table 14: United States Pop Up Power Outlet Volume (K) Forecast, by Application 2020 & 2033
- Table 15: Canada Pop Up Power Outlet Revenue (million) Forecast, by Application 2020 & 2033
- Table 16: Canada Pop Up Power Outlet Volume (K) Forecast, by Application 2020 & 2033
- Table 17: Mexico Pop Up Power Outlet Revenue (million) Forecast, by Application 2020 & 2033
- Table 18: Mexico Pop Up Power Outlet Volume (K) Forecast, by Application 2020 & 2033
- Table 19: Global Pop Up Power Outlet Revenue million Forecast, by Application 2020 & 2033
- Table 20: Global Pop Up Power Outlet Volume K Forecast, by Application 2020 & 2033
- Table 21: Global Pop Up Power Outlet Revenue million Forecast, by Types 2020 & 2033
- Table 22: Global Pop Up Power Outlet Volume K Forecast, by Types 2020 & 2033
- Table 23: Global Pop Up Power Outlet Revenue million Forecast, by Country 2020 & 2033
- Table 24: Global Pop Up Power Outlet Volume K Forecast, by Country 2020 & 2033
- Table 25: Brazil Pop Up Power Outlet Revenue (million) Forecast, by Application 2020 & 2033
- Table 26: Brazil Pop Up Power Outlet Volume (K) Forecast, by Application 2020 & 2033
- Table 27: Argentina Pop Up Power Outlet Revenue (million) Forecast, by Application 2020 & 2033
- Table 28: Argentina Pop Up Power Outlet Volume (K) Forecast, by Application 2020 & 2033
- Table 29: Rest of South America Pop Up Power Outlet Revenue (million) Forecast, by Application 2020 & 2033
- Table 30: Rest of South America Pop Up Power Outlet Volume (K) Forecast, by Application 2020 & 2033
- Table 31: Global Pop Up Power Outlet Revenue million Forecast, by Application 2020 & 2033
- Table 32: Global Pop Up Power Outlet Volume K Forecast, by Application 2020 & 2033
- Table 33: Global Pop Up Power Outlet Revenue million Forecast, by Types 2020 & 2033
- Table 34: Global Pop Up Power Outlet Volume K Forecast, by Types 2020 & 2033
- Table 35: Global Pop Up Power Outlet Revenue million Forecast, by Country 2020 & 2033
- Table 36: Global Pop Up Power Outlet Volume K Forecast, by Country 2020 & 2033
- Table 37: United Kingdom Pop Up Power Outlet Revenue (million) Forecast, by Application 2020 & 2033
- Table 38: United Kingdom Pop Up Power Outlet Volume (K) Forecast, by Application 2020 & 2033
- Table 39: Germany Pop Up Power Outlet Revenue (million) Forecast, by Application 2020 & 2033
- Table 40: Germany Pop Up Power Outlet Volume (K) Forecast, by Application 2020 & 2033
- Table 41: France Pop Up Power Outlet Revenue (million) Forecast, by Application 2020 & 2033
- Table 42: France Pop Up Power Outlet Volume (K) Forecast, by Application 2020 & 2033
- Table 43: Italy Pop Up Power Outlet Revenue (million) Forecast, by Application 2020 & 2033
- Table 44: Italy Pop Up Power Outlet Volume (K) Forecast, by Application 2020 & 2033
- Table 45: Spain Pop Up Power Outlet Revenue (million) Forecast, by Application 2020 & 2033
- Table 46: Spain Pop Up Power Outlet Volume (K) Forecast, by Application 2020 & 2033
- Table 47: Russia Pop Up Power Outlet Revenue (million) Forecast, by Application 2020 & 2033
- Table 48: Russia Pop Up Power Outlet Volume (K) Forecast, by Application 2020 & 2033
- Table 49: Benelux Pop Up Power Outlet Revenue (million) Forecast, by Application 2020 & 2033
- Table 50: Benelux Pop Up Power Outlet Volume (K) Forecast, by Application 2020 & 2033
- Table 51: Nordics Pop Up Power Outlet Revenue (million) Forecast, by Application 2020 & 2033
- Table 52: Nordics Pop Up Power Outlet Volume (K) Forecast, by Application 2020 & 2033
- Table 53: Rest of Europe Pop Up Power Outlet Revenue (million) Forecast, by Application 2020 & 2033
- Table 54: Rest of Europe Pop Up Power Outlet Volume (K) Forecast, by Application 2020 & 2033
- Table 55: Global Pop Up Power Outlet Revenue million Forecast, by Application 2020 & 2033
- Table 56: Global Pop Up Power Outlet Volume K Forecast, by Application 2020 & 2033
- Table 57: Global Pop Up Power Outlet Revenue million Forecast, by Types 2020 & 2033
- Table 58: Global Pop Up Power Outlet Volume K Forecast, by Types 2020 & 2033
- Table 59: Global Pop Up Power Outlet Revenue million Forecast, by Country 2020 & 2033
- Table 60: Global Pop Up Power Outlet Volume K Forecast, by Country 2020 & 2033
- Table 61: Turkey Pop Up Power Outlet Revenue (million) Forecast, by Application 2020 & 2033
- Table 62: Turkey Pop Up Power Outlet Volume (K) Forecast, by Application 2020 & 2033
- Table 63: Israel Pop Up Power Outlet Revenue (million) Forecast, by Application 2020 & 2033
- Table 64: Israel Pop Up Power Outlet Volume (K) Forecast, by Application 2020 & 2033
- Table 65: GCC Pop Up Power Outlet Revenue (million) Forecast, by Application 2020 & 2033
- Table 66: GCC Pop Up Power Outlet Volume (K) Forecast, by Application 2020 & 2033
- Table 67: North Africa Pop Up Power Outlet Revenue (million) Forecast, by Application 2020 & 2033
- Table 68: North Africa Pop Up Power Outlet Volume (K) Forecast, by Application 2020 & 2033
- Table 69: South Africa Pop Up Power Outlet Revenue (million) Forecast, by Application 2020 & 2033
- Table 70: South Africa Pop Up Power Outlet Volume (K) Forecast, by Application 2020 & 2033
- Table 71: Rest of Middle East & Africa Pop Up Power Outlet Revenue (million) Forecast, by Application 2020 & 2033
- Table 72: Rest of Middle East & Africa Pop Up Power Outlet Volume (K) Forecast, by Application 2020 & 2033
- Table 73: Global Pop Up Power Outlet Revenue million Forecast, by Application 2020 & 2033
- Table 74: Global Pop Up Power Outlet Volume K Forecast, by Application 2020 & 2033
- Table 75: Global Pop Up Power Outlet Revenue million Forecast, by Types 2020 & 2033
- Table 76: Global Pop Up Power Outlet Volume K Forecast, by Types 2020 & 2033
- Table 77: Global Pop Up Power Outlet Revenue million Forecast, by Country 2020 & 2033
- Table 78: Global Pop Up Power Outlet Volume K Forecast, by Country 2020 & 2033
- Table 79: China Pop Up Power Outlet Revenue (million) Forecast, by Application 2020 & 2033
- Table 80: China Pop Up Power Outlet Volume (K) Forecast, by Application 2020 & 2033
- Table 81: India Pop Up Power Outlet Revenue (million) Forecast, by Application 2020 & 2033
- Table 82: India Pop Up Power Outlet Volume (K) Forecast, by Application 2020 & 2033
- Table 83: Japan Pop Up Power Outlet Revenue (million) Forecast, by Application 2020 & 2033
- Table 84: Japan Pop Up Power Outlet Volume (K) Forecast, by Application 2020 & 2033
- Table 85: South Korea Pop Up Power Outlet Revenue (million) Forecast, by Application 2020 & 2033
- Table 86: South Korea Pop Up Power Outlet Volume (K) Forecast, by Application 2020 & 2033
- Table 87: ASEAN Pop Up Power Outlet Revenue (million) Forecast, by Application 2020 & 2033
- Table 88: ASEAN Pop Up Power Outlet Volume (K) Forecast, by Application 2020 & 2033
- Table 89: Oceania Pop Up Power Outlet Revenue (million) Forecast, by Application 2020 & 2033
- Table 90: Oceania Pop Up Power Outlet Volume (K) Forecast, by Application 2020 & 2033
- Table 91: Rest of Asia Pacific Pop Up Power Outlet Revenue (million) Forecast, by Application 2020 & 2033
- Table 92: Rest of Asia Pacific Pop Up Power Outlet Volume (K) Forecast, by Application 2020 & 2033
Frequently Asked Questions
1. What is the projected Compound Annual Growth Rate (CAGR) of the Pop Up Power Outlet?
The projected CAGR is approximately 8%.
2. Which companies are prominent players in the Pop Up Power Outlet?
Key companies in the market include Legrand, Hubbell, Leviton Manufacturing, Lew Electric, Power Logic, Clipsal(Schneider Electric ), Mockett, Point Pod, Anssin Electric, Wenzhou Sunny Electrical, Sinoamigo Electrical, Ningbo Turn-Link Network Communication Equipment, Philex Electronic, Guangzhou Boente Technology, Yueqing Winston Electric, Zhejiang Lide Electric.
3. What are the main segments of the Pop Up Power Outlet?
The market segments include Application, Types.
4. Can you provide details about the market size?
The market size is estimated to be USD 500 million as of 2022.
5. What are some drivers contributing to market growth?
N/A
6. What are the notable trends driving market growth?
N/A
7. Are there any restraints impacting market growth?
N/A
8. Can you provide examples of recent developments in the market?
N/A
9. What pricing options are available for accessing the report?
Pricing options include single-user, multi-user, and enterprise licenses priced at USD 3350.00, USD 5025.00, and USD 6700.00 respectively.
10. Is the market size provided in terms of value or volume?
The market size is provided in terms of value, measured in million and volume, measured in K.
11. Are there any specific market keywords associated with the report?
Yes, the market keyword associated with the report is "Pop Up Power Outlet," which aids in identifying and referencing the specific market segment covered.
12. How do I determine which pricing option suits my needs best?
The pricing options vary based on user requirements and access needs. Individual users may opt for single-user licenses, while businesses requiring broader access may choose multi-user or enterprise licenses for cost-effective access to the report.
13. Are there any additional resources or data provided in the Pop Up Power Outlet report?
While the report offers comprehensive insights, it's advisable to review the specific contents or supplementary materials provided to ascertain if additional resources or data are available.
14. How can I stay updated on further developments or reports in the Pop Up Power Outlet?
To stay informed about further developments, trends, and reports in the Pop Up Power Outlet, consider subscribing to industry newsletters, following relevant companies and organizations, or regularly checking reputable industry news sources and publications.
Methodology
Step 1 - Identification of Relevant Samples Size from Population Database


Step 2 - Approaches for Defining Global Market Size (Value, Volume* & Price*)

Note*: In applicable scenarios
Step 3 - Data Sources
Primary Research
- Web Analytics
- Survey Reports
- Research Institute
- Latest Research Reports
- Opinion Leaders
Secondary Research
- Annual Reports
- White Paper
- Latest Press Release
- Industry Association
- Paid Database
- Investor Presentations

Step 4 - Data Triangulation
Involves using different sources of information in order to increase the validity of a study
These sources are likely to be stakeholders in a program - participants, other researchers, program staff, other community members, and so on.
Then we put all data in single framework & apply various statistical tools to find out the dynamic on the market.
During the analysis stage, feedback from the stakeholder groups would be compared to determine areas of agreement as well as areas of divergence