

Key Insights
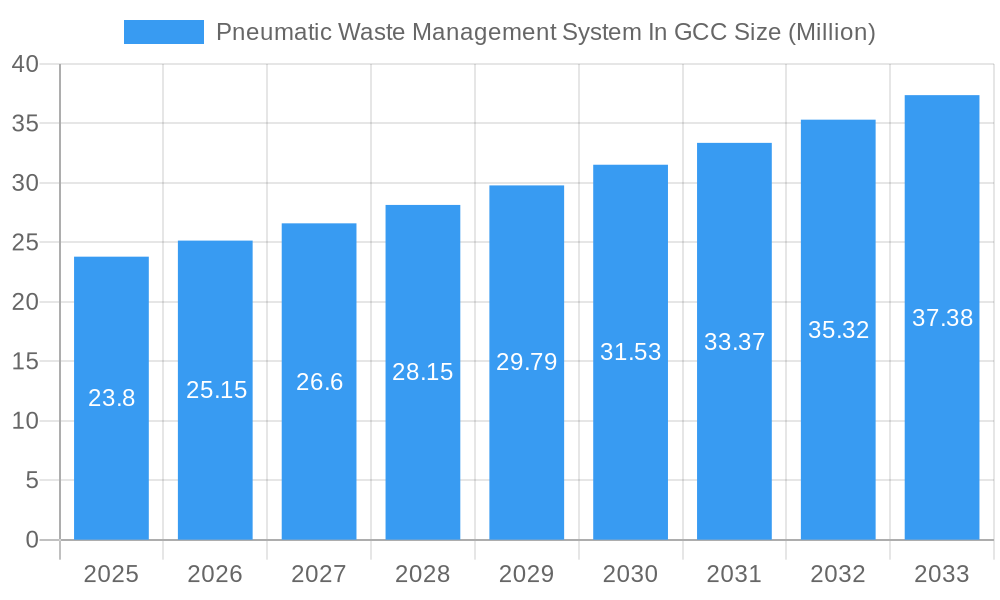
The Pneumatic Waste Management System (PWMS) market in the Gulf Cooperation Council (GCC) is experiencing robust growth, projected to reach \$23.80 million in 2025 and maintain a Compound Annual Growth Rate (CAGR) of 5.47% from 2025 to 2033. This expansion is driven by several key factors. Increasing urbanization and population density within the GCC necessitate efficient waste management solutions, making PWMS, with its ability to transport waste through underground networks, an attractive alternative to traditional methods. Furthermore, rising environmental awareness and stricter regulations regarding waste disposal are pushing municipalities and private entities to adopt more sustainable and hygienic waste collection systems. The GCC's significant investment in infrastructure development further fuels market growth, creating opportunities for PWMS deployment in new constructions and renovations. Key players like Marimatic, ENVAC, URD, and others are contributing to this growth through technological advancements, innovative product offerings, and strategic partnerships within the region. While challenges such as high initial investment costs and the need for specialized infrastructure can act as restraints, the long-term benefits of improved hygiene, reduced operational costs, and minimized environmental impact outweigh these factors, driving sustained market expansion.
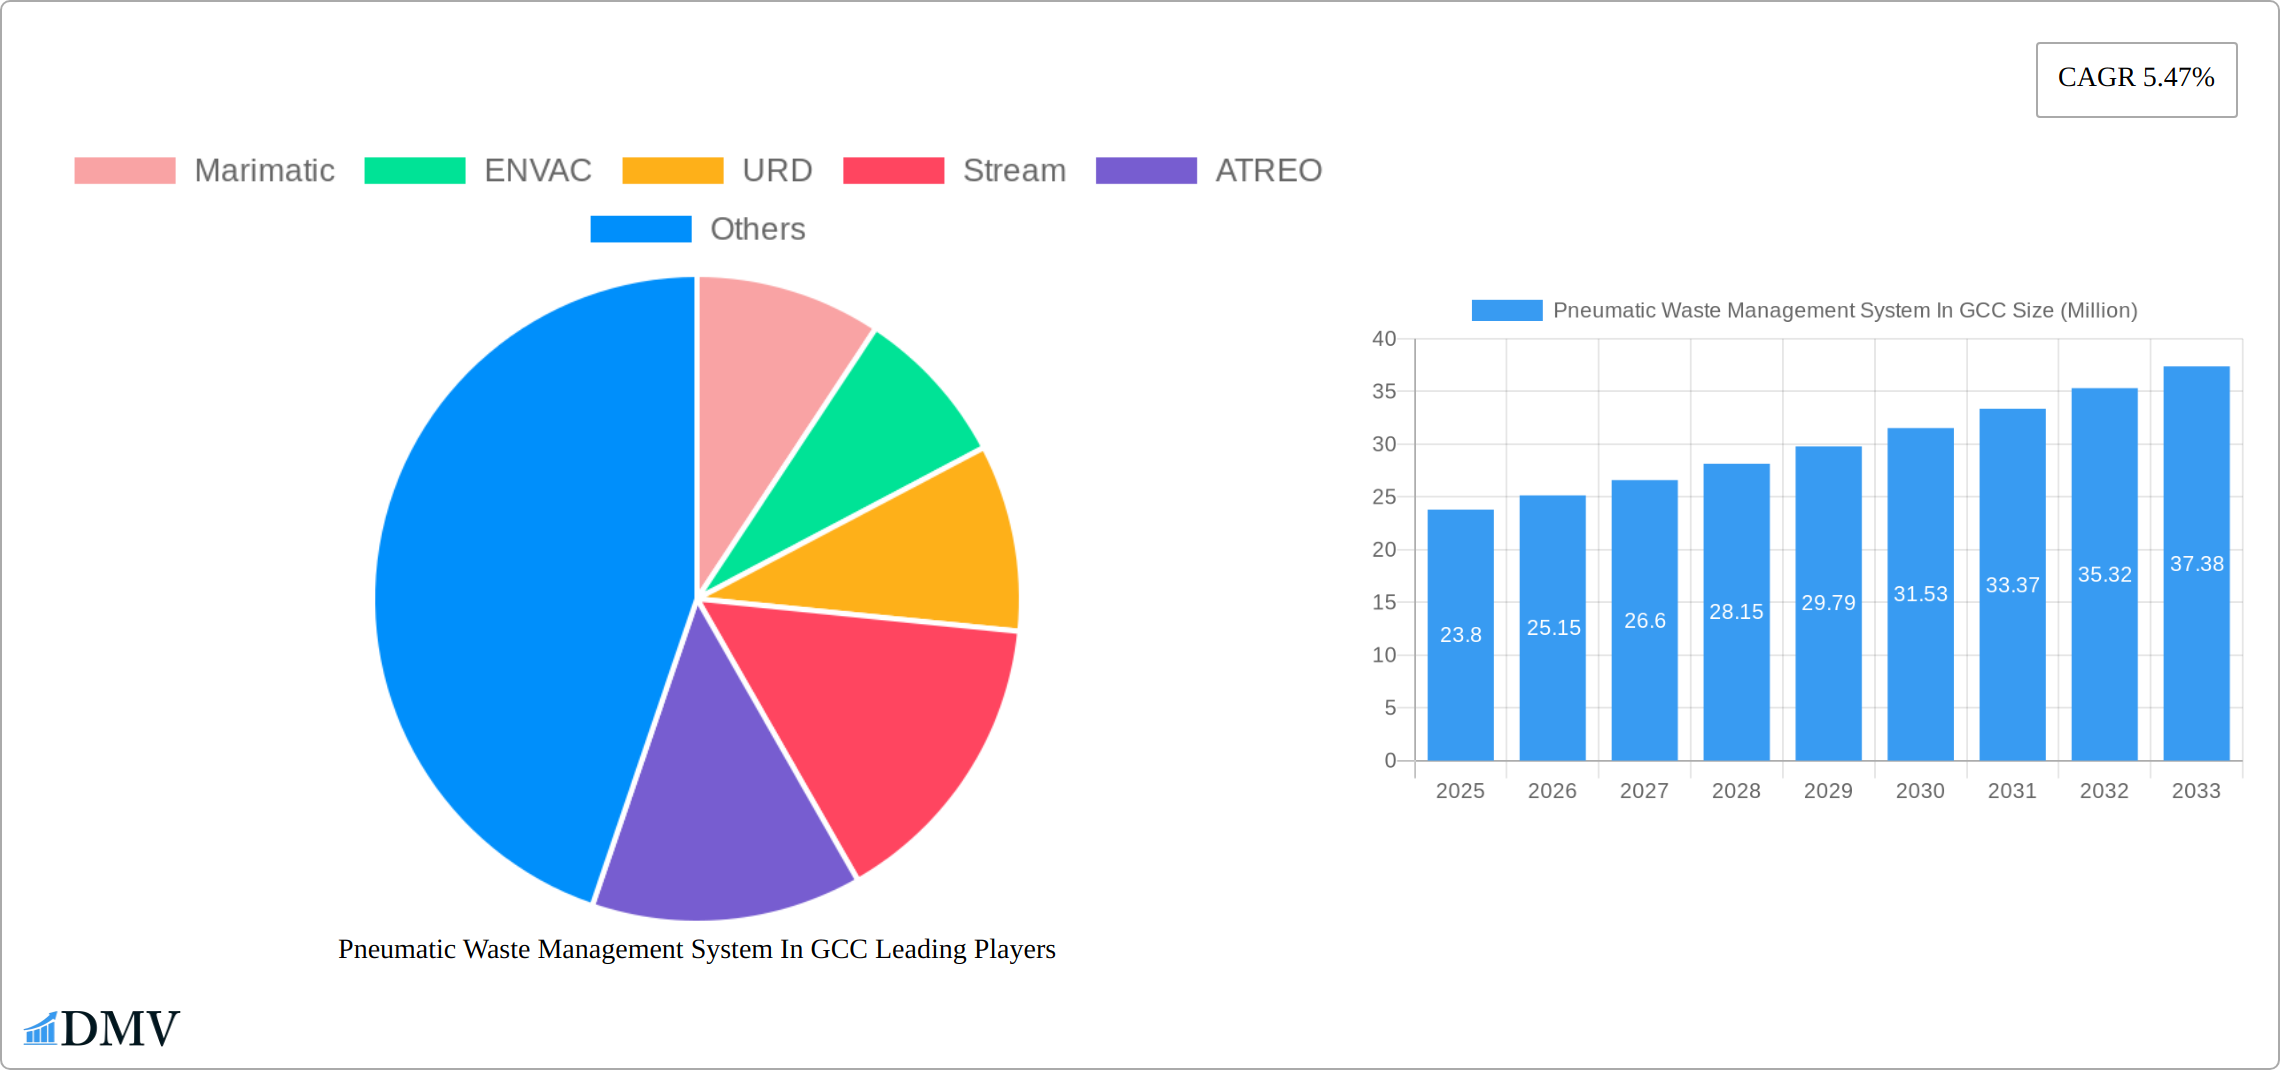
Pneumatic Waste Management System In GCC Market Size (In Million)
The competitive landscape is characterized by a mix of international and regional players. While larger companies dominate the market with established technologies and extensive networks, smaller, specialized firms are emerging, offering niche solutions and fostering innovation. The market segmentation, while currently unspecified, likely includes solutions tailored to various waste types (residential, commercial, industrial), system sizes, and technological advancements (automation, smart sensors). Future growth will be influenced by factors such as government initiatives promoting sustainable waste management, technological innovations leading to increased efficiency and cost-effectiveness, and the adoption of smart city initiatives that integrate PWMS into broader urban infrastructure development strategies. The market is poised for continued growth, driven by the long-term necessity for improved waste management in the rapidly developing GCC region.
Pneumatic Waste Management System In GCC Company Market Share
Pneumatic Waste Management System in GCC: A Comprehensive Market Report (2019-2033)
This insightful report provides a comprehensive analysis of the Pneumatic Waste Management System market in the Gulf Cooperation Council (GCC) region, covering the period 2019-2033. With a base year of 2025 and a forecast period spanning 2025-2033, this study offers crucial data-driven insights for stakeholders seeking to navigate this dynamic market. The report details market size, competitive landscape, technological advancements, and future growth potential, providing a robust foundation for strategic decision-making. The total market value is estimated at $XX Million in 2025, projected to reach $XX Million by 2033.
Pneumatic Waste Management System In GCC Market Composition & Trends
This section delves into the intricate structure of the GCC's pneumatic waste management system market. We evaluate market concentration, revealing the dominance of key players and the potential for market disruption. Innovation catalysts driving technological advancements and regulatory landscapes shaping market dynamics are meticulously examined. The report also explores substitute products and their market impact, along with a detailed analysis of end-user profiles and their specific needs. Finally, the section features a comprehensive review of mergers and acquisitions (M&A) activity within the industry, including deal values and market share distribution changes.
- Market Concentration: The GCC pneumatic waste management system market exhibits a moderately concentrated structure, with a few major players holding significant market share. The top five companies hold approximately XX% of the market share in 2025.
- Innovation Catalysts: Increasing urbanization, stringent environmental regulations, and the growing need for efficient waste management solutions are fueling innovation in this sector.
- Regulatory Landscape: Government initiatives promoting sustainable waste management practices and investments in smart city infrastructure significantly impact market growth.
- Substitute Products: While pneumatic systems offer unique advantages, the report also examines the competitive pressures from alternative waste management technologies.
- End-User Profiles: The report analyzes the diverse needs of end-users, including municipalities, commercial establishments, and industrial facilities.
- M&A Activities: The report tracks significant M&A activities, including deal values and their implications for market consolidation. Examples include deals valued at $XX Million in 2023.
Pneumatic Waste Management System In GCC Industry Evolution
This section traces the evolution of the pneumatic waste management system industry within the GCC, analyzing market growth trajectories, technological advancements, and shifts in consumer demands over the study period (2019-2024). We present specific data points on growth rates and adoption metrics, highlighting key trends and their implications for market participants. Technological advancements such as the integration of IoT sensors and AI-powered optimization systems are discussed in detail. The evolution of consumer preferences, particularly the growing demand for environmentally friendly and efficient solutions, are also thoroughly analyzed. The Compound Annual Growth Rate (CAGR) during the historical period (2019-2024) is estimated at XX%, projected to reach XX% during the forecast period (2025-2033).
Leading Regions, Countries, or Segments in Pneumatic Waste Management System In GCC
This section identifies the dominant regions, countries, or segments within the GCC pneumatic waste management system market. A detailed analysis explores the factors driving their dominance, including investment trends, regulatory support, and infrastructure development.
- Key Drivers:
- Significant Government Investments: Several GCC countries have invested heavily in infrastructure projects that directly support pneumatic waste management systems.
- Stringent Environmental Regulations: Governments are increasingly imposing stricter regulations to improve waste management practices.
- Urbanization and Population Growth: Rapid urbanization in GCC cities contributes to increased waste generation, fueling demand for efficient waste disposal solutions.
- Dominance Analysis: The UAE and Saudi Arabia are expected to lead the market owing to higher investments and regulatory support. The dominance is largely fueled by infrastructure development and government support for smart city initiatives.
Pneumatic Waste Management System In GCC Product Innovations
The GCC pneumatic waste management system market is experiencing a wave of innovation, driven by a commitment to efficiency, sustainability, and smart city integration. Recent advancements are redefining how waste is collected and processed, offering distinct advantages over conventional methods. Key innovations include:
- Enhanced Energy Efficiency and Reduced Noise Pollution: Manufacturers are developing next-generation systems that consume significantly less energy, contributing to lower operational costs and a reduced environmental footprint. Simultaneously, noise reduction technologies are being integrated, making these systems more suitable for urban environments.
- Advanced Material Handling and Sorting Capabilities: The introduction of sophisticated sensors and automated sorting mechanisms allows for better segregation of waste streams at the point of collection. This facilitates higher recycling rates and the efficient recovery of valuable resources, aligning with circular economy principles.
- Seamless Smart City Integration: A prominent trend is the integration of pneumatic waste systems with broader smart city infrastructures. This includes IoT connectivity for real-time monitoring of fill levels, predictive maintenance, optimized collection routes, and data analytics for improved waste management planning.
- Improved Durability and Reduced Maintenance: Innovations in material science and system design are leading to more robust and longer-lasting components, thus reducing the frequency and cost of maintenance.
- Modular and Scalable Solutions: The development of modular system designs allows for greater flexibility and scalability, enabling projects to be adapted to varying urban densities and waste volumes, from small residential developments to large commercial districts.
These technological leaps not only enhance the operational efficiency and sustainability of waste management processes but also position pneumatic systems as a crucial component of modern, intelligent urban development in the GCC.
Propelling Factors for Pneumatic Waste Management System In GCC Growth
The GCC region is witnessing robust growth in its pneumatic waste management system market, fueled by a confluence of strategic initiatives, technological advancements, and increasing environmental consciousness. The primary drivers include:
- Government Vision and Sustainability Mandates: Visionary government strategies across GCC nations, such as Saudi Vision 2030 and the UAE's Net Zero 2050, prioritize sustainable development and resource management. This creates a supportive policy environment for advanced waste management solutions like pneumatic systems.
- Technological Sophistication and Automation: The adoption of cutting-edge technologies is revolutionizing waste management. This includes:
- IoT and Data Analytics: Real-time monitoring of waste levels, performance metrics, and predictive maintenance capabilities powered by the Internet of Things (IoT) significantly enhance operational efficiency and reduce costs.
- Automated Sorting and Recycling Technologies: Innovations in automated sorting at collection points improve the purity of recyclables, driving higher recycling rates and supporting the circular economy.
- Energy-Efficient System Designs: Manufacturers are continuously improving the energy efficiency of pneumatic systems, aligning with the region's focus on reducing carbon footprints.
- Economic Incentives and Investment: Governments are actively encouraging the adoption of sustainable waste management practices through subsidies, tax incentives, and public-private partnerships, making pneumatic systems a more attractive investment for developers and municipalities.
- Rapid Urbanization and Infrastructure Development: The ongoing expansion of cities and the development of new urban centers, including smart cities and large-scale projects, create a consistent demand for efficient and integrated waste management solutions. Pneumatic systems are ideally suited for these large, complex environments.
- Heightened Environmental Awareness and Health Concerns: A growing public and governmental understanding of the environmental impact of traditional waste disposal methods, coupled with concerns for public health and urban aesthetics, is accelerating the demand for cleaner and more hygienic waste management solutions.
- Smart City Initiatives: The widespread implementation of smart city projects across the GCC necessitates integrated, intelligent infrastructure. Pneumatic waste management systems are a key enabler of these initiatives, contributing to cleaner, more efficient, and liveable urban spaces.
These synergistic factors are creating a fertile ground for the expansion and widespread implementation of pneumatic waste management systems throughout the GCC.
Obstacles in the Pneumatic Waste Management System In GCC Market
While the GCC pneumatic waste management system market exhibits significant growth potential, several challenges need to be addressed for its full realization. These obstacles, if not mitigated, could impact the pace and scale of adoption:
- High Initial Capital Expenditure: The upfront cost of installing pneumatic waste systems, including excavation, pipe networks, and collection stations, remains a substantial barrier. This is particularly challenging for smaller developers or municipalities with limited budgets.
- Complexity of Integration with Existing Infrastructure: Retrofitting pneumatic systems into established urban areas or older buildings can be technically complex, disruptive, and costly. It often requires extensive civil engineering work and coordination with multiple stakeholders.
- Need for Specialized Expertise and Skilled Workforce: The design, installation, operation, and maintenance of these advanced systems require a highly skilled and trained workforce. A shortage of such expertise in the region can lead to project delays and increased operational costs.
- Perception and Awareness Gaps: While growing, there is still a need to further educate stakeholders, including developers, city planners, and the general public, about the long-term benefits and operational efficiencies of pneumatic waste management systems compared to conventional methods.
- Potential Supply Chain and Geopolitical Risks: Reliance on imported components and specialized equipment can expose the market to global supply chain disruptions, fluctuating material costs, and geopolitical uncertainties, which could impact project timelines and budgets.
- Competition from Evolving Alternative Technologies: The waste management sector is dynamic, with continuous advancements in other technologies such as advanced incineration, anaerobic digestion, and more efficient traditional collection methods. These alternatives present ongoing competition and require pneumatic systems to continually demonstrate their superior value proposition.
- Regulatory Hurdles and Standardization: While regulations are generally supportive, the absence of fully harmonized standards across different GCC countries for pneumatic system design, installation, and operation can create complexity for regional deployments.
Addressing these hurdles through innovative financing models, training programs, public awareness campaigns, and streamlined regulatory frameworks will be crucial for unlocking the full market potential.
Future Opportunities in Pneumatic Waste Management System In GCC
The future holds significant opportunities. Expansion into new markets, particularly in smaller cities and towns, presents substantial growth potential. Technological advancements, such as the development of more sustainable and energy-efficient systems, will create new avenues for innovation. Additionally, the increasing integration of pneumatic waste systems with smart city initiatives will pave the way for greater efficiency and environmental sustainability.
Major Players in the Pneumatic Waste Management System In GCC Ecosystem
- Marimatic
- ENVAC
- URD (Urban Refuse Development)
- Stream Environmental Systems
- ATREO
- Ros Roca envirotec
- Peakway Environmental Sci & Tech Co Ltd
- Aerbin ApS
- Logiwaste AB
- Envac (mentioned twice, likely an error in original list)
- Numerous other companies contributing to installation, maintenance, and related services, bringing the total ecosystem to over 73 key entities.
Key Developments in Pneumatic Waste Management System In GCC Industry
- August 2023: Akam Partners with Alawalya Qatar for Enhanced Demolition Waste Management. Akam, a subsidiary of SIRC Group, has joined forces with Alawalya Qatar to significantly improve the sorting and processing of demolition and construction waste. This strategic partnership focuses on promoting the reuse of recycled materials and aims to establish new Qatari standards for sustainable practices in this critical waste stream. This collaboration underscores a strong commitment to advancing circular economy principles within Qatar's rapidly developing construction sector.
- May 2023: EnviroServe Expands Global Reach with New Virginia Facility. While not directly located within the GCC, EnviroServe's opening of a new facility in Richmond, Virginia, highlights the growing global demand and strategic expansion of comprehensive waste management solutions. This move reinforces the company's commitment to serving a wider international market and signifies the increasing recognition of advanced waste handling capabilities across different regions.
- Ongoing Smart City Integrations: Across the GCC, multiple smart city projects are actively incorporating or planning for pneumatic waste management systems. These integrations focus on leveraging IoT capabilities for real-time monitoring, optimizing collection efficiency, and contributing to the overall cleanliness and sustainability goals of futuristic urban developments.
- Technological Upgrades in Existing Systems: Several existing pneumatic waste management installations in the GCC are undergoing upgrades and retrofits to incorporate the latest advancements in sensor technology, energy efficiency, and data analytics, further enhancing their performance and sustainability.
Strategic Pneumatic Waste Management System In GCC Market Forecast
The GCC pneumatic waste management system market is poised for substantial growth, driven by ongoing urbanization, increased environmental awareness, and supportive government policies. Continued technological innovation and strategic partnerships will further propel market expansion. The forecast indicates significant potential for growth, particularly in sectors like construction and demolition waste management, and opportunities for new market entrants and innovative solutions.
Pneumatic Waste Management System In GCC Segmentation
-
1. End User
- 1.1. Residential
- 1.2. Commercial
- 1.3. Industrial
- 1.4. Other End Users
Pneumatic Waste Management System In GCC Segmentation By Geography
-
1. North America
- 1.1. United States
- 1.2. Canada
- 1.3. Mexico
-
2. South America
- 2.1. Brazil
- 2.2. Argentina
- 2.3. Rest of South America
-
3. Europe
- 3.1. United Kingdom
- 3.2. Germany
- 3.3. France
- 3.4. Italy
- 3.5. Spain
- 3.6. Russia
- 3.7. Benelux
- 3.8. Nordics
- 3.9. Rest of Europe
-
4. Middle East & Africa
- 4.1. Turkey
- 4.2. Israel
- 4.3. GCC
- 4.4. North Africa
- 4.5. South Africa
- 4.6. Rest of Middle East & Africa
-
5. Asia Pacific
- 5.1. China
- 5.2. India
- 5.3. Japan
- 5.4. South Korea
- 5.5. ASEAN
- 5.6. Oceania
- 5.7. Rest of Asia Pacific

Pneumatic Waste Management System In GCC Regional Market Share
Geographic Coverage of Pneumatic Waste Management System In GCC
Pneumatic Waste Management System In GCC REPORT HIGHLIGHTS
| Aspects | Details |
|---|---|
| Study Period | 2020-2034 |
| Base Year | 2025 |
| Estimated Year | 2026 |
| Forecast Period | 2026-2034 |
| Historical Period | 2020-2025 |
| Growth Rate | CAGR of 5.47% from 2020-2034 |
| Segmentation |
|
Table of Contents
- 1. Introduction
- 1.1. Research Scope
- 1.2. Market Segmentation
- 1.3. Research Objective
- 1.4. Definitions and Assumptions
- 2. Executive Summary
- 2.1. Market Snapshot
- 3. Market Dynamics
- 3.1. Market Drivers
- 3.2. Market Restrains
- 3.3. Market Trends
- 3.4. Market Opportunities
- 4. Market Factor Analysis
- 4.1. Porters Five Forces
- 4.1.1. Bargaining Power of Suppliers
- 4.1.2. Bargaining Power of Buyers
- 4.1.3. Threat of New Entrants
- 4.1.4. Threat of Substitutes
- 4.1.5. Competitive Rivalry
- 4.2. PESTEL analysis
- 4.3. BCG Analysis
- 4.3.1. Stars (High Growth, High Market Share)
- 4.3.2. Cash Cows (Low Growth, High Market Share)
- 4.3.3. Question Mark (High Growth, Low Market Share)
- 4.3.4. Dogs (Low Growth, Low Market Share)
- 4.4. Ansoff Matrix Analysis
- 4.5. Supply Chain Analysis
- 4.6. Regulatory Landscape
- 4.7. Current Market Potential and Opportunity Assessment (TAM–SAM–SOM Framework)
- 4.8. DMV Analyst Note
- 4.1. Porters Five Forces
- 5. Market Analysis, Insights and Forecast 2021-2033
- 5.1. Market Analysis, Insights and Forecast - by End User
- 5.1.1. Residential
- 5.1.2. Commercial
- 5.1.3. Industrial
- 5.1.4. Other End Users
- 5.2. Market Analysis, Insights and Forecast - by Region
- 5.2.1. North America
- 5.2.2. South America
- 5.2.3. Europe
- 5.2.4. Middle East & Africa
- 5.2.5. Asia Pacific
- 5.1. Market Analysis, Insights and Forecast - by End User
- 6. Global Pneumatic Waste Management System In GCC Analysis, Insights and Forecast, 2021-2033
- 6.1. Market Analysis, Insights and Forecast - by End User
- 6.1.1. Residential
- 6.1.2. Commercial
- 6.1.3. Industrial
- 6.1.4. Other End Users
- 6.1. Market Analysis, Insights and Forecast - by End User
- 7. North America Pneumatic Waste Management System In GCC Analysis, Insights and Forecast, 2020-2032
- 7.1. Market Analysis, Insights and Forecast - by End User
- 7.1.1. Residential
- 7.1.2. Commercial
- 7.1.3. Industrial
- 7.1.4. Other End Users
- 7.1. Market Analysis, Insights and Forecast - by End User
- 8. South America Pneumatic Waste Management System In GCC Analysis, Insights and Forecast, 2020-2032
- 8.1. Market Analysis, Insights and Forecast - by End User
- 8.1.1. Residential
- 8.1.2. Commercial
- 8.1.3. Industrial
- 8.1.4. Other End Users
- 8.1. Market Analysis, Insights and Forecast - by End User
- 9. Europe Pneumatic Waste Management System In GCC Analysis, Insights and Forecast, 2020-2032
- 9.1. Market Analysis, Insights and Forecast - by End User
- 9.1.1. Residential
- 9.1.2. Commercial
- 9.1.3. Industrial
- 9.1.4. Other End Users
- 9.1. Market Analysis, Insights and Forecast - by End User
- 10. Middle East & Africa Pneumatic Waste Management System In GCC Analysis, Insights and Forecast, 2020-2032
- 10.1. Market Analysis, Insights and Forecast - by End User
- 10.1.1. Residential
- 10.1.2. Commercial
- 10.1.3. Industrial
- 10.1.4. Other End Users
- 10.1. Market Analysis, Insights and Forecast - by End User
- 11. Asia Pacific Pneumatic Waste Management System In GCC Analysis, Insights and Forecast, 2020-2032
- 11.1. Market Analysis, Insights and Forecast - by End User
- 11.1.1. Residential
- 11.1.2. Commercial
- 11.1.3. Industrial
- 11.1.4. Other End Users
- 11.1. Market Analysis, Insights and Forecast - by End User
- 12. Competitive Analysis
- 12.1. Company Profiles
- 12.1.1 Marimatic
- 12.1.1.1. Company Overview
- 12.1.1.2. Products
- 12.1.1.3. Company Financials
- 12.1.1.4. SWOT Analysis
- 12.1.2 ENVAC
- 12.1.2.1. Company Overview
- 12.1.2.2. Products
- 12.1.2.3. Company Financials
- 12.1.2.4. SWOT Analysis
- 12.1.3 URD
- 12.1.3.1. Company Overview
- 12.1.3.2. Products
- 12.1.3.3. Company Financials
- 12.1.3.4. SWOT Analysis
- 12.1.4 Stream
- 12.1.4.1. Company Overview
- 12.1.4.2. Products
- 12.1.4.3. Company Financials
- 12.1.4.4. SWOT Analysis
- 12.1.5 ATREO
- 12.1.5.1. Company Overview
- 12.1.5.2. Products
- 12.1.5.3. Company Financials
- 12.1.5.4. SWOT Analysis
- 12.1.6 Ros Roca envirotec
- 12.1.6.1. Company Overview
- 12.1.6.2. Products
- 12.1.6.3. Company Financials
- 12.1.6.4. SWOT Analysis
- 12.1.7 Peakway Environmental Sci & Tech Co Ltd
- 12.1.7.1. Company Overview
- 12.1.7.2. Products
- 12.1.7.3. Company Financials
- 12.1.7.4. SWOT Analysis
- 12.1.8 Aerbin ApS
- 12.1.8.1. Company Overview
- 12.1.8.2. Products
- 12.1.8.3. Company Financials
- 12.1.8.4. SWOT Analysis
- 12.1.9 Urban Refuse Development
- 12.1.9.1. Company Overview
- 12.1.9.2. Products
- 12.1.9.3. Company Financials
- 12.1.9.4. SWOT Analysis
- 12.1.10 Logiwaste AB**List Not Exhaustive 7 3 Other Companie
- 12.1.10.1. Company Overview
- 12.1.10.2. Products
- 12.1.10.3. Company Financials
- 12.1.10.4. SWOT Analysis
- 12.1.1 Marimatic
- 12.2. Market Entropy
- 12.2.1 Company's Key Areas Served
- 12.2.2 Recent Developments
- 12.3. Company Market Share Analysis 2025
- 12.3.1 Top 5 Companies Market Share Analysis
- 12.3.2 Top 3 Companies Market Share Analysis
- 12.4. List of Potential Customers
- 13. Research Methodology
List of Figures
- Figure 1: Global Pneumatic Waste Management System In GCC Revenue Breakdown (Million, %) by Region 2025 & 2033
- Figure 2: Global Pneumatic Waste Management System In GCC Volume Breakdown (Million, %) by Region 2025 & 2033
- Figure 3: North America Pneumatic Waste Management System In GCC Revenue (Million), by End User 2025 & 2033
- Figure 4: North America Pneumatic Waste Management System In GCC Volume (Million), by End User 2025 & 2033
- Figure 5: North America Pneumatic Waste Management System In GCC Revenue Share (%), by End User 2025 & 2033
- Figure 6: North America Pneumatic Waste Management System In GCC Volume Share (%), by End User 2025 & 2033
- Figure 7: North America Pneumatic Waste Management System In GCC Revenue (Million), by Country 2025 & 2033
- Figure 8: North America Pneumatic Waste Management System In GCC Volume (Million), by Country 2025 & 2033
- Figure 9: North America Pneumatic Waste Management System In GCC Revenue Share (%), by Country 2025 & 2033
- Figure 10: North America Pneumatic Waste Management System In GCC Volume Share (%), by Country 2025 & 2033
- Figure 11: South America Pneumatic Waste Management System In GCC Revenue (Million), by End User 2025 & 2033
- Figure 12: South America Pneumatic Waste Management System In GCC Volume (Million), by End User 2025 & 2033
- Figure 13: South America Pneumatic Waste Management System In GCC Revenue Share (%), by End User 2025 & 2033
- Figure 14: South America Pneumatic Waste Management System In GCC Volume Share (%), by End User 2025 & 2033
- Figure 15: South America Pneumatic Waste Management System In GCC Revenue (Million), by Country 2025 & 2033
- Figure 16: South America Pneumatic Waste Management System In GCC Volume (Million), by Country 2025 & 2033
- Figure 17: South America Pneumatic Waste Management System In GCC Revenue Share (%), by Country 2025 & 2033
- Figure 18: South America Pneumatic Waste Management System In GCC Volume Share (%), by Country 2025 & 2033
- Figure 19: Europe Pneumatic Waste Management System In GCC Revenue (Million), by End User 2025 & 2033
- Figure 20: Europe Pneumatic Waste Management System In GCC Volume (Million), by End User 2025 & 2033
- Figure 21: Europe Pneumatic Waste Management System In GCC Revenue Share (%), by End User 2025 & 2033
- Figure 22: Europe Pneumatic Waste Management System In GCC Volume Share (%), by End User 2025 & 2033
- Figure 23: Europe Pneumatic Waste Management System In GCC Revenue (Million), by Country 2025 & 2033
- Figure 24: Europe Pneumatic Waste Management System In GCC Volume (Million), by Country 2025 & 2033
- Figure 25: Europe Pneumatic Waste Management System In GCC Revenue Share (%), by Country 2025 & 2033
- Figure 26: Europe Pneumatic Waste Management System In GCC Volume Share (%), by Country 2025 & 2033
- Figure 27: Middle East & Africa Pneumatic Waste Management System In GCC Revenue (Million), by End User 2025 & 2033
- Figure 28: Middle East & Africa Pneumatic Waste Management System In GCC Volume (Million), by End User 2025 & 2033
- Figure 29: Middle East & Africa Pneumatic Waste Management System In GCC Revenue Share (%), by End User 2025 & 2033
- Figure 30: Middle East & Africa Pneumatic Waste Management System In GCC Volume Share (%), by End User 2025 & 2033
- Figure 31: Middle East & Africa Pneumatic Waste Management System In GCC Revenue (Million), by Country 2025 & 2033
- Figure 32: Middle East & Africa Pneumatic Waste Management System In GCC Volume (Million), by Country 2025 & 2033
- Figure 33: Middle East & Africa Pneumatic Waste Management System In GCC Revenue Share (%), by Country 2025 & 2033
- Figure 34: Middle East & Africa Pneumatic Waste Management System In GCC Volume Share (%), by Country 2025 & 2033
- Figure 35: Asia Pacific Pneumatic Waste Management System In GCC Revenue (Million), by End User 2025 & 2033
- Figure 36: Asia Pacific Pneumatic Waste Management System In GCC Volume (Million), by End User 2025 & 2033
- Figure 37: Asia Pacific Pneumatic Waste Management System In GCC Revenue Share (%), by End User 2025 & 2033
- Figure 38: Asia Pacific Pneumatic Waste Management System In GCC Volume Share (%), by End User 2025 & 2033
- Figure 39: Asia Pacific Pneumatic Waste Management System In GCC Revenue (Million), by Country 2025 & 2033
- Figure 40: Asia Pacific Pneumatic Waste Management System In GCC Volume (Million), by Country 2025 & 2033
- Figure 41: Asia Pacific Pneumatic Waste Management System In GCC Revenue Share (%), by Country 2025 & 2033
- Figure 42: Asia Pacific Pneumatic Waste Management System In GCC Volume Share (%), by Country 2025 & 2033
List of Tables
- Table 1: Global Pneumatic Waste Management System In GCC Revenue Million Forecast, by End User 2020 & 2033
- Table 2: Global Pneumatic Waste Management System In GCC Volume Million Forecast, by End User 2020 & 2033
- Table 3: Global Pneumatic Waste Management System In GCC Revenue Million Forecast, by Region 2020 & 2033
- Table 4: Global Pneumatic Waste Management System In GCC Volume Million Forecast, by Region 2020 & 2033
- Table 5: Global Pneumatic Waste Management System In GCC Revenue Million Forecast, by End User 2020 & 2033
- Table 6: Global Pneumatic Waste Management System In GCC Volume Million Forecast, by End User 2020 & 2033
- Table 7: Global Pneumatic Waste Management System In GCC Revenue Million Forecast, by Country 2020 & 2033
- Table 8: Global Pneumatic Waste Management System In GCC Volume Million Forecast, by Country 2020 & 2033
- Table 9: United States Pneumatic Waste Management System In GCC Revenue (Million) Forecast, by Application 2020 & 2033
- Table 10: United States Pneumatic Waste Management System In GCC Volume (Million) Forecast, by Application 2020 & 2033
- Table 11: Canada Pneumatic Waste Management System In GCC Revenue (Million) Forecast, by Application 2020 & 2033
- Table 12: Canada Pneumatic Waste Management System In GCC Volume (Million) Forecast, by Application 2020 & 2033
- Table 13: Mexico Pneumatic Waste Management System In GCC Revenue (Million) Forecast, by Application 2020 & 2033
- Table 14: Mexico Pneumatic Waste Management System In GCC Volume (Million) Forecast, by Application 2020 & 2033
- Table 15: Global Pneumatic Waste Management System In GCC Revenue Million Forecast, by End User 2020 & 2033
- Table 16: Global Pneumatic Waste Management System In GCC Volume Million Forecast, by End User 2020 & 2033
- Table 17: Global Pneumatic Waste Management System In GCC Revenue Million Forecast, by Country 2020 & 2033
- Table 18: Global Pneumatic Waste Management System In GCC Volume Million Forecast, by Country 2020 & 2033
- Table 19: Brazil Pneumatic Waste Management System In GCC Revenue (Million) Forecast, by Application 2020 & 2033
- Table 20: Brazil Pneumatic Waste Management System In GCC Volume (Million) Forecast, by Application 2020 & 2033
- Table 21: Argentina Pneumatic Waste Management System In GCC Revenue (Million) Forecast, by Application 2020 & 2033
- Table 22: Argentina Pneumatic Waste Management System In GCC Volume (Million) Forecast, by Application 2020 & 2033
- Table 23: Rest of South America Pneumatic Waste Management System In GCC Revenue (Million) Forecast, by Application 2020 & 2033
- Table 24: Rest of South America Pneumatic Waste Management System In GCC Volume (Million) Forecast, by Application 2020 & 2033
- Table 25: Global Pneumatic Waste Management System In GCC Revenue Million Forecast, by End User 2020 & 2033
- Table 26: Global Pneumatic Waste Management System In GCC Volume Million Forecast, by End User 2020 & 2033
- Table 27: Global Pneumatic Waste Management System In GCC Revenue Million Forecast, by Country 2020 & 2033
- Table 28: Global Pneumatic Waste Management System In GCC Volume Million Forecast, by Country 2020 & 2033
- Table 29: United Kingdom Pneumatic Waste Management System In GCC Revenue (Million) Forecast, by Application 2020 & 2033
- Table 30: United Kingdom Pneumatic Waste Management System In GCC Volume (Million) Forecast, by Application 2020 & 2033
- Table 31: Germany Pneumatic Waste Management System In GCC Revenue (Million) Forecast, by Application 2020 & 2033
- Table 32: Germany Pneumatic Waste Management System In GCC Volume (Million) Forecast, by Application 2020 & 2033
- Table 33: France Pneumatic Waste Management System In GCC Revenue (Million) Forecast, by Application 2020 & 2033
- Table 34: France Pneumatic Waste Management System In GCC Volume (Million) Forecast, by Application 2020 & 2033
- Table 35: Italy Pneumatic Waste Management System In GCC Revenue (Million) Forecast, by Application 2020 & 2033
- Table 36: Italy Pneumatic Waste Management System In GCC Volume (Million) Forecast, by Application 2020 & 2033
- Table 37: Spain Pneumatic Waste Management System In GCC Revenue (Million) Forecast, by Application 2020 & 2033
- Table 38: Spain Pneumatic Waste Management System In GCC Volume (Million) Forecast, by Application 2020 & 2033
- Table 39: Russia Pneumatic Waste Management System In GCC Revenue (Million) Forecast, by Application 2020 & 2033
- Table 40: Russia Pneumatic Waste Management System In GCC Volume (Million) Forecast, by Application 2020 & 2033
- Table 41: Benelux Pneumatic Waste Management System In GCC Revenue (Million) Forecast, by Application 2020 & 2033
- Table 42: Benelux Pneumatic Waste Management System In GCC Volume (Million) Forecast, by Application 2020 & 2033
- Table 43: Nordics Pneumatic Waste Management System In GCC Revenue (Million) Forecast, by Application 2020 & 2033
- Table 44: Nordics Pneumatic Waste Management System In GCC Volume (Million) Forecast, by Application 2020 & 2033
- Table 45: Rest of Europe Pneumatic Waste Management System In GCC Revenue (Million) Forecast, by Application 2020 & 2033
- Table 46: Rest of Europe Pneumatic Waste Management System In GCC Volume (Million) Forecast, by Application 2020 & 2033
- Table 47: Global Pneumatic Waste Management System In GCC Revenue Million Forecast, by End User 2020 & 2033
- Table 48: Global Pneumatic Waste Management System In GCC Volume Million Forecast, by End User 2020 & 2033
- Table 49: Global Pneumatic Waste Management System In GCC Revenue Million Forecast, by Country 2020 & 2033
- Table 50: Global Pneumatic Waste Management System In GCC Volume Million Forecast, by Country 2020 & 2033
- Table 51: Turkey Pneumatic Waste Management System In GCC Revenue (Million) Forecast, by Application 2020 & 2033
- Table 52: Turkey Pneumatic Waste Management System In GCC Volume (Million) Forecast, by Application 2020 & 2033
- Table 53: Israel Pneumatic Waste Management System In GCC Revenue (Million) Forecast, by Application 2020 & 2033
- Table 54: Israel Pneumatic Waste Management System In GCC Volume (Million) Forecast, by Application 2020 & 2033
- Table 55: GCC Pneumatic Waste Management System In GCC Revenue (Million) Forecast, by Application 2020 & 2033
- Table 56: GCC Pneumatic Waste Management System In GCC Volume (Million) Forecast, by Application 2020 & 2033
- Table 57: North Africa Pneumatic Waste Management System In GCC Revenue (Million) Forecast, by Application 2020 & 2033
- Table 58: North Africa Pneumatic Waste Management System In GCC Volume (Million) Forecast, by Application 2020 & 2033
- Table 59: South Africa Pneumatic Waste Management System In GCC Revenue (Million) Forecast, by Application 2020 & 2033
- Table 60: South Africa Pneumatic Waste Management System In GCC Volume (Million) Forecast, by Application 2020 & 2033
- Table 61: Rest of Middle East & Africa Pneumatic Waste Management System In GCC Revenue (Million) Forecast, by Application 2020 & 2033
- Table 62: Rest of Middle East & Africa Pneumatic Waste Management System In GCC Volume (Million) Forecast, by Application 2020 & 2033
- Table 63: Global Pneumatic Waste Management System In GCC Revenue Million Forecast, by End User 2020 & 2033
- Table 64: Global Pneumatic Waste Management System In GCC Volume Million Forecast, by End User 2020 & 2033
- Table 65: Global Pneumatic Waste Management System In GCC Revenue Million Forecast, by Country 2020 & 2033
- Table 66: Global Pneumatic Waste Management System In GCC Volume Million Forecast, by Country 2020 & 2033
- Table 67: China Pneumatic Waste Management System In GCC Revenue (Million) Forecast, by Application 2020 & 2033
- Table 68: China Pneumatic Waste Management System In GCC Volume (Million) Forecast, by Application 2020 & 2033
- Table 69: India Pneumatic Waste Management System In GCC Revenue (Million) Forecast, by Application 2020 & 2033
- Table 70: India Pneumatic Waste Management System In GCC Volume (Million) Forecast, by Application 2020 & 2033
- Table 71: Japan Pneumatic Waste Management System In GCC Revenue (Million) Forecast, by Application 2020 & 2033
- Table 72: Japan Pneumatic Waste Management System In GCC Volume (Million) Forecast, by Application 2020 & 2033
- Table 73: South Korea Pneumatic Waste Management System In GCC Revenue (Million) Forecast, by Application 2020 & 2033
- Table 74: South Korea Pneumatic Waste Management System In GCC Volume (Million) Forecast, by Application 2020 & 2033
- Table 75: ASEAN Pneumatic Waste Management System In GCC Revenue (Million) Forecast, by Application 2020 & 2033
- Table 76: ASEAN Pneumatic Waste Management System In GCC Volume (Million) Forecast, by Application 2020 & 2033
- Table 77: Oceania Pneumatic Waste Management System In GCC Revenue (Million) Forecast, by Application 2020 & 2033
- Table 78: Oceania Pneumatic Waste Management System In GCC Volume (Million) Forecast, by Application 2020 & 2033
- Table 79: Rest of Asia Pacific Pneumatic Waste Management System In GCC Revenue (Million) Forecast, by Application 2020 & 2033
- Table 80: Rest of Asia Pacific Pneumatic Waste Management System In GCC Volume (Million) Forecast, by Application 2020 & 2033
Frequently Asked Questions
1. What is the projected Compound Annual Growth Rate (CAGR) of the Pneumatic Waste Management System In GCC?
The projected CAGR is approximately 5.47%.
2. Which companies are prominent players in the Pneumatic Waste Management System In GCC?
Key companies in the market include Marimatic, ENVAC, URD, Stream, ATREO, Ros Roca envirotec, Peakway Environmental Sci & Tech Co Ltd, Aerbin ApS, Urban Refuse Development, Logiwaste AB**List Not Exhaustive 7 3 Other Companie.
3. What are the main segments of the Pneumatic Waste Management System In GCC?
The market segments include End User.
4. Can you provide details about the market size?
The market size is estimated to be USD 23.80 Million as of 2022.
5. What are some drivers contributing to market growth?
Increase in Waste Generation; Government Initiatives in Waste Management; Increasing Construction of Smart Cities.
6. What are the notable trends driving market growth?
Increasing Demand for Pneumatic Waste Management Systems in Saudi Arabia is Driving the Market.
7. Are there any restraints impacting market growth?
Increase in Waste Generation; Government Initiatives in Waste Management; Increasing Construction of Smart Cities.
8. Can you provide examples of recent developments in the market?
August 2023: Akam, a subsidiary of the Saudi Investment Company for Recycling (SIRC Group), partnered with Alawalya Qatar for Primary Materials. This collaboration focuses on the technical aspects of demolition and construction waste sorting and reviews past contracts. It also includes analyzing recycled soil debris and powder for reuse in fertilization and road paving, exchanging scientific research, and setting Qatari standards for recycled materials. The partnership may extend to other waste sectors, such as metals and tires.
9. What pricing options are available for accessing the report?
Pricing options include single-user, multi-user, and enterprise licenses priced at USD 3800, USD 4500, and USD 5800 respectively.
10. Is the market size provided in terms of value or volume?
The market size is provided in terms of value, measured in Million and volume, measured in Million.
11. Are there any specific market keywords associated with the report?
Yes, the market keyword associated with the report is "Pneumatic Waste Management System In GCC," which aids in identifying and referencing the specific market segment covered.
12. How do I determine which pricing option suits my needs best?
The pricing options vary based on user requirements and access needs. Individual users may opt for single-user licenses, while businesses requiring broader access may choose multi-user or enterprise licenses for cost-effective access to the report.
13. Are there any additional resources or data provided in the Pneumatic Waste Management System In GCC report?
While the report offers comprehensive insights, it's advisable to review the specific contents or supplementary materials provided to ascertain if additional resources or data are available.
14. How can I stay updated on further developments or reports in the Pneumatic Waste Management System In GCC?
To stay informed about further developments, trends, and reports in the Pneumatic Waste Management System In GCC, consider subscribing to industry newsletters, following relevant companies and organizations, or regularly checking reputable industry news sources and publications.
Methodology
Step 1 - Identification of Relevant Samples Size from Population Database


Step 2 - Approaches for Defining Global Market Size (Value, Volume* & Price*)

Note*: In applicable scenarios
Step 3 - Data Sources
Primary Research
- Web Analytics
- Survey Reports
- Research Institute
- Latest Research Reports
- Opinion Leaders
Secondary Research
- Annual Reports
- White Paper
- Latest Press Release
- Industry Association
- Paid Database
- Investor Presentations

Step 4 - Data Triangulation
Involves using different sources of information in order to increase the validity of a study
These sources are likely to be stakeholders in a program - participants, other researchers, program staff, other community members, and so on.
Then we put all data in single framework & apply various statistical tools to find out the dynamic on the market.
During the analysis stage, feedback from the stakeholder groups would be compared to determine areas of agreement as well as areas of divergence