

Key Insights
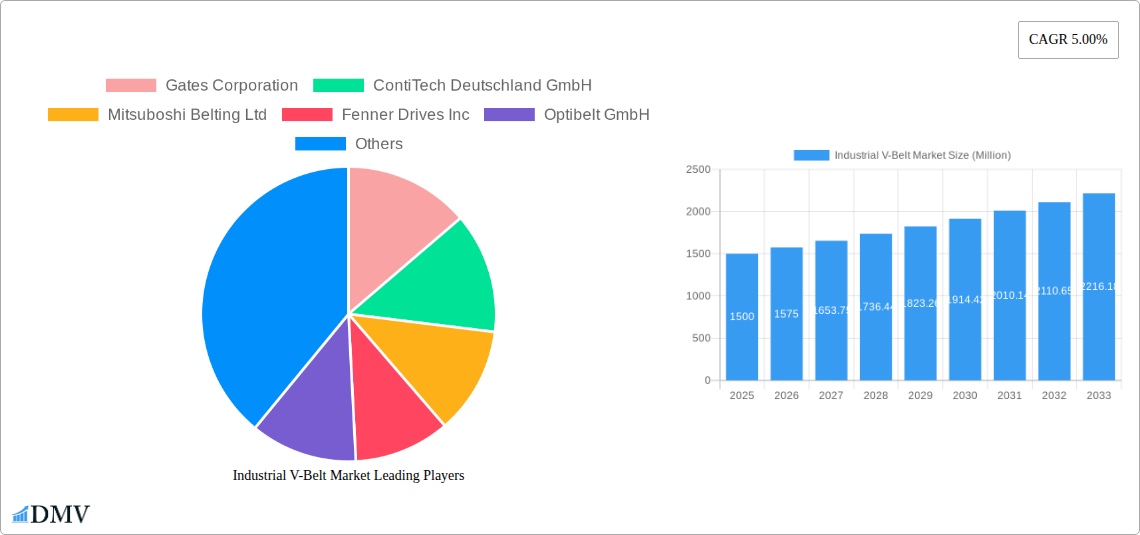
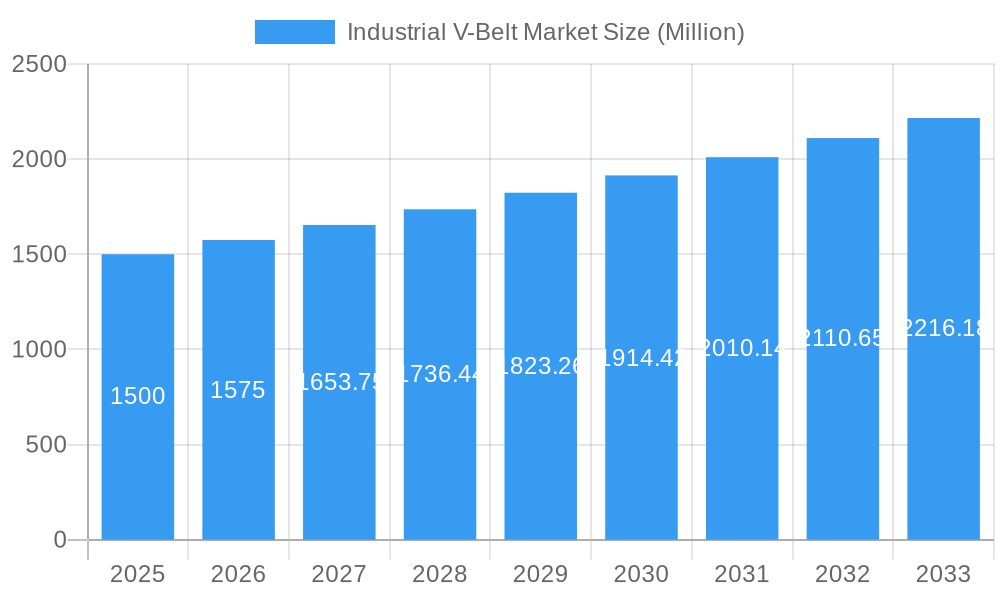
The global industrial V-belt market, valued at $1.5 billion in 2025, is projected to experience robust growth, driven by the increasing automation across various industries and the rising demand for efficient power transmission systems. The market's Compound Annual Growth Rate (CAGR) of 5% from 2025 to 2033 indicates a steady expansion, fueled by several key factors. The automotive sector, a major consumer of industrial V-belts, is expected to contribute significantly to market growth, driven by the increasing production of vehicles globally. Furthermore, the growth of the manufacturing and processing industries, coupled with the adoption of advanced technologies that rely on efficient power transmission, will contribute to the market's expansion. The demand for high-performance V-belts with improved durability and efficiency will also drive innovation and propel market growth. While potential economic downturns could pose a temporary restraint, the long-term outlook for the industrial V-belt market remains positive, given the continued industrialization and automation trends across major economies.
Industrial V-Belt Market Market Size (In Billion)
The market is segmented based on material type (e.g., rubber, polyurethane, composite), application (e.g., automotive, agricultural machinery, industrial machinery), and region. Key players such as Gates Corporation, ContiTech, and Mitsuboshi Belting are investing heavily in research and development to enhance their product offerings and expand their market share. Competitive dynamics are characterized by product differentiation, technological advancements, and strategic partnerships. Companies are focusing on offering customized solutions to meet specific industrial needs, leading to increased demand for specialized V-belts. The growing focus on sustainability is also driving the adoption of eco-friendly materials and manufacturing processes within the industry. Despite potential challenges from alternative power transmission technologies, the established reliability and cost-effectiveness of V-belts ensure their continued relevance in numerous applications.
Industrial V-Belt Market Company Market Share
Industrial V-Belt Market: A Comprehensive Market Report (2019-2033)
This insightful report provides a detailed analysis of the Industrial V-Belt market, offering a comprehensive overview of market dynamics, key players, and future growth prospects. Covering the period from 2019 to 2033, with a focus on 2025, this report is an essential resource for stakeholders seeking to understand and capitalize on the opportunities within this dynamic sector. The market is projected to reach xx Million by 2033.
Industrial V-Belt Market Composition & Trends
The global Industrial V-Belt market is characterized by a moderately concentrated landscape, with key players holding significant market share. The market share distribution amongst the top players, including Gates Corporation, ContiTech Deutschland GmbH, and Mitsuboshi Belting Ltd., fluctuates based on technological advancements, pricing strategies, and regional market penetration. Innovation is a crucial driver, with continuous improvements in materials science (like the shift to ethylene elastomer compounds), manufacturing processes, and belt designs leading to enhanced efficiency and durability. Stringent regulatory frameworks, particularly concerning material safety and environmental impact, also shape market practices. Substitute products, such as timing belts and chain drives, pose competitive challenges, while the growing adoption of automation across various industries fuels demand. Furthermore, M&A activities, though not frequent, impact market consolidation and technological integration, with recent deals estimated to be valued at approximately xx Million.
- Market Concentration: Moderately concentrated, with top players commanding significant shares.
- Innovation Catalysts: Advancements in materials (e.g., ethylene elastomer), design, and manufacturing processes.
- Regulatory Landscape: Stringent regulations concerning safety and environmental impact.
- Substitute Products: Timing belts and chain drives.
- End-User Profiles: Diverse, spanning automotive, industrial machinery, and agriculture.
- M&A Activities: Infrequent but impactful, with estimated deal values around xx Million.
Industrial V-Belt Market Industry Evolution
The Industrial V-Belt market exhibits a steady growth trajectory, driven by increasing industrialization and automation across diverse sectors. From 2019 to 2024, the market experienced a Compound Annual Growth Rate (CAGR) of xx%, largely attributable to the rising demand for efficient power transmission solutions in manufacturing, automotive, and agricultural applications. Technological advancements, such as the development of high-capacity, molded-notch V-belts with enhanced durability and efficiency, are further accelerating market expansion. Shifting consumer demands towards longer-lasting, eco-friendly, and cost-effective belts are also influencing product development and market trends. The market is anticipated to witness continued growth, reaching xx Million by 2033, driven by ongoing industrial automation and the adoption of more advanced V-belt technologies. Specific adoption metrics for advanced materials like EE compounds are currently unavailable but are anticipated to increase significantly in the forecast period.
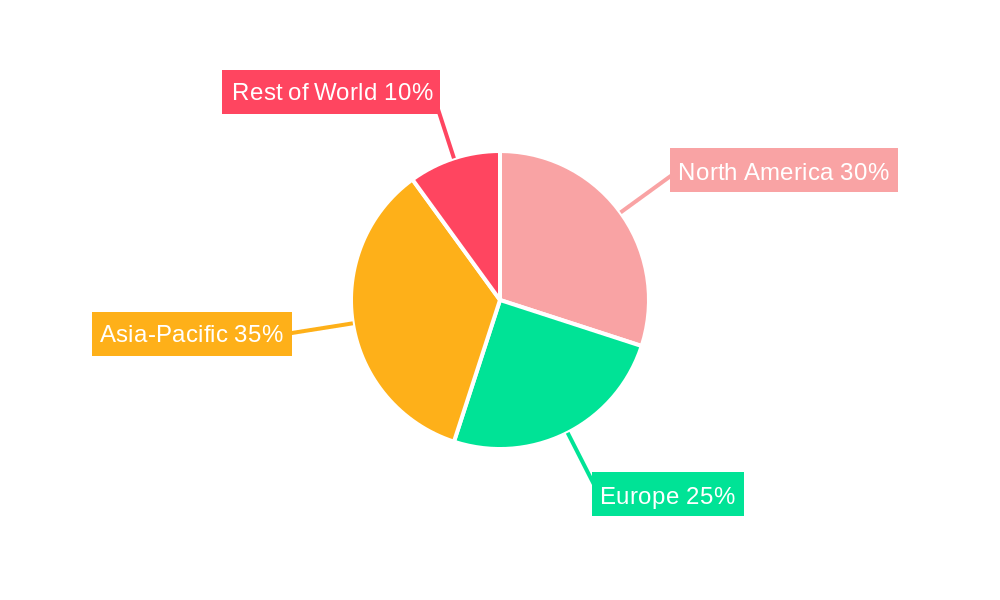
Leading Regions, Countries, or Segments in Industrial V-Belt Market
North America and Europe currently dominate the Industrial V-Belt market, driven by established industrial sectors and high technological adoption rates. However, the Asia-Pacific region is experiencing rapid growth, propelled by the expansion of manufacturing capabilities and industrialization efforts in developing economies.
- Key Drivers (North America & Europe): Strong industrial base, high technological adoption, stringent quality standards, and established distribution networks.
- Key Drivers (Asia-Pacific): Rapid industrialization, growing automotive sector, increasing infrastructure development, and cost-competitive manufacturing.
- Dominance Factors: Established industrial infrastructure, technological innovation, high consumer demand, and supportive government policies.
Industrial V-Belt Market Product Innovations
Recent innovations in the Industrial V-Belt market focus on enhanced durability, efficiency, and reduced noise levels. The introduction of advanced materials like ethylene elastomer (EE) compounds offers superior resistance to heat, wear, and chemicals, extending belt lifespan and improving operational performance. Molded-notch designs contribute to quieter operation and increased power transmission efficiency. These improvements cater to the growing demand for high-performance, cost-effective solutions in diverse industrial settings. The unique selling proposition (USP) for many of these new belts is improved lifespan and reduced maintenance costs.
Propelling Factors for Industrial V-Belt Market Growth
Technological advancements, such as the development of high-performance materials (like EE compounds) and enhanced belt designs, are key growth drivers. Economic factors, including increasing industrial output and infrastructure development, further stimulate demand. Supportive government policies that promote industrial automation and energy efficiency also contribute to market expansion. For example, government incentives for energy-efficient machinery indirectly boost V-belt demand.
Obstacles in the Industrial V-Belt Market
Fluctuations in raw material prices and supply chain disruptions pose significant challenges to manufacturers, impacting production costs and delivery timelines. Intense competition among established players and the entry of new market entrants create price pressures. Regulatory compliance requirements add to the operational costs, and the availability of substitute technologies (timing belts, chain drives) presents competitive pressure.
Future Opportunities in Industrial V-Belt Market
The increasing adoption of automation and robotics in diverse industrial sectors creates significant growth opportunities. The expansion into emerging markets, particularly in Asia-Pacific, presents untapped potential. The development of more sustainable and eco-friendly materials will further drive market expansion. Focusing on niche applications and specialized belt designs can also create market niches for innovation.
Major Players in the Industrial V-Belt Market Ecosystem
- Gates Corporation
- ContiTech Deutschland GmbH
- Mitsuboshi Belting Ltd
- Fenner Drives Inc
- Optibelt GmbH
- Bando Chemical Industries Ltd
- SFK Group
- Hutchinson
- PIX Transmissions Ltd
- Timken Belts
- Zhejiang Sanlux Rubber Co Ltd
- PowerDrive LLC
- BEHA Innovation GmbH
- *List Not Exhaustive
Key Developments in Industrial V-Belt Market Industry
- August 2024: Gates Corporation announces the transition of its Super High Capacity (HC) Molded Notch (MN) V-belt composition from chloroprene rubber (CR) to advanced ethylene elastomer (EE) compounds, enhancing performance and durability. The company also began producing EE Tri-Power V-belts in Europe, improving availability and reducing lead times.
- March 2024: Dayco Inc. opens a new plant in San Luis Potosí, Mexico, with the capacity to produce up to 4.2 Million Poly-V belts annually for the automotive sector, emphasizing quieter and more efficient molded tooth design.
Strategic Industrial V-Belt Market Forecast
The Industrial V-Belt market is poised for continued growth, driven by ongoing industrial automation, expansion into new markets, and advancements in materials and design. The increasing demand for efficient and durable power transmission solutions across various industries will further propel market expansion. The adoption of innovative materials such as EE compounds and the ongoing investment in production capacity will play a crucial role in shaping market dynamics in the coming years. The market is expected to witness a significant increase in market value during the forecast period.
Industrial V-Belt Market Segmentation
-
1. Type
- 1.1. Classical V-belt
- 1.2. Narrow V-belt
- 1.3. Wedge V-belt
- 1.4. Banded V-belt
-
2. Material
- 2.1. Rubber Belt
- 2.2. Polyurethane V-belt
- 2.3. Neoprene V-belt
-
3. End-user Vertical
- 3.1. Automotive Industry
- 3.2. Agriculture
- 3.3. Mining and Quarrying
- 3.4. Manufacturing
- 3.5. Construction
- 3.6. HVAC Systems
Industrial V-Belt Market Segmentation By Geography
- 1. North America
- 2. Europe
- 3. Asia
- 4. Australia and New Zealand
- 5. Latin America
- 6. Middle East and Africa
Industrial V-Belt Market Regional Market Share
Geographic Coverage of Industrial V-Belt Market
Industrial V-Belt Market REPORT HIGHLIGHTS
| Aspects | Details |
|---|---|
| Study Period | 2020-2034 |
| Base Year | 2025 |
| Estimated Year | 2026 |
| Forecast Period | 2026-2034 |
| Historical Period | 2020-2025 |
| Growth Rate | CAGR of 5.00% from 2020-2034 |
| Segmentation |
|
Table of Contents
- 1. Introduction
- 1.1. Research Scope
- 1.2. Market Segmentation
- 1.3. Research Objective
- 1.4. Definitions and Assumptions
- 2. Executive Summary
- 2.1. Market Snapshot
- 3. Market Dynamics
- 3.1. Market Drivers
- 3.2. Market Restrains
- 3.3. Market Trends
- 3.4. Market Opportunities
- 4. Market Factor Analysis
- 4.1. Porters Five Forces
- 4.1.1. Bargaining Power of Suppliers
- 4.1.2. Bargaining Power of Buyers
- 4.1.3. Threat of New Entrants
- 4.1.4. Threat of Substitutes
- 4.1.5. Competitive Rivalry
- 4.2. PESTEL analysis
- 4.3. BCG Analysis
- 4.3.1. Stars (High Growth, High Market Share)
- 4.3.2. Cash Cows (Low Growth, High Market Share)
- 4.3.3. Question Mark (High Growth, Low Market Share)
- 4.3.4. Dogs (Low Growth, Low Market Share)
- 4.4. Ansoff Matrix Analysis
- 4.5. Supply Chain Analysis
- 4.6. Regulatory Landscape
- 4.7. Current Market Potential and Opportunity Assessment (TAM–SAM–SOM Framework)
- 4.8. DMV Analyst Note
- 4.1. Porters Five Forces
- 5. Market Analysis, Insights and Forecast 2021-2033
- 5.1. Market Analysis, Insights and Forecast - by Type
- 5.1.1. Classical V-belt
- 5.1.2. Narrow V-belt
- 5.1.3. Wedge V-belt
- 5.1.4. Banded V-belt
- 5.2. Market Analysis, Insights and Forecast - by Material
- 5.2.1. Rubber Belt
- 5.2.2. Polyurethane V-belt
- 5.2.3. Neoprene V-belt
- 5.3. Market Analysis, Insights and Forecast - by End-user Vertical
- 5.3.1. Automotive Industry
- 5.3.2. Agriculture
- 5.3.3. Mining and Quarrying
- 5.3.4. Manufacturing
- 5.3.5. Construction
- 5.3.6. HVAC Systems
- 5.4. Market Analysis, Insights and Forecast - by Region
- 5.4.1. North America
- 5.4.2. Europe
- 5.4.3. Asia
- 5.4.4. Australia and New Zealand
- 5.4.5. Latin America
- 5.4.6. Middle East and Africa
- 5.1. Market Analysis, Insights and Forecast - by Type
- 6. Global Industrial V-Belt Market Analysis, Insights and Forecast, 2021-2033
- 6.1. Market Analysis, Insights and Forecast - by Type
- 6.1.1. Classical V-belt
- 6.1.2. Narrow V-belt
- 6.1.3. Wedge V-belt
- 6.1.4. Banded V-belt
- 6.2. Market Analysis, Insights and Forecast - by Material
- 6.2.1. Rubber Belt
- 6.2.2. Polyurethane V-belt
- 6.2.3. Neoprene V-belt
- 6.3. Market Analysis, Insights and Forecast - by End-user Vertical
- 6.3.1. Automotive Industry
- 6.3.2. Agriculture
- 6.3.3. Mining and Quarrying
- 6.3.4. Manufacturing
- 6.3.5. Construction
- 6.3.6. HVAC Systems
- 6.1. Market Analysis, Insights and Forecast - by Type
- 7. North America Industrial V-Belt Market Analysis, Insights and Forecast, 2020-2032
- 7.1. Market Analysis, Insights and Forecast - by Type
- 7.1.1. Classical V-belt
- 7.1.2. Narrow V-belt
- 7.1.3. Wedge V-belt
- 7.1.4. Banded V-belt
- 7.2. Market Analysis, Insights and Forecast - by Material
- 7.2.1. Rubber Belt
- 7.2.2. Polyurethane V-belt
- 7.2.3. Neoprene V-belt
- 7.3. Market Analysis, Insights and Forecast - by End-user Vertical
- 7.3.1. Automotive Industry
- 7.3.2. Agriculture
- 7.3.3. Mining and Quarrying
- 7.3.4. Manufacturing
- 7.3.5. Construction
- 7.3.6. HVAC Systems
- 7.1. Market Analysis, Insights and Forecast - by Type
- 8. Europe Industrial V-Belt Market Analysis, Insights and Forecast, 2020-2032
- 8.1. Market Analysis, Insights and Forecast - by Type
- 8.1.1. Classical V-belt
- 8.1.2. Narrow V-belt
- 8.1.3. Wedge V-belt
- 8.1.4. Banded V-belt
- 8.2. Market Analysis, Insights and Forecast - by Material
- 8.2.1. Rubber Belt
- 8.2.2. Polyurethane V-belt
- 8.2.3. Neoprene V-belt
- 8.3. Market Analysis, Insights and Forecast - by End-user Vertical
- 8.3.1. Automotive Industry
- 8.3.2. Agriculture
- 8.3.3. Mining and Quarrying
- 8.3.4. Manufacturing
- 8.3.5. Construction
- 8.3.6. HVAC Systems
- 8.1. Market Analysis, Insights and Forecast - by Type
- 9. Asia Industrial V-Belt Market Analysis, Insights and Forecast, 2020-2032
- 9.1. Market Analysis, Insights and Forecast - by Type
- 9.1.1. Classical V-belt
- 9.1.2. Narrow V-belt
- 9.1.3. Wedge V-belt
- 9.1.4. Banded V-belt
- 9.2. Market Analysis, Insights and Forecast - by Material
- 9.2.1. Rubber Belt
- 9.2.2. Polyurethane V-belt
- 9.2.3. Neoprene V-belt
- 9.3. Market Analysis, Insights and Forecast - by End-user Vertical
- 9.3.1. Automotive Industry
- 9.3.2. Agriculture
- 9.3.3. Mining and Quarrying
- 9.3.4. Manufacturing
- 9.3.5. Construction
- 9.3.6. HVAC Systems
- 9.1. Market Analysis, Insights and Forecast - by Type
- 10. Australia and New Zealand Industrial V-Belt Market Analysis, Insights and Forecast, 2020-2032
- 10.1. Market Analysis, Insights and Forecast - by Type
- 10.1.1. Classical V-belt
- 10.1.2. Narrow V-belt
- 10.1.3. Wedge V-belt
- 10.1.4. Banded V-belt
- 10.2. Market Analysis, Insights and Forecast - by Material
- 10.2.1. Rubber Belt
- 10.2.2. Polyurethane V-belt
- 10.2.3. Neoprene V-belt
- 10.3. Market Analysis, Insights and Forecast - by End-user Vertical
- 10.3.1. Automotive Industry
- 10.3.2. Agriculture
- 10.3.3. Mining and Quarrying
- 10.3.4. Manufacturing
- 10.3.5. Construction
- 10.3.6. HVAC Systems
- 10.1. Market Analysis, Insights and Forecast - by Type
- 11. Latin America Industrial V-Belt Market Analysis, Insights and Forecast, 2020-2032
- 11.1. Market Analysis, Insights and Forecast - by Type
- 11.1.1. Classical V-belt
- 11.1.2. Narrow V-belt
- 11.1.3. Wedge V-belt
- 11.1.4. Banded V-belt
- 11.2. Market Analysis, Insights and Forecast - by Material
- 11.2.1. Rubber Belt
- 11.2.2. Polyurethane V-belt
- 11.2.3. Neoprene V-belt
- 11.3. Market Analysis, Insights and Forecast - by End-user Vertical
- 11.3.1. Automotive Industry
- 11.3.2. Agriculture
- 11.3.3. Mining and Quarrying
- 11.3.4. Manufacturing
- 11.3.5. Construction
- 11.3.6. HVAC Systems
- 11.1. Market Analysis, Insights and Forecast - by Type
- 12. Middle East and Africa Industrial V-Belt Market Analysis, Insights and Forecast, 2020-2032
- 12.1. Market Analysis, Insights and Forecast - by Type
- 12.1.1. Classical V-belt
- 12.1.2. Narrow V-belt
- 12.1.3. Wedge V-belt
- 12.1.4. Banded V-belt
- 12.2. Market Analysis, Insights and Forecast - by Material
- 12.2.1. Rubber Belt
- 12.2.2. Polyurethane V-belt
- 12.2.3. Neoprene V-belt
- 12.3. Market Analysis, Insights and Forecast - by End-user Vertical
- 12.3.1. Automotive Industry
- 12.3.2. Agriculture
- 12.3.3. Mining and Quarrying
- 12.3.4. Manufacturing
- 12.3.5. Construction
- 12.3.6. HVAC Systems
- 12.1. Market Analysis, Insights and Forecast - by Type
- 13. Competitive Analysis
- 13.1. Company Profiles
- 13.1.1 Gates Corporation
- 13.1.1.1. Company Overview
- 13.1.1.2. Products
- 13.1.1.3. Company Financials
- 13.1.1.4. SWOT Analysis
- 13.1.2 ContiTech Deutschland GmbH
- 13.1.2.1. Company Overview
- 13.1.2.2. Products
- 13.1.2.3. Company Financials
- 13.1.2.4. SWOT Analysis
- 13.1.3 Mitsuboshi Belting Ltd
- 13.1.3.1. Company Overview
- 13.1.3.2. Products
- 13.1.3.3. Company Financials
- 13.1.3.4. SWOT Analysis
- 13.1.4 Fenner Drives Inc
- 13.1.4.1. Company Overview
- 13.1.4.2. Products
- 13.1.4.3. Company Financials
- 13.1.4.4. SWOT Analysis
- 13.1.5 Optibelt GmbH
- 13.1.5.1. Company Overview
- 13.1.5.2. Products
- 13.1.5.3. Company Financials
- 13.1.5.4. SWOT Analysis
- 13.1.6 Bando Chemical Industries Ltd
- 13.1.6.1. Company Overview
- 13.1.6.2. Products
- 13.1.6.3. Company Financials
- 13.1.6.4. SWOT Analysis
- 13.1.7 SFK Group
- 13.1.7.1. Company Overview
- 13.1.7.2. Products
- 13.1.7.3. Company Financials
- 13.1.7.4. SWOT Analysis
- 13.1.8 Hutchinson
- 13.1.8.1. Company Overview
- 13.1.8.2. Products
- 13.1.8.3. Company Financials
- 13.1.8.4. SWOT Analysis
- 13.1.9 PIX Transmissions Ltd
- 13.1.9.1. Company Overview
- 13.1.9.2. Products
- 13.1.9.3. Company Financials
- 13.1.9.4. SWOT Analysis
- 13.1.10 Timken Belts
- 13.1.10.1. Company Overview
- 13.1.10.2. Products
- 13.1.10.3. Company Financials
- 13.1.10.4. SWOT Analysis
- 13.1.11 Zhejiang Sanlux Rubber Co Ltd
- 13.1.11.1. Company Overview
- 13.1.11.2. Products
- 13.1.11.3. Company Financials
- 13.1.11.4. SWOT Analysis
- 13.1.12 PowerDrive LLC
- 13.1.12.1. Company Overview
- 13.1.12.2. Products
- 13.1.12.3. Company Financials
- 13.1.12.4. SWOT Analysis
- 13.1.13 BEHA Innovation GmbH*List Not Exhaustive
- 13.1.13.1. Company Overview
- 13.1.13.2. Products
- 13.1.13.3. Company Financials
- 13.1.13.4. SWOT Analysis
- 13.1.1 Gates Corporation
- 13.2. Market Entropy
- 13.2.1 Company's Key Areas Served
- 13.2.2 Recent Developments
- 13.3. Company Market Share Analysis 2025
- 13.3.1 Top 5 Companies Market Share Analysis
- 13.3.2 Top 3 Companies Market Share Analysis
- 13.4. List of Potential Customers
- 14. Research Methodology
List of Figures
- Figure 1: Global Industrial V-Belt Market Revenue Breakdown (Million, %) by Region 2025 & 2033
- Figure 2: Global Industrial V-Belt Market Volume Breakdown (Billion, %) by Region 2025 & 2033
- Figure 3: North America Industrial V-Belt Market Revenue (Million), by Type 2025 & 2033
- Figure 4: North America Industrial V-Belt Market Volume (Billion), by Type 2025 & 2033
- Figure 5: North America Industrial V-Belt Market Revenue Share (%), by Type 2025 & 2033
- Figure 6: North America Industrial V-Belt Market Volume Share (%), by Type 2025 & 2033
- Figure 7: North America Industrial V-Belt Market Revenue (Million), by Material 2025 & 2033
- Figure 8: North America Industrial V-Belt Market Volume (Billion), by Material 2025 & 2033
- Figure 9: North America Industrial V-Belt Market Revenue Share (%), by Material 2025 & 2033
- Figure 10: North America Industrial V-Belt Market Volume Share (%), by Material 2025 & 2033
- Figure 11: North America Industrial V-Belt Market Revenue (Million), by End-user Vertical 2025 & 2033
- Figure 12: North America Industrial V-Belt Market Volume (Billion), by End-user Vertical 2025 & 2033
- Figure 13: North America Industrial V-Belt Market Revenue Share (%), by End-user Vertical 2025 & 2033
- Figure 14: North America Industrial V-Belt Market Volume Share (%), by End-user Vertical 2025 & 2033
- Figure 15: North America Industrial V-Belt Market Revenue (Million), by Country 2025 & 2033
- Figure 16: North America Industrial V-Belt Market Volume (Billion), by Country 2025 & 2033
- Figure 17: North America Industrial V-Belt Market Revenue Share (%), by Country 2025 & 2033
- Figure 18: North America Industrial V-Belt Market Volume Share (%), by Country 2025 & 2033
- Figure 19: Europe Industrial V-Belt Market Revenue (Million), by Type 2025 & 2033
- Figure 20: Europe Industrial V-Belt Market Volume (Billion), by Type 2025 & 2033
- Figure 21: Europe Industrial V-Belt Market Revenue Share (%), by Type 2025 & 2033
- Figure 22: Europe Industrial V-Belt Market Volume Share (%), by Type 2025 & 2033
- Figure 23: Europe Industrial V-Belt Market Revenue (Million), by Material 2025 & 2033
- Figure 24: Europe Industrial V-Belt Market Volume (Billion), by Material 2025 & 2033
- Figure 25: Europe Industrial V-Belt Market Revenue Share (%), by Material 2025 & 2033
- Figure 26: Europe Industrial V-Belt Market Volume Share (%), by Material 2025 & 2033
- Figure 27: Europe Industrial V-Belt Market Revenue (Million), by End-user Vertical 2025 & 2033
- Figure 28: Europe Industrial V-Belt Market Volume (Billion), by End-user Vertical 2025 & 2033
- Figure 29: Europe Industrial V-Belt Market Revenue Share (%), by End-user Vertical 2025 & 2033
- Figure 30: Europe Industrial V-Belt Market Volume Share (%), by End-user Vertical 2025 & 2033
- Figure 31: Europe Industrial V-Belt Market Revenue (Million), by Country 2025 & 2033
- Figure 32: Europe Industrial V-Belt Market Volume (Billion), by Country 2025 & 2033
- Figure 33: Europe Industrial V-Belt Market Revenue Share (%), by Country 2025 & 2033
- Figure 34: Europe Industrial V-Belt Market Volume Share (%), by Country 2025 & 2033
- Figure 35: Asia Industrial V-Belt Market Revenue (Million), by Type 2025 & 2033
- Figure 36: Asia Industrial V-Belt Market Volume (Billion), by Type 2025 & 2033
- Figure 37: Asia Industrial V-Belt Market Revenue Share (%), by Type 2025 & 2033
- Figure 38: Asia Industrial V-Belt Market Volume Share (%), by Type 2025 & 2033
- Figure 39: Asia Industrial V-Belt Market Revenue (Million), by Material 2025 & 2033
- Figure 40: Asia Industrial V-Belt Market Volume (Billion), by Material 2025 & 2033
- Figure 41: Asia Industrial V-Belt Market Revenue Share (%), by Material 2025 & 2033
- Figure 42: Asia Industrial V-Belt Market Volume Share (%), by Material 2025 & 2033
- Figure 43: Asia Industrial V-Belt Market Revenue (Million), by End-user Vertical 2025 & 2033
- Figure 44: Asia Industrial V-Belt Market Volume (Billion), by End-user Vertical 2025 & 2033
- Figure 45: Asia Industrial V-Belt Market Revenue Share (%), by End-user Vertical 2025 & 2033
- Figure 46: Asia Industrial V-Belt Market Volume Share (%), by End-user Vertical 2025 & 2033
- Figure 47: Asia Industrial V-Belt Market Revenue (Million), by Country 2025 & 2033
- Figure 48: Asia Industrial V-Belt Market Volume (Billion), by Country 2025 & 2033
- Figure 49: Asia Industrial V-Belt Market Revenue Share (%), by Country 2025 & 2033
- Figure 50: Asia Industrial V-Belt Market Volume Share (%), by Country 2025 & 2033
- Figure 51: Australia and New Zealand Industrial V-Belt Market Revenue (Million), by Type 2025 & 2033
- Figure 52: Australia and New Zealand Industrial V-Belt Market Volume (Billion), by Type 2025 & 2033
- Figure 53: Australia and New Zealand Industrial V-Belt Market Revenue Share (%), by Type 2025 & 2033
- Figure 54: Australia and New Zealand Industrial V-Belt Market Volume Share (%), by Type 2025 & 2033
- Figure 55: Australia and New Zealand Industrial V-Belt Market Revenue (Million), by Material 2025 & 2033
- Figure 56: Australia and New Zealand Industrial V-Belt Market Volume (Billion), by Material 2025 & 2033
- Figure 57: Australia and New Zealand Industrial V-Belt Market Revenue Share (%), by Material 2025 & 2033
- Figure 58: Australia and New Zealand Industrial V-Belt Market Volume Share (%), by Material 2025 & 2033
- Figure 59: Australia and New Zealand Industrial V-Belt Market Revenue (Million), by End-user Vertical 2025 & 2033
- Figure 60: Australia and New Zealand Industrial V-Belt Market Volume (Billion), by End-user Vertical 2025 & 2033
- Figure 61: Australia and New Zealand Industrial V-Belt Market Revenue Share (%), by End-user Vertical 2025 & 2033
- Figure 62: Australia and New Zealand Industrial V-Belt Market Volume Share (%), by End-user Vertical 2025 & 2033
- Figure 63: Australia and New Zealand Industrial V-Belt Market Revenue (Million), by Country 2025 & 2033
- Figure 64: Australia and New Zealand Industrial V-Belt Market Volume (Billion), by Country 2025 & 2033
- Figure 65: Australia and New Zealand Industrial V-Belt Market Revenue Share (%), by Country 2025 & 2033
- Figure 66: Australia and New Zealand Industrial V-Belt Market Volume Share (%), by Country 2025 & 2033
- Figure 67: Latin America Industrial V-Belt Market Revenue (Million), by Type 2025 & 2033
- Figure 68: Latin America Industrial V-Belt Market Volume (Billion), by Type 2025 & 2033
- Figure 69: Latin America Industrial V-Belt Market Revenue Share (%), by Type 2025 & 2033
- Figure 70: Latin America Industrial V-Belt Market Volume Share (%), by Type 2025 & 2033
- Figure 71: Latin America Industrial V-Belt Market Revenue (Million), by Material 2025 & 2033
- Figure 72: Latin America Industrial V-Belt Market Volume (Billion), by Material 2025 & 2033
- Figure 73: Latin America Industrial V-Belt Market Revenue Share (%), by Material 2025 & 2033
- Figure 74: Latin America Industrial V-Belt Market Volume Share (%), by Material 2025 & 2033
- Figure 75: Latin America Industrial V-Belt Market Revenue (Million), by End-user Vertical 2025 & 2033
- Figure 76: Latin America Industrial V-Belt Market Volume (Billion), by End-user Vertical 2025 & 2033
- Figure 77: Latin America Industrial V-Belt Market Revenue Share (%), by End-user Vertical 2025 & 2033
- Figure 78: Latin America Industrial V-Belt Market Volume Share (%), by End-user Vertical 2025 & 2033
- Figure 79: Latin America Industrial V-Belt Market Revenue (Million), by Country 2025 & 2033
- Figure 80: Latin America Industrial V-Belt Market Volume (Billion), by Country 2025 & 2033
- Figure 81: Latin America Industrial V-Belt Market Revenue Share (%), by Country 2025 & 2033
- Figure 82: Latin America Industrial V-Belt Market Volume Share (%), by Country 2025 & 2033
- Figure 83: Middle East and Africa Industrial V-Belt Market Revenue (Million), by Type 2025 & 2033
- Figure 84: Middle East and Africa Industrial V-Belt Market Volume (Billion), by Type 2025 & 2033
- Figure 85: Middle East and Africa Industrial V-Belt Market Revenue Share (%), by Type 2025 & 2033
- Figure 86: Middle East and Africa Industrial V-Belt Market Volume Share (%), by Type 2025 & 2033
- Figure 87: Middle East and Africa Industrial V-Belt Market Revenue (Million), by Material 2025 & 2033
- Figure 88: Middle East and Africa Industrial V-Belt Market Volume (Billion), by Material 2025 & 2033
- Figure 89: Middle East and Africa Industrial V-Belt Market Revenue Share (%), by Material 2025 & 2033
- Figure 90: Middle East and Africa Industrial V-Belt Market Volume Share (%), by Material 2025 & 2033
- Figure 91: Middle East and Africa Industrial V-Belt Market Revenue (Million), by End-user Vertical 2025 & 2033
- Figure 92: Middle East and Africa Industrial V-Belt Market Volume (Billion), by End-user Vertical 2025 & 2033
- Figure 93: Middle East and Africa Industrial V-Belt Market Revenue Share (%), by End-user Vertical 2025 & 2033
- Figure 94: Middle East and Africa Industrial V-Belt Market Volume Share (%), by End-user Vertical 2025 & 2033
- Figure 95: Middle East and Africa Industrial V-Belt Market Revenue (Million), by Country 2025 & 2033
- Figure 96: Middle East and Africa Industrial V-Belt Market Volume (Billion), by Country 2025 & 2033
- Figure 97: Middle East and Africa Industrial V-Belt Market Revenue Share (%), by Country 2025 & 2033
- Figure 98: Middle East and Africa Industrial V-Belt Market Volume Share (%), by Country 2025 & 2033
List of Tables
- Table 1: Global Industrial V-Belt Market Revenue Million Forecast, by Type 2020 & 2033
- Table 2: Global Industrial V-Belt Market Volume Billion Forecast, by Type 2020 & 2033
- Table 3: Global Industrial V-Belt Market Revenue Million Forecast, by Material 2020 & 2033
- Table 4: Global Industrial V-Belt Market Volume Billion Forecast, by Material 2020 & 2033
- Table 5: Global Industrial V-Belt Market Revenue Million Forecast, by End-user Vertical 2020 & 2033
- Table 6: Global Industrial V-Belt Market Volume Billion Forecast, by End-user Vertical 2020 & 2033
- Table 7: Global Industrial V-Belt Market Revenue Million Forecast, by Region 2020 & 2033
- Table 8: Global Industrial V-Belt Market Volume Billion Forecast, by Region 2020 & 2033
- Table 9: Global Industrial V-Belt Market Revenue Million Forecast, by Type 2020 & 2033
- Table 10: Global Industrial V-Belt Market Volume Billion Forecast, by Type 2020 & 2033
- Table 11: Global Industrial V-Belt Market Revenue Million Forecast, by Material 2020 & 2033
- Table 12: Global Industrial V-Belt Market Volume Billion Forecast, by Material 2020 & 2033
- Table 13: Global Industrial V-Belt Market Revenue Million Forecast, by End-user Vertical 2020 & 2033
- Table 14: Global Industrial V-Belt Market Volume Billion Forecast, by End-user Vertical 2020 & 2033
- Table 15: Global Industrial V-Belt Market Revenue Million Forecast, by Country 2020 & 2033
- Table 16: Global Industrial V-Belt Market Volume Billion Forecast, by Country 2020 & 2033
- Table 17: Global Industrial V-Belt Market Revenue Million Forecast, by Type 2020 & 2033
- Table 18: Global Industrial V-Belt Market Volume Billion Forecast, by Type 2020 & 2033
- Table 19: Global Industrial V-Belt Market Revenue Million Forecast, by Material 2020 & 2033
- Table 20: Global Industrial V-Belt Market Volume Billion Forecast, by Material 2020 & 2033
- Table 21: Global Industrial V-Belt Market Revenue Million Forecast, by End-user Vertical 2020 & 2033
- Table 22: Global Industrial V-Belt Market Volume Billion Forecast, by End-user Vertical 2020 & 2033
- Table 23: Global Industrial V-Belt Market Revenue Million Forecast, by Country 2020 & 2033
- Table 24: Global Industrial V-Belt Market Volume Billion Forecast, by Country 2020 & 2033
- Table 25: Global Industrial V-Belt Market Revenue Million Forecast, by Type 2020 & 2033
- Table 26: Global Industrial V-Belt Market Volume Billion Forecast, by Type 2020 & 2033
- Table 27: Global Industrial V-Belt Market Revenue Million Forecast, by Material 2020 & 2033
- Table 28: Global Industrial V-Belt Market Volume Billion Forecast, by Material 2020 & 2033
- Table 29: Global Industrial V-Belt Market Revenue Million Forecast, by End-user Vertical 2020 & 2033
- Table 30: Global Industrial V-Belt Market Volume Billion Forecast, by End-user Vertical 2020 & 2033
- Table 31: Global Industrial V-Belt Market Revenue Million Forecast, by Country 2020 & 2033
- Table 32: Global Industrial V-Belt Market Volume Billion Forecast, by Country 2020 & 2033
- Table 33: Global Industrial V-Belt Market Revenue Million Forecast, by Type 2020 & 2033
- Table 34: Global Industrial V-Belt Market Volume Billion Forecast, by Type 2020 & 2033
- Table 35: Global Industrial V-Belt Market Revenue Million Forecast, by Material 2020 & 2033
- Table 36: Global Industrial V-Belt Market Volume Billion Forecast, by Material 2020 & 2033
- Table 37: Global Industrial V-Belt Market Revenue Million Forecast, by End-user Vertical 2020 & 2033
- Table 38: Global Industrial V-Belt Market Volume Billion Forecast, by End-user Vertical 2020 & 2033
- Table 39: Global Industrial V-Belt Market Revenue Million Forecast, by Country 2020 & 2033
- Table 40: Global Industrial V-Belt Market Volume Billion Forecast, by Country 2020 & 2033
- Table 41: Global Industrial V-Belt Market Revenue Million Forecast, by Type 2020 & 2033
- Table 42: Global Industrial V-Belt Market Volume Billion Forecast, by Type 2020 & 2033
- Table 43: Global Industrial V-Belt Market Revenue Million Forecast, by Material 2020 & 2033
- Table 44: Global Industrial V-Belt Market Volume Billion Forecast, by Material 2020 & 2033
- Table 45: Global Industrial V-Belt Market Revenue Million Forecast, by End-user Vertical 2020 & 2033
- Table 46: Global Industrial V-Belt Market Volume Billion Forecast, by End-user Vertical 2020 & 2033
- Table 47: Global Industrial V-Belt Market Revenue Million Forecast, by Country 2020 & 2033
- Table 48: Global Industrial V-Belt Market Volume Billion Forecast, by Country 2020 & 2033
- Table 49: Global Industrial V-Belt Market Revenue Million Forecast, by Type 2020 & 2033
- Table 50: Global Industrial V-Belt Market Volume Billion Forecast, by Type 2020 & 2033
- Table 51: Global Industrial V-Belt Market Revenue Million Forecast, by Material 2020 & 2033
- Table 52: Global Industrial V-Belt Market Volume Billion Forecast, by Material 2020 & 2033
- Table 53: Global Industrial V-Belt Market Revenue Million Forecast, by End-user Vertical 2020 & 2033
- Table 54: Global Industrial V-Belt Market Volume Billion Forecast, by End-user Vertical 2020 & 2033
- Table 55: Global Industrial V-Belt Market Revenue Million Forecast, by Country 2020 & 2033
- Table 56: Global Industrial V-Belt Market Volume Billion Forecast, by Country 2020 & 2033
Frequently Asked Questions
1. What is the projected Compound Annual Growth Rate (CAGR) of the Industrial V-Belt Market?
The projected CAGR is approximately 5.00%.
2. Which companies are prominent players in the Industrial V-Belt Market?
Key companies in the market include Gates Corporation, ContiTech Deutschland GmbH, Mitsuboshi Belting Ltd, Fenner Drives Inc, Optibelt GmbH, Bando Chemical Industries Ltd, SFK Group, Hutchinson, PIX Transmissions Ltd, Timken Belts, Zhejiang Sanlux Rubber Co Ltd, PowerDrive LLC, BEHA Innovation GmbH*List Not Exhaustive.
3. What are the main segments of the Industrial V-Belt Market?
The market segments include Type, Material, End-user Vertical.
4. Can you provide details about the market size?
The market size is estimated to be USD 1.5 Million as of 2022.
5. What are some drivers contributing to market growth?
Industrial Automation Growth; Maintenance and Replacement Demand.
6. What are the notable trends driving market growth?
The Automotive Industry is Projected to Witness Strong Demand.
7. Are there any restraints impacting market growth?
Industrial Automation Growth; Maintenance and Replacement Demand.
8. Can you provide examples of recent developments in the market?
August 2024: Gates Corporation is enhancing its bandless V-belt lineup. The composition of the Super High Capacity (HC) Molded Notch (MN) V-belt will transition from standard chloroprene rubber (CR) materials to advanced ethylene elastomer (EE) compounds. Furthermore, in July 2024, the company began producing its EE Tri-Power V-belts in Europe, ensuring reduced lead times and improved availability.March 2024: V-Belt manufacturer Dayco Inc. inaugurated its new plant in San Luis Potosí, Mexico, located in the Tres Naciones Park, in the Industrial Zone of the state. The new plant will be used to produce belts for light combustion cars, with its molded tooth design that operates more quietly and efficiently. In terms of its scale and capacity, the facility covers 73,000 sq. ft and is equipped with state-of-the-art machinery that can produce up to 4.2 million Poly-V belts annually,
9. What pricing options are available for accessing the report?
Pricing options include single-user, multi-user, and enterprise licenses priced at USD 4750, USD 5250, and USD 8750 respectively.
10. Is the market size provided in terms of value or volume?
The market size is provided in terms of value, measured in Million and volume, measured in Billion.
11. Are there any specific market keywords associated with the report?
Yes, the market keyword associated with the report is "Industrial V-Belt Market," which aids in identifying and referencing the specific market segment covered.
12. How do I determine which pricing option suits my needs best?
The pricing options vary based on user requirements and access needs. Individual users may opt for single-user licenses, while businesses requiring broader access may choose multi-user or enterprise licenses for cost-effective access to the report.
13. Are there any additional resources or data provided in the Industrial V-Belt Market report?
While the report offers comprehensive insights, it's advisable to review the specific contents or supplementary materials provided to ascertain if additional resources or data are available.
14. How can I stay updated on further developments or reports in the Industrial V-Belt Market?
To stay informed about further developments, trends, and reports in the Industrial V-Belt Market, consider subscribing to industry newsletters, following relevant companies and organizations, or regularly checking reputable industry news sources and publications.
Methodology
Step 1 - Identification of Relevant Samples Size from Population Database


Step 2 - Approaches for Defining Global Market Size (Value, Volume* & Price*)

Note*: In applicable scenarios
Step 3 - Data Sources
Primary Research
- Web Analytics
- Survey Reports
- Research Institute
- Latest Research Reports
- Opinion Leaders
Secondary Research
- Annual Reports
- White Paper
- Latest Press Release
- Industry Association
- Paid Database
- Investor Presentations

Step 4 - Data Triangulation
Involves using different sources of information in order to increase the validity of a study
These sources are likely to be stakeholders in a program - participants, other researchers, program staff, other community members, and so on.
Then we put all data in single framework & apply various statistical tools to find out the dynamic on the market.
During the analysis stage, feedback from the stakeholder groups would be compared to determine areas of agreement as well as areas of divergence