

Key Insights
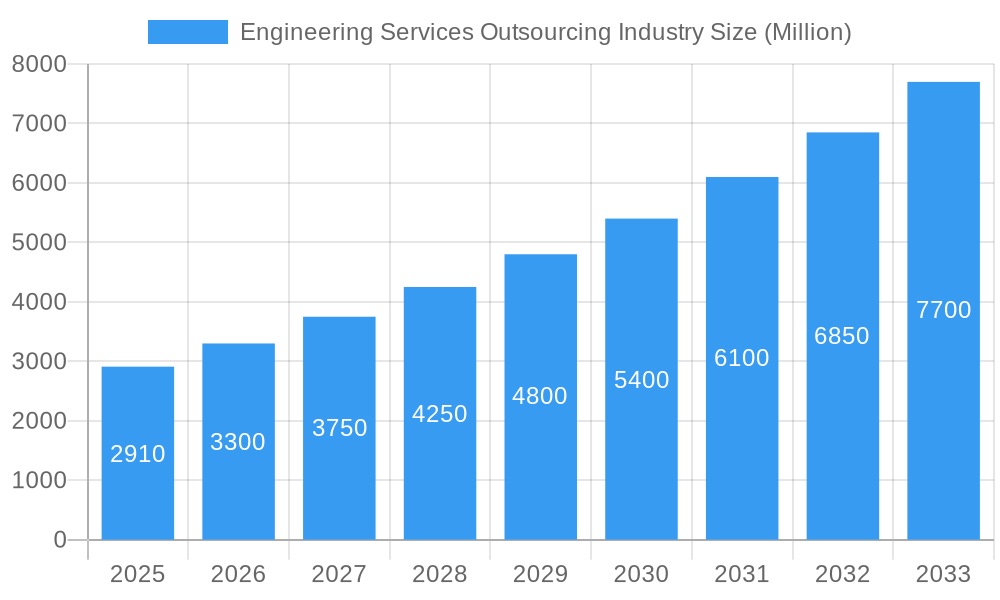
The global Engineering Services Outsourcing (ESO) market is poised for significant expansion, with a projected market size of $2.91 Billion by 2025. This growth is fueled by an impressive Compound Annual Growth Rate (CAGR) of 12.89%, indicating robust demand and rapid adoption of outsourced engineering solutions across various industries. Key drivers propelling this market forward include the increasing need for specialized engineering expertise, cost optimization strategies adopted by businesses, and the accelerating pace of digital transformation. Companies are increasingly leveraging ESO to access cutting-edge technologies, reduce time-to-market for new products, and focus on core competencies. The demand for innovative solutions in sectors like Automotive, Industrial, Consumer Electronics, and Telecommunications is a major impetus. Furthermore, the growing complexity of product development cycles and the requirement for advanced simulations and prototyping are creating substantial opportunities for ESO providers.
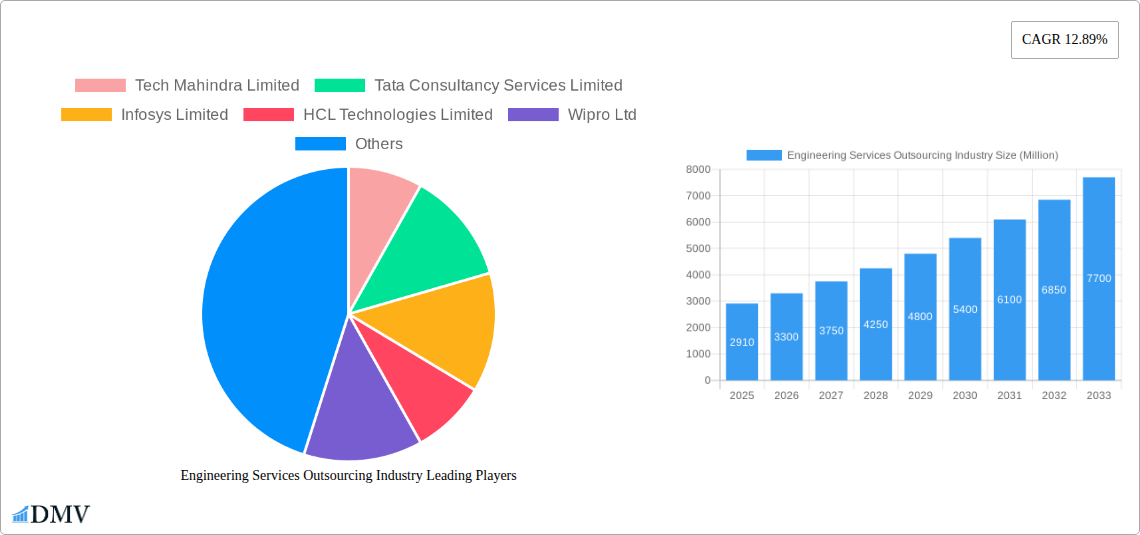
Engineering Services Outsourcing Industry Market Size (In Billion)
The ESO market is segmented to cater to diverse industry needs, with services encompassing Designing, Prototyping, System Integration, and Testing, alongside a broad spectrum of "Others" to accommodate specialized requirements. The primary end-user industries such as Automotive, Industrial, Consumer Electronics and Semiconductors, and Telecom are expected to drive significant revenue. Emerging trends like the adoption of Artificial Intelligence (AI) and Machine Learning (ML) in engineering processes, the rise of the Internet of Things (IoT), and the increasing focus on sustainable and green engineering practices are shaping the market landscape. While the market exhibits strong growth, potential restraints could include data security concerns, intellectual property protection challenges, and the need for seamless integration with client systems. Leading players like Tech Mahindra, Tata Consultancy Services, Infosys, and Accenture are actively participating in this dynamic market, contributing to innovation and market expansion. The geographical distribution of the market shows strong presence in North America, Europe, and Asia Pacific, with China and India emerging as significant hubs for engineering services.
Engineering Services Outsourcing Industry Company Market Share
Engineering Services Outsourcing Industry: Market Analysis, Growth Drivers, and Future Outlook (2019-2033)
This comprehensive report delves into the dynamic Engineering Services Outsourcing (ESO) industry, providing an in-depth analysis of market composition, trends, evolution, and future projections. Covering the study period from 2019 to 2033, with a base year of 2025 and a forecast period extending to 2033, this report offers actionable insights for stakeholders seeking to navigate the rapidly evolving landscape of engineering outsourcing. We examine key players, emerging technologies, and strategic developments shaping this multi-million dollar market.
Engineering Services Outsourcing Industry Market Composition & Trends
The Engineering Services Outsourcing (ESO) market exhibits a dynamic yet moderately concentrated structure, with a significant portion of the global market share held by leading players. Innovation is a primary catalyst, driven by the increasing demand for advanced engineering solutions across various sectors. The regulatory landscape is evolving, with governments worldwide implementing policies to foster innovation and attract foreign investment in R&D and engineering services. Substitute products, while emerging in niche areas, are yet to significantly challenge the core offerings of ESO. End-user profiles are increasingly sophisticated, demanding specialized expertise and customized solutions. Mergers and Acquisitions (M&A) activity is a significant trend, with companies consolidating to expand their service portfolios, geographical reach, and technological capabilities. The total M&A deal value in the ESO market is projected to reach hundreds of millions by 2025.
- Market Share Distribution: Top players hold approximately 60-70% of the market share.
- Innovation Drivers: AI, ML, IoT integration, and digital twin technologies.
- Regulatory Landscape: Focus on data security, intellectual property protection, and talent development.
- Substitute Products: Emerging AI-driven design tools and platform-based solutions.
- End-User Demands: Customization, scalability, cost-efficiency, and faster time-to-market.
- M&A Activities: Driven by the need for talent acquisition, service diversification, and market consolidation.
Engineering Services Outsourcing Industry Industry Evolution
The Engineering Services Outsourcing (ESO) industry has witnessed a remarkable evolution, transforming from a cost-optimization strategy to a critical enabler of innovation and digital transformation. Over the historical period (2019-2024), the market experienced a compound annual growth rate (CAGR) of approximately 12-15%, driven by the increasing adoption of digital technologies and the growing complexity of engineering projects. Technological advancements, including the proliferation of Artificial Intelligence (AI), Machine Learning (ML), the Internet of Things (IoT), and cloud computing, have fundamentally reshaped the ESO landscape. These technologies have enabled service providers to offer more sophisticated and value-added services, moving beyond traditional design and development to encompass predictive maintenance, smart product development, and advanced analytics.
Shifting consumer demands have also played a pivotal role. Customers are increasingly seeking faster product development cycles, enhanced product functionalities, and sustainable engineering solutions. This has pushed ESO providers to invest heavily in R&D, upskill their workforces, and adopt agile methodologies. The rise of Industry 4.0 has further accelerated this evolution, creating a demand for integrated engineering solutions that span the entire product lifecycle. The base year, 2025, is anticipated to see continued robust growth, with the market size expected to exceed $XXX Billion. The forecast period (2025-2033) is projected to witness a sustained CAGR of 10-13%, fueled by ongoing digital transformation initiatives, the expansion of emerging markets, and the continuous pursuit of operational excellence by businesses globally. Adoption metrics for AI in engineering services are projected to reach over 70% by 2030, highlighting its critical role in the industry's future.
Leading Regions, Countries, or Segments in Engineering Services Outsourcing Industry
The Automotive sector stands out as a dominant end-user segment within the global Engineering Services Outsourcing (ESO) industry. This dominance is propelled by several key drivers, including the rapid acceleration of vehicle electrification, the increasing complexity of automotive software, and the burgeoning demand for autonomous driving technologies. The automotive industry's inherent need for advanced engineering solutions, from intricate designing and sophisticated prototyping to complex system integration and rigorous testing, makes it a prime beneficiary of ESO. The sheer volume of engineering requirements within this sector, coupled with the continuous drive for innovation and cost optimization, ensures a substantial and sustained demand for outsourcing partners.
- Key Drivers for Automotive Dominance:
- Electrification and New Energy Vehicles (NEVs): Significant investments in battery technology, electric powertrains, and charging infrastructure require specialized engineering expertise that ESO providers can readily supply.
- Autonomous Driving Systems: The development and integration of advanced driver-assistance systems (ADAS) and fully autonomous driving technologies necessitate complex software development, sensor integration, and rigorous validation processes, all areas where ESO excels.
- Connected Car Technologies: The increasing connectivity of vehicles, leading to in-car infotainment, telematics, and over-the-air updates, demands robust software engineering and system integration capabilities.
- Lightweighting and Material Science: Efforts to improve fuel efficiency and vehicle performance drive the need for advanced material engineering and design optimization.
- Regulatory Compliance: Stringent safety and environmental regulations worldwide necessitate continuous engineering efforts to ensure compliance, often requiring external specialized knowledge.
The Automotive segment's reliance on the Designing and System Integration services within ESO is particularly pronounced. Design activities encompass everything from conceptualization and styling to detailed component design and simulation. System Integration, on the other hand, is crucial for bringing together diverse hardware and software components to create functional and cohesive automotive systems, such as infotainment, powertrain control, and ADAS. The scale of these projects, often spanning multiple years and requiring specialized domain knowledge, makes outsourcing a strategic imperative for automotive manufacturers looking to maintain a competitive edge. The global ESO market for automotive is projected to reach over $XXX Billion by 2025, underscoring its significance.
Engineering Services Outsourcing Industry Product Innovations
Product innovations in the Engineering Services Outsourcing (ESO) industry are increasingly focused on leveraging advanced technologies to deliver enhanced value and efficiency. This includes the development of AI-powered design automation tools that accelerate the prototyping phase, enabling rapid iteration and optimization of product designs. Furthermore, the integration of digital twin technology allows for real-time performance monitoring and predictive maintenance, significantly improving product lifespan and reducing operational costs. The application of sophisticated simulation software further refines product performance metrics before physical production. Unique selling propositions now revolve around offering end-to-end digital transformation services, seamlessly integrating IoT capabilities for smart products and developing customized solutions that address specific client needs across various industries like Consumer Electronics and Semiconductors.
Propelling Factors for Engineering Services Outsourcing Industry Growth
The Engineering Services Outsourcing (ESO) industry's growth is propelled by a confluence of powerful factors. Technologically, the rapid advancements in AI, ML, IoT, and cloud computing enable more sophisticated and integrated engineering solutions, driving demand for specialized expertise. Economically, the pursuit of cost optimization, access to a global talent pool, and faster time-to-market remain significant drivers for businesses of all sizes. Regulatory influences, such as increased emphasis on product safety and environmental standards, also necessitate specialized engineering support, further fueling outsourcing. The increasing complexity of product development across sectors like Automotive and Industrial manufacturing also compels companies to leverage external expertise for specialized tasks.
Obstacles in the Engineering Services Outsourcing Industry Market
Despite its robust growth, the Engineering Services Outsourcing (ESO) market faces several obstacles. Regulatory challenges, including evolving data privacy laws and intellectual property protection concerns in different jurisdictions, can create complexities for global outsourcing partnerships. Supply chain disruptions, as witnessed in recent years, can impact project timelines and resource availability, leading to increased costs. Competitive pressures from a growing number of players, particularly in emerging markets, can also lead to price wars and affect profit margins. Furthermore, the need for continuous upskilling of the workforce to keep pace with rapid technological advancements presents an ongoing challenge for ESO providers.
Future Opportunities in Engineering Services Outsourcing Industry
The future of the Engineering Services Outsourcing (ESO) industry is ripe with emerging opportunities. The growing demand for sustainable engineering solutions and green technologies presents a significant new market. The expansion of 5G infrastructure and the proliferation of IoT devices will continue to drive demand for specialized engineering services in the Telecom and Consumer Electronics sectors. Furthermore, the increasing adoption of digital twin technology and the metaverse for virtual product development and collaboration will open new avenues for ESO providers. The ongoing digital transformation across all industries ensures a sustained need for advanced engineering expertise, creating opportunities for companies offering innovative and integrated solutions.
Major Players in the Engineering Services Outsourcing Industry Ecosystem
- Tech Mahindra Limited
- Tata Consultancy Services Limited
- Infosys Limited
- HCL Technologies Limited
- Wipro Ltd
- Capgemini Technology Services India Limited
- Globallogic Inc
- Accenture
- RLE International Inc
- ASAP Holding GmbH
- Tata Technologies
Key Developments in Engineering Services Outsourcing Industry Industry
- April 2023: The relationship between Marks and Spencer PLC (M&S) and Tata Consultancy Services (TCS) has been extended to change M&S's core technology stack, increase innovation speed and resilience, and promote sustainable growth. The modernization program will enhance speed to market, lower technological debt, and boost operating model efficiency and effectiveness for M&S. M&S' strategic aims of providing better customer experience, driving online growth, leading in omnichannel and sustainability, modernizing its supply chain, increasing its worldwide reach will be expedited by the transformation into a simple, agile, data-led business. This development signifies a strategic shift towards leveraging ESO for comprehensive digital transformation and business agility.
- February 2023: A Memorandum of Understanding (MoU) has been signed by Tech Mahindra and the Ministry of Communication and Information Technology (MCIT) of Saudi Arabia to establish a Data & AI and a Cloud Centre of Excellence (CoE) in Riyadh. Tech Mahindra is a leading provider of digital transformation, consulting, and business re-engineering services and solutions. The CoE will combine academic and socioeconomic objectives to advance small and medium businesses, enhance the nation's capacity for high-tech expertise, and create high-quality jobs. This partnership highlights the growing importance of establishing regional hubs for advanced technology services and fostering local talent development in the ESO landscape.
Strategic Engineering Services Outsourcing Industry Market Forecast
The strategic forecast for the Engineering Services Outsourcing (ESO) industry indicates continued strong growth, driven by the persistent demand for digital transformation, innovation, and operational efficiency across global industries. The market is projected to reach several hundred billion dollars by 2033, with key growth catalysts including the widespread adoption of AI, IoT, and cloud-native solutions. Emerging economies are expected to play an increasingly significant role, offering both new markets and a growing pool of skilled engineering talent. The increasing complexity of products and the need for specialized domain knowledge will further bolster the outsourcing trend. Companies that can offer end-to-end solutions, demonstrate agility, and maintain a focus on sustainability and emerging technologies will be best positioned for success in this dynamic market.
Engineering Services Outsourcing Industry Segmentation
-
1. Services
- 1.1. Designing
- 1.2. Prototyping
- 1.3. System Integration
- 1.4. Testing
- 1.5. Others
-
2. End User
- 2.1. Automotive
- 2.2. Industrial
- 2.3. Consumer Electronics And Semiconductors
- 2.4. Telecom
- 2.5. Others
Engineering Services Outsourcing Industry Segmentation By Geography
-
1. North America
- 1.1. United States
- 1.2. Canada
- 1.3. Mexico
-
2. Europe
- 2.1. United Kingdom
- 2.2. Germany
- 2.3. France
- 2.4. Italy
- 2.5. Spain
- 2.6. Rest of Europe
-
3. Asia Pacific
- 3.1. China
- 3.2. India
- 3.3. Japan
- 3.4. South Korea
- 3.5. Thailand
- 3.6. Indonesia
- 3.7. Rest of Asia pacific
- 4. Rest of the World
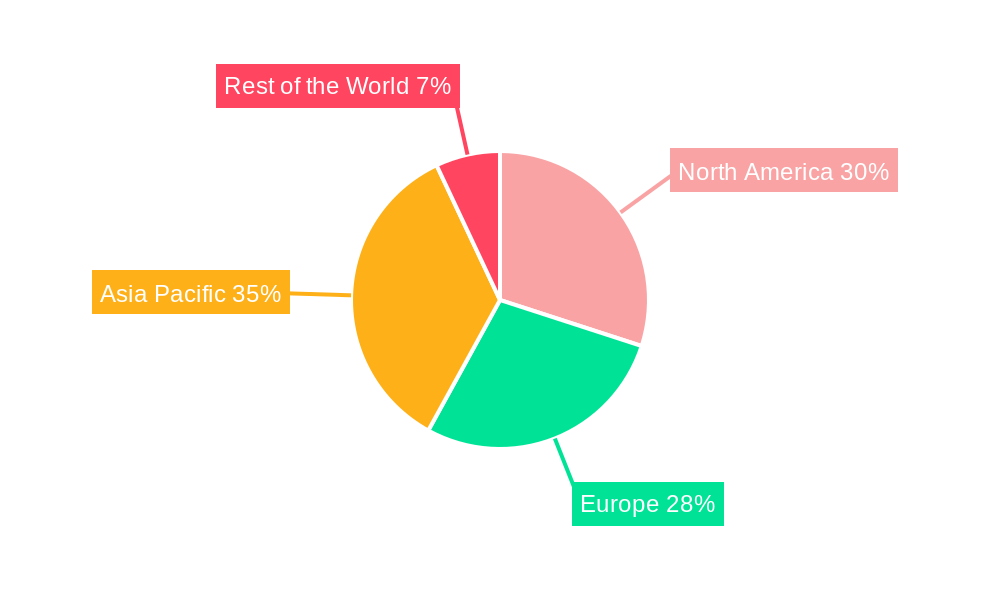
Engineering Services Outsourcing Industry Regional Market Share
Geographic Coverage of Engineering Services Outsourcing Industry
Engineering Services Outsourcing Industry REPORT HIGHLIGHTS
| Aspects | Details |
|---|---|
| Study Period | 2020-2034 |
| Base Year | 2025 |
| Estimated Year | 2026 |
| Forecast Period | 2026-2034 |
| Historical Period | 2020-2025 |
| Growth Rate | CAGR of 12.89% from 2020-2034 |
| Segmentation |
|
Table of Contents
- 1. Introduction
- 1.1. Research Scope
- 1.2. Market Segmentation
- 1.3. Research Objective
- 1.4. Definitions and Assumptions
- 2. Executive Summary
- 2.1. Market Snapshot
- 3. Market Dynamics
- 3.1. Market Drivers
- 3.2. Market Restrains
- 3.3. Market Trends
- 3.4. Market Opportunities
- 4. Market Factor Analysis
- 4.1. Porters Five Forces
- 4.1.1. Bargaining Power of Suppliers
- 4.1.2. Bargaining Power of Buyers
- 4.1.3. Threat of New Entrants
- 4.1.4. Threat of Substitutes
- 4.1.5. Competitive Rivalry
- 4.2. PESTEL analysis
- 4.3. BCG Analysis
- 4.3.1. Stars (High Growth, High Market Share)
- 4.3.2. Cash Cows (Low Growth, High Market Share)
- 4.3.3. Question Mark (High Growth, Low Market Share)
- 4.3.4. Dogs (Low Growth, Low Market Share)
- 4.4. Ansoff Matrix Analysis
- 4.5. Supply Chain Analysis
- 4.6. Regulatory Landscape
- 4.7. Current Market Potential and Opportunity Assessment (TAM–SAM–SOM Framework)
- 4.8. DMV Analyst Note
- 4.1. Porters Five Forces
- 5. Market Analysis, Insights and Forecast 2021-2033
- 5.1. Market Analysis, Insights and Forecast - by Services
- 5.1.1. Designing
- 5.1.2. Prototyping
- 5.1.3. System Integration
- 5.1.4. Testing
- 5.1.5. Others
- 5.2. Market Analysis, Insights and Forecast - by End User
- 5.2.1. Automotive
- 5.2.2. Industrial
- 5.2.3. Consumer Electronics And Semiconductors
- 5.2.4. Telecom
- 5.2.5. Others
- 5.3. Market Analysis, Insights and Forecast - by Region
- 5.3.1. North America
- 5.3.2. Europe
- 5.3.3. Asia Pacific
- 5.3.4. Rest of the World
- 5.1. Market Analysis, Insights and Forecast - by Services
- 6. Global Engineering Services Outsourcing Industry Analysis, Insights and Forecast, 2021-2033
- 6.1. Market Analysis, Insights and Forecast - by Services
- 6.1.1. Designing
- 6.1.2. Prototyping
- 6.1.3. System Integration
- 6.1.4. Testing
- 6.1.5. Others
- 6.2. Market Analysis, Insights and Forecast - by End User
- 6.2.1. Automotive
- 6.2.2. Industrial
- 6.2.3. Consumer Electronics And Semiconductors
- 6.2.4. Telecom
- 6.2.5. Others
- 6.1. Market Analysis, Insights and Forecast - by Services
- 7. North America Engineering Services Outsourcing Industry Analysis, Insights and Forecast, 2020-2032
- 7.1. Market Analysis, Insights and Forecast - by Services
- 7.1.1. Designing
- 7.1.2. Prototyping
- 7.1.3. System Integration
- 7.1.4. Testing
- 7.1.5. Others
- 7.2. Market Analysis, Insights and Forecast - by End User
- 7.2.1. Automotive
- 7.2.2. Industrial
- 7.2.3. Consumer Electronics And Semiconductors
- 7.2.4. Telecom
- 7.2.5. Others
- 7.1. Market Analysis, Insights and Forecast - by Services
- 8. Europe Engineering Services Outsourcing Industry Analysis, Insights and Forecast, 2020-2032
- 8.1. Market Analysis, Insights and Forecast - by Services
- 8.1.1. Designing
- 8.1.2. Prototyping
- 8.1.3. System Integration
- 8.1.4. Testing
- 8.1.5. Others
- 8.2. Market Analysis, Insights and Forecast - by End User
- 8.2.1. Automotive
- 8.2.2. Industrial
- 8.2.3. Consumer Electronics And Semiconductors
- 8.2.4. Telecom
- 8.2.5. Others
- 8.1. Market Analysis, Insights and Forecast - by Services
- 9. Asia Pacific Engineering Services Outsourcing Industry Analysis, Insights and Forecast, 2020-2032
- 9.1. Market Analysis, Insights and Forecast - by Services
- 9.1.1. Designing
- 9.1.2. Prototyping
- 9.1.3. System Integration
- 9.1.4. Testing
- 9.1.5. Others
- 9.2. Market Analysis, Insights and Forecast - by End User
- 9.2.1. Automotive
- 9.2.2. Industrial
- 9.2.3. Consumer Electronics And Semiconductors
- 9.2.4. Telecom
- 9.2.5. Others
- 9.1. Market Analysis, Insights and Forecast - by Services
- 10. Rest of the World Engineering Services Outsourcing Industry Analysis, Insights and Forecast, 2020-2032
- 10.1. Market Analysis, Insights and Forecast - by Services
- 10.1.1. Designing
- 10.1.2. Prototyping
- 10.1.3. System Integration
- 10.1.4. Testing
- 10.1.5. Others
- 10.2. Market Analysis, Insights and Forecast - by End User
- 10.2.1. Automotive
- 10.2.2. Industrial
- 10.2.3. Consumer Electronics And Semiconductors
- 10.2.4. Telecom
- 10.2.5. Others
- 10.1. Market Analysis, Insights and Forecast - by Services
- 11. Competitive Analysis
- 11.1. Company Profiles
- 11.1.1 Tech Mahindra Limited
- 11.1.1.1. Company Overview
- 11.1.1.2. Products
- 11.1.1.3. Company Financials
- 11.1.1.4. SWOT Analysis
- 11.1.2 Tata Consultancy Services Limited
- 11.1.2.1. Company Overview
- 11.1.2.2. Products
- 11.1.2.3. Company Financials
- 11.1.2.4. SWOT Analysis
- 11.1.3 Infosys Limited
- 11.1.3.1. Company Overview
- 11.1.3.2. Products
- 11.1.3.3. Company Financials
- 11.1.3.4. SWOT Analysis
- 11.1.4 HCL Technologies Limited
- 11.1.4.1. Company Overview
- 11.1.4.2. Products
- 11.1.4.3. Company Financials
- 11.1.4.4. SWOT Analysis
- 11.1.5 Wipro Ltd
- 11.1.5.1. Company Overview
- 11.1.5.2. Products
- 11.1.5.3. Company Financials
- 11.1.5.4. SWOT Analysis
- 11.1.6 Capgemini Technology Services India Limited
- 11.1.6.1. Company Overview
- 11.1.6.2. Products
- 11.1.6.3. Company Financials
- 11.1.6.4. SWOT Analysis
- 11.1.7 Globallogic Inc
- 11.1.7.1. Company Overview
- 11.1.7.2. Products
- 11.1.7.3. Company Financials
- 11.1.7.4. SWOT Analysis
- 11.1.8 Accenture
- 11.1.8.1. Company Overview
- 11.1.8.2. Products
- 11.1.8.3. Company Financials
- 11.1.8.4. SWOT Analysis
- 11.1.9 RLE International Inc
- 11.1.9.1. Company Overview
- 11.1.9.2. Products
- 11.1.9.3. Company Financials
- 11.1.9.4. SWOT Analysis
- 11.1.10 ASAP Holding GmbH
- 11.1.10.1. Company Overview
- 11.1.10.2. Products
- 11.1.10.3. Company Financials
- 11.1.10.4. SWOT Analysis
- 11.1.11 Tata Technologies**List Not Exhaustive
- 11.1.11.1. Company Overview
- 11.1.11.2. Products
- 11.1.11.3. Company Financials
- 11.1.11.4. SWOT Analysis
- 11.1.1 Tech Mahindra Limited
- 11.2. Market Entropy
- 11.2.1 Company's Key Areas Served
- 11.2.2 Recent Developments
- 11.3. Company Market Share Analysis 2025
- 11.3.1 Top 5 Companies Market Share Analysis
- 11.3.2 Top 3 Companies Market Share Analysis
- 11.4. List of Potential Customers
- 12. Research Methodology
List of Figures
- Figure 1: Global Engineering Services Outsourcing Industry Revenue Breakdown (Million, %) by Region 2025 & 2033
- Figure 2: Global Engineering Services Outsourcing Industry Volume Breakdown (Trillion, %) by Region 2025 & 2033
- Figure 3: North America Engineering Services Outsourcing Industry Revenue (Million), by Services 2025 & 2033
- Figure 4: North America Engineering Services Outsourcing Industry Volume (Trillion), by Services 2025 & 2033
- Figure 5: North America Engineering Services Outsourcing Industry Revenue Share (%), by Services 2025 & 2033
- Figure 6: North America Engineering Services Outsourcing Industry Volume Share (%), by Services 2025 & 2033
- Figure 7: North America Engineering Services Outsourcing Industry Revenue (Million), by End User 2025 & 2033
- Figure 8: North America Engineering Services Outsourcing Industry Volume (Trillion), by End User 2025 & 2033
- Figure 9: North America Engineering Services Outsourcing Industry Revenue Share (%), by End User 2025 & 2033
- Figure 10: North America Engineering Services Outsourcing Industry Volume Share (%), by End User 2025 & 2033
- Figure 11: North America Engineering Services Outsourcing Industry Revenue (Million), by Country 2025 & 2033
- Figure 12: North America Engineering Services Outsourcing Industry Volume (Trillion), by Country 2025 & 2033
- Figure 13: North America Engineering Services Outsourcing Industry Revenue Share (%), by Country 2025 & 2033
- Figure 14: North America Engineering Services Outsourcing Industry Volume Share (%), by Country 2025 & 2033
- Figure 15: Europe Engineering Services Outsourcing Industry Revenue (Million), by Services 2025 & 2033
- Figure 16: Europe Engineering Services Outsourcing Industry Volume (Trillion), by Services 2025 & 2033
- Figure 17: Europe Engineering Services Outsourcing Industry Revenue Share (%), by Services 2025 & 2033
- Figure 18: Europe Engineering Services Outsourcing Industry Volume Share (%), by Services 2025 & 2033
- Figure 19: Europe Engineering Services Outsourcing Industry Revenue (Million), by End User 2025 & 2033
- Figure 20: Europe Engineering Services Outsourcing Industry Volume (Trillion), by End User 2025 & 2033
- Figure 21: Europe Engineering Services Outsourcing Industry Revenue Share (%), by End User 2025 & 2033
- Figure 22: Europe Engineering Services Outsourcing Industry Volume Share (%), by End User 2025 & 2033
- Figure 23: Europe Engineering Services Outsourcing Industry Revenue (Million), by Country 2025 & 2033
- Figure 24: Europe Engineering Services Outsourcing Industry Volume (Trillion), by Country 2025 & 2033
- Figure 25: Europe Engineering Services Outsourcing Industry Revenue Share (%), by Country 2025 & 2033
- Figure 26: Europe Engineering Services Outsourcing Industry Volume Share (%), by Country 2025 & 2033
- Figure 27: Asia Pacific Engineering Services Outsourcing Industry Revenue (Million), by Services 2025 & 2033
- Figure 28: Asia Pacific Engineering Services Outsourcing Industry Volume (Trillion), by Services 2025 & 2033
- Figure 29: Asia Pacific Engineering Services Outsourcing Industry Revenue Share (%), by Services 2025 & 2033
- Figure 30: Asia Pacific Engineering Services Outsourcing Industry Volume Share (%), by Services 2025 & 2033
- Figure 31: Asia Pacific Engineering Services Outsourcing Industry Revenue (Million), by End User 2025 & 2033
- Figure 32: Asia Pacific Engineering Services Outsourcing Industry Volume (Trillion), by End User 2025 & 2033
- Figure 33: Asia Pacific Engineering Services Outsourcing Industry Revenue Share (%), by End User 2025 & 2033
- Figure 34: Asia Pacific Engineering Services Outsourcing Industry Volume Share (%), by End User 2025 & 2033
- Figure 35: Asia Pacific Engineering Services Outsourcing Industry Revenue (Million), by Country 2025 & 2033
- Figure 36: Asia Pacific Engineering Services Outsourcing Industry Volume (Trillion), by Country 2025 & 2033
- Figure 37: Asia Pacific Engineering Services Outsourcing Industry Revenue Share (%), by Country 2025 & 2033
- Figure 38: Asia Pacific Engineering Services Outsourcing Industry Volume Share (%), by Country 2025 & 2033
- Figure 39: Rest of the World Engineering Services Outsourcing Industry Revenue (Million), by Services 2025 & 2033
- Figure 40: Rest of the World Engineering Services Outsourcing Industry Volume (Trillion), by Services 2025 & 2033
- Figure 41: Rest of the World Engineering Services Outsourcing Industry Revenue Share (%), by Services 2025 & 2033
- Figure 42: Rest of the World Engineering Services Outsourcing Industry Volume Share (%), by Services 2025 & 2033
- Figure 43: Rest of the World Engineering Services Outsourcing Industry Revenue (Million), by End User 2025 & 2033
- Figure 44: Rest of the World Engineering Services Outsourcing Industry Volume (Trillion), by End User 2025 & 2033
- Figure 45: Rest of the World Engineering Services Outsourcing Industry Revenue Share (%), by End User 2025 & 2033
- Figure 46: Rest of the World Engineering Services Outsourcing Industry Volume Share (%), by End User 2025 & 2033
- Figure 47: Rest of the World Engineering Services Outsourcing Industry Revenue (Million), by Country 2025 & 2033
- Figure 48: Rest of the World Engineering Services Outsourcing Industry Volume (Trillion), by Country 2025 & 2033
- Figure 49: Rest of the World Engineering Services Outsourcing Industry Revenue Share (%), by Country 2025 & 2033
- Figure 50: Rest of the World Engineering Services Outsourcing Industry Volume Share (%), by Country 2025 & 2033
List of Tables
- Table 1: Global Engineering Services Outsourcing Industry Revenue Million Forecast, by Services 2020 & 2033
- Table 2: Global Engineering Services Outsourcing Industry Volume Trillion Forecast, by Services 2020 & 2033
- Table 3: Global Engineering Services Outsourcing Industry Revenue Million Forecast, by End User 2020 & 2033
- Table 4: Global Engineering Services Outsourcing Industry Volume Trillion Forecast, by End User 2020 & 2033
- Table 5: Global Engineering Services Outsourcing Industry Revenue Million Forecast, by Region 2020 & 2033
- Table 6: Global Engineering Services Outsourcing Industry Volume Trillion Forecast, by Region 2020 & 2033
- Table 7: Global Engineering Services Outsourcing Industry Revenue Million Forecast, by Services 2020 & 2033
- Table 8: Global Engineering Services Outsourcing Industry Volume Trillion Forecast, by Services 2020 & 2033
- Table 9: Global Engineering Services Outsourcing Industry Revenue Million Forecast, by End User 2020 & 2033
- Table 10: Global Engineering Services Outsourcing Industry Volume Trillion Forecast, by End User 2020 & 2033
- Table 11: Global Engineering Services Outsourcing Industry Revenue Million Forecast, by Country 2020 & 2033
- Table 12: Global Engineering Services Outsourcing Industry Volume Trillion Forecast, by Country 2020 & 2033
- Table 13: United States Engineering Services Outsourcing Industry Revenue (Million) Forecast, by Application 2020 & 2033
- Table 14: United States Engineering Services Outsourcing Industry Volume (Trillion) Forecast, by Application 2020 & 2033
- Table 15: Canada Engineering Services Outsourcing Industry Revenue (Million) Forecast, by Application 2020 & 2033
- Table 16: Canada Engineering Services Outsourcing Industry Volume (Trillion) Forecast, by Application 2020 & 2033
- Table 17: Mexico Engineering Services Outsourcing Industry Revenue (Million) Forecast, by Application 2020 & 2033
- Table 18: Mexico Engineering Services Outsourcing Industry Volume (Trillion) Forecast, by Application 2020 & 2033
- Table 19: Global Engineering Services Outsourcing Industry Revenue Million Forecast, by Services 2020 & 2033
- Table 20: Global Engineering Services Outsourcing Industry Volume Trillion Forecast, by Services 2020 & 2033
- Table 21: Global Engineering Services Outsourcing Industry Revenue Million Forecast, by End User 2020 & 2033
- Table 22: Global Engineering Services Outsourcing Industry Volume Trillion Forecast, by End User 2020 & 2033
- Table 23: Global Engineering Services Outsourcing Industry Revenue Million Forecast, by Country 2020 & 2033
- Table 24: Global Engineering Services Outsourcing Industry Volume Trillion Forecast, by Country 2020 & 2033
- Table 25: United Kingdom Engineering Services Outsourcing Industry Revenue (Million) Forecast, by Application 2020 & 2033
- Table 26: United Kingdom Engineering Services Outsourcing Industry Volume (Trillion) Forecast, by Application 2020 & 2033
- Table 27: Germany Engineering Services Outsourcing Industry Revenue (Million) Forecast, by Application 2020 & 2033
- Table 28: Germany Engineering Services Outsourcing Industry Volume (Trillion) Forecast, by Application 2020 & 2033
- Table 29: France Engineering Services Outsourcing Industry Revenue (Million) Forecast, by Application 2020 & 2033
- Table 30: France Engineering Services Outsourcing Industry Volume (Trillion) Forecast, by Application 2020 & 2033
- Table 31: Italy Engineering Services Outsourcing Industry Revenue (Million) Forecast, by Application 2020 & 2033
- Table 32: Italy Engineering Services Outsourcing Industry Volume (Trillion) Forecast, by Application 2020 & 2033
- Table 33: Spain Engineering Services Outsourcing Industry Revenue (Million) Forecast, by Application 2020 & 2033
- Table 34: Spain Engineering Services Outsourcing Industry Volume (Trillion) Forecast, by Application 2020 & 2033
- Table 35: Rest of Europe Engineering Services Outsourcing Industry Revenue (Million) Forecast, by Application 2020 & 2033
- Table 36: Rest of Europe Engineering Services Outsourcing Industry Volume (Trillion) Forecast, by Application 2020 & 2033
- Table 37: Global Engineering Services Outsourcing Industry Revenue Million Forecast, by Services 2020 & 2033
- Table 38: Global Engineering Services Outsourcing Industry Volume Trillion Forecast, by Services 2020 & 2033
- Table 39: Global Engineering Services Outsourcing Industry Revenue Million Forecast, by End User 2020 & 2033
- Table 40: Global Engineering Services Outsourcing Industry Volume Trillion Forecast, by End User 2020 & 2033
- Table 41: Global Engineering Services Outsourcing Industry Revenue Million Forecast, by Country 2020 & 2033
- Table 42: Global Engineering Services Outsourcing Industry Volume Trillion Forecast, by Country 2020 & 2033
- Table 43: China Engineering Services Outsourcing Industry Revenue (Million) Forecast, by Application 2020 & 2033
- Table 44: China Engineering Services Outsourcing Industry Volume (Trillion) Forecast, by Application 2020 & 2033
- Table 45: India Engineering Services Outsourcing Industry Revenue (Million) Forecast, by Application 2020 & 2033
- Table 46: India Engineering Services Outsourcing Industry Volume (Trillion) Forecast, by Application 2020 & 2033
- Table 47: Japan Engineering Services Outsourcing Industry Revenue (Million) Forecast, by Application 2020 & 2033
- Table 48: Japan Engineering Services Outsourcing Industry Volume (Trillion) Forecast, by Application 2020 & 2033
- Table 49: South Korea Engineering Services Outsourcing Industry Revenue (Million) Forecast, by Application 2020 & 2033
- Table 50: South Korea Engineering Services Outsourcing Industry Volume (Trillion) Forecast, by Application 2020 & 2033
- Table 51: Thailand Engineering Services Outsourcing Industry Revenue (Million) Forecast, by Application 2020 & 2033
- Table 52: Thailand Engineering Services Outsourcing Industry Volume (Trillion) Forecast, by Application 2020 & 2033
- Table 53: Indonesia Engineering Services Outsourcing Industry Revenue (Million) Forecast, by Application 2020 & 2033
- Table 54: Indonesia Engineering Services Outsourcing Industry Volume (Trillion) Forecast, by Application 2020 & 2033
- Table 55: Rest of Asia pacific Engineering Services Outsourcing Industry Revenue (Million) Forecast, by Application 2020 & 2033
- Table 56: Rest of Asia pacific Engineering Services Outsourcing Industry Volume (Trillion) Forecast, by Application 2020 & 2033
- Table 57: Global Engineering Services Outsourcing Industry Revenue Million Forecast, by Services 2020 & 2033
- Table 58: Global Engineering Services Outsourcing Industry Volume Trillion Forecast, by Services 2020 & 2033
- Table 59: Global Engineering Services Outsourcing Industry Revenue Million Forecast, by End User 2020 & 2033
- Table 60: Global Engineering Services Outsourcing Industry Volume Trillion Forecast, by End User 2020 & 2033
- Table 61: Global Engineering Services Outsourcing Industry Revenue Million Forecast, by Country 2020 & 2033
- Table 62: Global Engineering Services Outsourcing Industry Volume Trillion Forecast, by Country 2020 & 2033
Frequently Asked Questions
1. What is the projected Compound Annual Growth Rate (CAGR) of the Engineering Services Outsourcing Industry?
The projected CAGR is approximately 12.89%.
2. Which companies are prominent players in the Engineering Services Outsourcing Industry?
Key companies in the market include Tech Mahindra Limited, Tata Consultancy Services Limited, Infosys Limited, HCL Technologies Limited, Wipro Ltd, Capgemini Technology Services India Limited, Globallogic Inc, Accenture, RLE International Inc, ASAP Holding GmbH, Tata Technologies**List Not Exhaustive.
3. What are the main segments of the Engineering Services Outsourcing Industry?
The market segments include Services, End User.
4. Can you provide details about the market size?
The market size is estimated to be USD 2.91 Million as of 2022.
5. What are some drivers contributing to market growth?
N/A
6. What are the notable trends driving market growth?
Rising Adoption of Integrated Solutions Driving the Growth of the Market.
7. Are there any restraints impacting market growth?
N/A
8. Can you provide examples of recent developments in the market?
April 2023: The relationship between Marks and Spencer PLC (M&S) and Tata Consultancy Services (TCS) has been extended to change M&S's core technology stack, increase innovation speed and resilience, and promote sustainable growth. The modernization program will enhance speed to market, lower technological debt, and boost operating model efficiency and effectiveness for M&S. M&S' strategic aims of providing better customer experience, driving online growth, leading in omnichannel and sustainability, modernizing its supply chain, increasing its worldwide reach will be expedited by the transformation into a simple, agile, data-led business.
9. What pricing options are available for accessing the report?
Pricing options include single-user, multi-user, and enterprise licenses priced at USD 4750, USD 5250, and USD 8750 respectively.
10. Is the market size provided in terms of value or volume?
The market size is provided in terms of value, measured in Million and volume, measured in Trillion.
11. Are there any specific market keywords associated with the report?
Yes, the market keyword associated with the report is "Engineering Services Outsourcing Industry," which aids in identifying and referencing the specific market segment covered.
12. How do I determine which pricing option suits my needs best?
The pricing options vary based on user requirements and access needs. Individual users may opt for single-user licenses, while businesses requiring broader access may choose multi-user or enterprise licenses for cost-effective access to the report.
13. Are there any additional resources or data provided in the Engineering Services Outsourcing Industry report?
While the report offers comprehensive insights, it's advisable to review the specific contents or supplementary materials provided to ascertain if additional resources or data are available.
14. How can I stay updated on further developments or reports in the Engineering Services Outsourcing Industry?
To stay informed about further developments, trends, and reports in the Engineering Services Outsourcing Industry, consider subscribing to industry newsletters, following relevant companies and organizations, or regularly checking reputable industry news sources and publications.
Methodology
Step 1 - Identification of Relevant Samples Size from Population Database


Step 2 - Approaches for Defining Global Market Size (Value, Volume* & Price*)

Note*: In applicable scenarios
Step 3 - Data Sources
Primary Research
- Web Analytics
- Survey Reports
- Research Institute
- Latest Research Reports
- Opinion Leaders
Secondary Research
- Annual Reports
- White Paper
- Latest Press Release
- Industry Association
- Paid Database
- Investor Presentations

Step 4 - Data Triangulation
Involves using different sources of information in order to increase the validity of a study
These sources are likely to be stakeholders in a program - participants, other researchers, program staff, other community members, and so on.
Then we put all data in single framework & apply various statistical tools to find out the dynamic on the market.
During the analysis stage, feedback from the stakeholder groups would be compared to determine areas of agreement as well as areas of divergence