

Key Insights
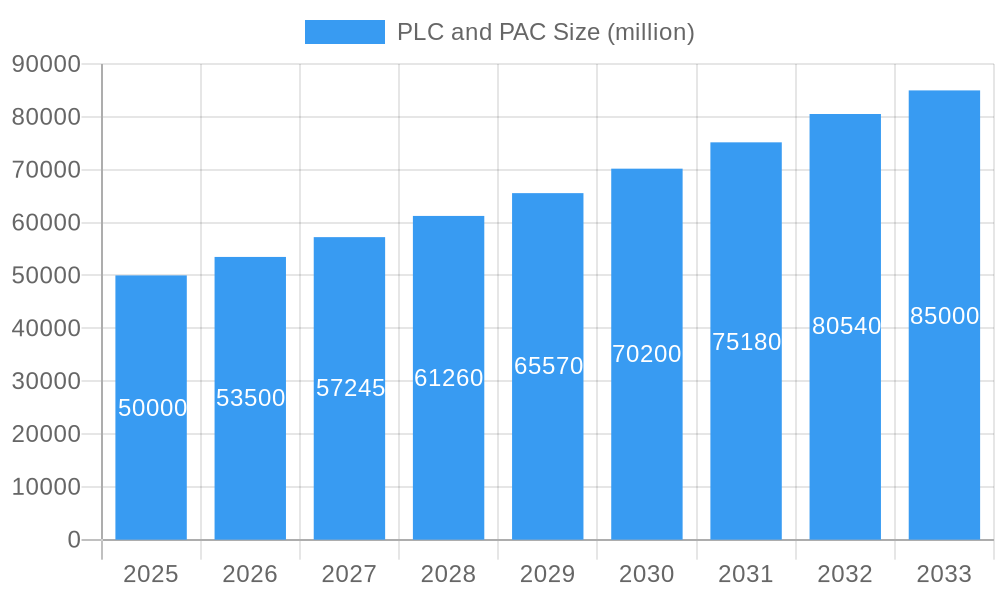
The global Programmable Logic Controller (PLC) and Programmable Automation Controller (PAC) market is poised for significant expansion, driven by the escalating demand for industrial automation. The market, valued at $17 billion in the base year of 2025, is projected to achieve a Compound Annual Growth Rate (CAGR) of 4.47%. This growth is propelled by the widespread adoption of Industry 4.0 principles, the increasing need for sophisticated process control in manufacturing, and the demand for efficient automation solutions across sectors including automotive, food & beverage, and energy. Furthermore, the integration of cloud technologies, Artificial Intelligence (AI), and Machine Learning (ML) into PLCs and PACs is a key growth enabler.
PLC and PAC Market Size (In Billion)
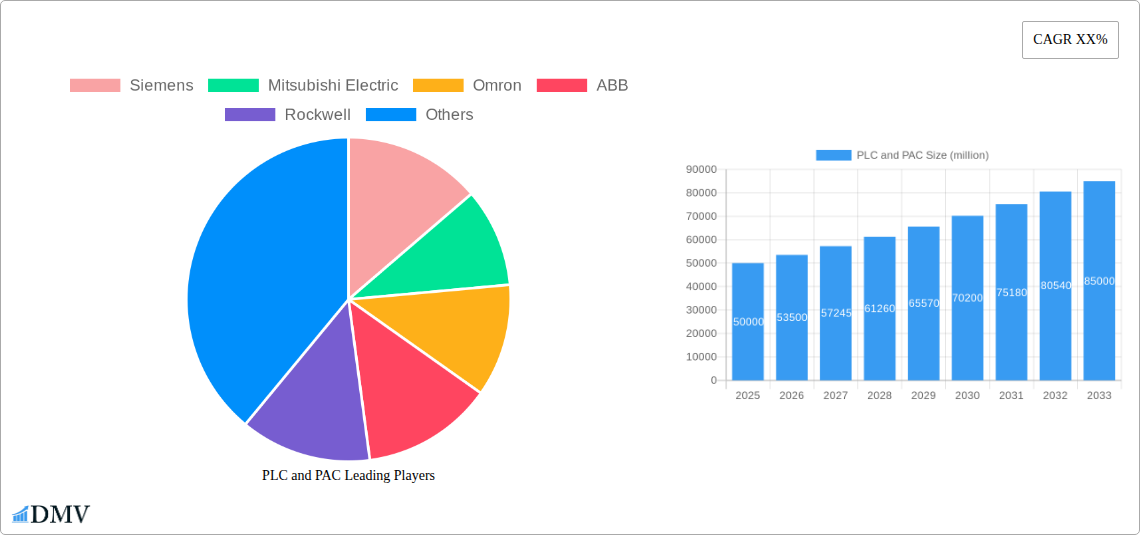
Key industry leaders such as Siemens, Mitsubishi Electric, Omron, ABB, and Rockwell Automation command a substantial market share. The competitive environment also includes specialized vendors like Beckhoff, National Instruments, and Artila Electronics, who focus on niche applications and technological innovation. Notable market challenges include substantial upfront investment, integration complexities with legacy systems, and the requirement for skilled personnel. Cybersecurity concerns and data privacy also present potential restraints. To address these, vendors are prioritizing user-friendly interfaces, robust support services, and enhanced cybersecurity features. The market anticipates strong growth in emerging economies within Asia-Pacific and Latin America, fueled by ongoing industrialization and infrastructure development.
PLC and PAC Company Market Share
Unlocking the Multi-Million Dollar Potential of the PLC and PAC Market: A Comprehensive Report (2019-2033)
This insightful report provides a comprehensive analysis of the Programmable Logic Controller (PLC) and Programmable Automation Controller (PAC) market, projecting a multi-million dollar valuation by 2033. We delve deep into market dynamics, technological advancements, and key players, offering stakeholders a crucial roadmap for navigating this rapidly evolving landscape. The study covers the period from 2019 to 2033, with 2025 serving as both the base and estimated year. Our forecast spans 2025-2033, building upon the historical data from 2019-2024. The report provides critical insights for informed decision-making, backed by robust data and analysis.
PLC and PAC Market Composition & Trends
This section examines the current market structure, key trends, and influencing factors impacting the PLC and PAC industry. We analyze market concentration, identifying leading players and their respective market shares. The report also delves into innovation catalysts, regulatory landscapes, the impact of substitute products, end-user profiles across various sectors, and the role of mergers and acquisitions (M&A) activities.
- Market Share Distribution (2025): Siemens (xx%), Rockwell (xx%), Mitsubishi Electric (xx%), Omron (xx%), ABB (xx%), Others (xx%). (Note: xx represents estimated market share percentages due to data limitations).
- M&A Activity: The report details significant M&A deals within the industry during the study period, including deal values (in millions of dollars) and their impact on market consolidation. Analysis includes xx million in total M&A deal values during the 2019-2024 period, projecting xx million for 2025-2033. The impact of these transactions on market competition and innovation is thoroughly explored.
- Regulatory Landscape: The report assesses the impact of industry regulations and standards on PLC and PAC adoption and market growth, examining differences across key regions. This includes an analysis of compliance costs and their influence on pricing strategies.
- Innovation Catalysts: This section identifies key technological advancements (e.g., IoT integration, AI-powered functionalities) driving PLC and PAC innovation, highlighting their influence on industry competitiveness.
The report further analyses end-user profiles across various sectors (Manufacturing, Automotive, Energy, etc.) to illustrate the diverse application of PLC and PAC systems, emphasizing their unique needs and preferences. We project a xx million increase in end-user investment in PLCs and PACs from 2025 to 2033.
PLC and PAC Industry Evolution
This section details the evolutionary trajectory of the PLC and PAC market, analyzing market growth trajectories, technological advancements, and shifting consumer demands from 2019 to 2033. Specific data points, such as compound annual growth rates (CAGR) and adoption rates across various segments and regions, are provided. The analysis further investigates the impact of industry 4.0 and its implications on the market dynamics, including the growing adoption of cloud-based solutions and digital twins. We project a CAGR of xx% for the PLC and PAC market during the forecast period (2025-2033), driven primarily by increasing automation needs across diverse sectors. The report also explores the evolving consumer demands for more efficient, flexible, and secure automation solutions. This includes a detailed analysis of the increasing focus on energy efficiency and sustainability in industrial automation, leading to the adoption of more energy-efficient PLCs and PACs. The evolution of cybersecurity concerns and its implication on market dynamics is also explored, revealing the significant investment in robust security solutions for PLC and PAC systems.
Leading Regions, Countries, or Segments in PLC and PAC
This section pinpoints the dominant regions, countries, or market segments within the PLC and PAC industry. The report identifies the leading region and provides a comprehensive analysis of the factors driving its dominance.
- Key Drivers:
- Investment Trends: Significant investments in infrastructure development and industrial automation projects in the leading region.
- Regulatory Support: Government incentives and supportive policies promoting automation and technological advancements in the leading region.
- Industry Clusters: Concentration of key industry players and related businesses, fostering collaboration and innovation.
- Skilled Workforce: Availability of skilled labor proficient in PLC and PAC programming and maintenance.
Detailed analysis reveals that [Insert Dominant Region/Country] holds the largest market share, attributed to factors such as robust industrial growth, high investment in infrastructure, and supportive government policies.
PLC and PAC Product Innovations
Recent innovations in PLCs and PACs include advancements in communication protocols (e.g., TSN, OPC UA), enhanced cybersecurity features, and the integration of advanced analytics capabilities for improved process optimization. These advancements enable seamless integration with Industrial IoT (IIoT) platforms, facilitating data-driven decision-making and predictive maintenance. The unique selling propositions of leading vendors are analyzed, showcasing their competitive strategies and technological leadership. The market for high-performance, compact, and modular PLCs and PACs is experiencing rapid growth, driven by increasing demand for flexible and scalable automation solutions.
Propelling Factors for PLC and PAC Growth
Several key factors contribute to the projected growth of the PLC and PAC market. These include increasing automation demands across industries, technological advancements in PLC and PAC technology, government initiatives promoting industrial automation, and the growing adoption of Industry 4.0 principles. The rising adoption of robotics and autonomous systems further drives the demand for sophisticated PLC and PAC systems. Moreover, the increasing need for data-driven insights in industrial operations is fueling demand for PLCs and PACs with advanced data analytics capabilities.
Obstacles in the PLC and PAC Market
Despite the growth potential, the PLC and PAC market faces several challenges, including the increasing complexity of automation systems, cybersecurity concerns, and the volatility of raw material prices. Supply chain disruptions and skilled labor shortages also pose significant obstacles. Furthermore, intensifying competition from newer entrants and the pressure to reduce operational costs are impacting the profitability of established players. These factors can potentially restrain market growth if not effectively addressed. These challenges are analyzed, providing quantitative estimates of their potential impact.
Future Opportunities in PLC and PAC
The future of the PLC and PAC market holds significant opportunities. The convergence of IoT, AI, and cloud computing is expected to unlock new capabilities for industrial automation. Emerging applications in areas such as smart manufacturing, renewable energy, and building automation present substantial growth potential. The rising focus on sustainability and energy efficiency in industrial operations is creating demand for PLCs and PACs with enhanced energy-saving features. We project xx million in new market opportunities by 2033, specifically in these emerging sectors.
Major Players in the PLC and PAC Ecosystem
- Siemens
- Mitsubishi Electric
- Omron
- ABB
- Rockwell
- Beckhoff
- Schneider Electric
- Panasonic
- National Instruments
- Artila Electronics
- Googol Technology
- Emerson
- Bosch Rexroth
- Fuji
- Toshiba
- Keyence
- Idec
- Koyo
Key Developments in PLC and PAC Industry
- [Month, Year]: [Company Name] launched a new PLC with advanced AI capabilities.
- [Month, Year]: [Company A] and [Company B] announced a strategic partnership to develop next-generation PAC systems.
- [Month, Year]: New safety standards were introduced, impacting the design and implementation of PLC and PAC systems.
- [Month, Year]: Significant investment in research and development for enhancing cybersecurity features in PLC and PAC systems.
(Note: Replace bracketed information with actual data.)
Strategic PLC and PAC Market Forecast
The PLC and PAC market is poised for sustained growth, driven by robust demand across diverse industries and technological innovations. The integration of cutting-edge technologies like AI and IoT will significantly enhance the capabilities of these systems, creating new market opportunities. The expanding adoption of automation solutions in emerging economies and the increasing focus on digital transformation will further propel market growth. We anticipate continued market consolidation, with strategic partnerships and acquisitions shaping the competitive landscape. The projected xx million market value by 2033 underscores the significant growth potential within this dynamic sector.
PLC and PAC Segmentation
-
1. Application
- 1.1. Machine Tool
- 1.2. Packaging
- 1.3. Printing
- 1.4. Automotive
- 1.5. Semiconductor
- 1.6. Metallurgical
- 1.7. Chemical
- 1.8. Power
- 1.9. Oil and Gas
- 1.10. Others
-
2. Types
- 2.1. Programmable Logic Controllers (PLCs)
- 2.2. Programmable Automation Controllers (PACs)
PLC and PAC Segmentation By Geography
-
1. North America
- 1.1. United States
- 1.2. Canada
- 1.3. Mexico
-
2. South America
- 2.1. Brazil
- 2.2. Argentina
- 2.3. Rest of South America
-
3. Europe
- 3.1. United Kingdom
- 3.2. Germany
- 3.3. France
- 3.4. Italy
- 3.5. Spain
- 3.6. Russia
- 3.7. Benelux
- 3.8. Nordics
- 3.9. Rest of Europe
-
4. Middle East & Africa
- 4.1. Turkey
- 4.2. Israel
- 4.3. GCC
- 4.4. North Africa
- 4.5. South Africa
- 4.6. Rest of Middle East & Africa
-
5. Asia Pacific
- 5.1. China
- 5.2. India
- 5.3. Japan
- 5.4. South Korea
- 5.5. ASEAN
- 5.6. Oceania
- 5.7. Rest of Asia Pacific

PLC and PAC Regional Market Share
Geographic Coverage of PLC and PAC
PLC and PAC REPORT HIGHLIGHTS
| Aspects | Details |
|---|---|
| Study Period | 2020-2034 |
| Base Year | 2025 |
| Estimated Year | 2026 |
| Forecast Period | 2026-2034 |
| Historical Period | 2020-2025 |
| Growth Rate | CAGR of 4.47% from 2020-2034 |
| Segmentation |
|
Table of Contents
- 1. Introduction
- 1.1. Research Scope
- 1.2. Market Segmentation
- 1.3. Research Methodology
- 1.4. Definitions and Assumptions
- 2. Executive Summary
- 2.1. Introduction
- 3. Market Dynamics
- 3.1. Introduction
- 3.2. Market Drivers
- 3.3. Market Restrains
- 3.4. Market Trends
- 4. Market Factor Analysis
- 4.1. Porters Five Forces
- 4.2. Supply/Value Chain
- 4.3. PESTEL analysis
- 4.4. Market Entropy
- 4.5. Patent/Trademark Analysis
- 5. Global PLC and PAC Analysis, Insights and Forecast, 2020-2032
- 5.1. Market Analysis, Insights and Forecast - by Application
- 5.1.1. Machine Tool
- 5.1.2. Packaging
- 5.1.3. Printing
- 5.1.4. Automotive
- 5.1.5. Semiconductor
- 5.1.6. Metallurgical
- 5.1.7. Chemical
- 5.1.8. Power
- 5.1.9. Oil and Gas
- 5.1.10. Others
- 5.2. Market Analysis, Insights and Forecast - by Types
- 5.2.1. Programmable Logic Controllers (PLCs)
- 5.2.2. Programmable Automation Controllers (PACs)
- 5.3. Market Analysis, Insights and Forecast - by Region
- 5.3.1. North America
- 5.3.2. South America
- 5.3.3. Europe
- 5.3.4. Middle East & Africa
- 5.3.5. Asia Pacific
- 5.1. Market Analysis, Insights and Forecast - by Application
- 6. North America PLC and PAC Analysis, Insights and Forecast, 2020-2032
- 6.1. Market Analysis, Insights and Forecast - by Application
- 6.1.1. Machine Tool
- 6.1.2. Packaging
- 6.1.3. Printing
- 6.1.4. Automotive
- 6.1.5. Semiconductor
- 6.1.6. Metallurgical
- 6.1.7. Chemical
- 6.1.8. Power
- 6.1.9. Oil and Gas
- 6.1.10. Others
- 6.2. Market Analysis, Insights and Forecast - by Types
- 6.2.1. Programmable Logic Controllers (PLCs)
- 6.2.2. Programmable Automation Controllers (PACs)
- 6.1. Market Analysis, Insights and Forecast - by Application
- 7. South America PLC and PAC Analysis, Insights and Forecast, 2020-2032
- 7.1. Market Analysis, Insights and Forecast - by Application
- 7.1.1. Machine Tool
- 7.1.2. Packaging
- 7.1.3. Printing
- 7.1.4. Automotive
- 7.1.5. Semiconductor
- 7.1.6. Metallurgical
- 7.1.7. Chemical
- 7.1.8. Power
- 7.1.9. Oil and Gas
- 7.1.10. Others
- 7.2. Market Analysis, Insights and Forecast - by Types
- 7.2.1. Programmable Logic Controllers (PLCs)
- 7.2.2. Programmable Automation Controllers (PACs)
- 7.1. Market Analysis, Insights and Forecast - by Application
- 8. Europe PLC and PAC Analysis, Insights and Forecast, 2020-2032
- 8.1. Market Analysis, Insights and Forecast - by Application
- 8.1.1. Machine Tool
- 8.1.2. Packaging
- 8.1.3. Printing
- 8.1.4. Automotive
- 8.1.5. Semiconductor
- 8.1.6. Metallurgical
- 8.1.7. Chemical
- 8.1.8. Power
- 8.1.9. Oil and Gas
- 8.1.10. Others
- 8.2. Market Analysis, Insights and Forecast - by Types
- 8.2.1. Programmable Logic Controllers (PLCs)
- 8.2.2. Programmable Automation Controllers (PACs)
- 8.1. Market Analysis, Insights and Forecast - by Application
- 9. Middle East & Africa PLC and PAC Analysis, Insights and Forecast, 2020-2032
- 9.1. Market Analysis, Insights and Forecast - by Application
- 9.1.1. Machine Tool
- 9.1.2. Packaging
- 9.1.3. Printing
- 9.1.4. Automotive
- 9.1.5. Semiconductor
- 9.1.6. Metallurgical
- 9.1.7. Chemical
- 9.1.8. Power
- 9.1.9. Oil and Gas
- 9.1.10. Others
- 9.2. Market Analysis, Insights and Forecast - by Types
- 9.2.1. Programmable Logic Controllers (PLCs)
- 9.2.2. Programmable Automation Controllers (PACs)
- 9.1. Market Analysis, Insights and Forecast - by Application
- 10. Asia Pacific PLC and PAC Analysis, Insights and Forecast, 2020-2032
- 10.1. Market Analysis, Insights and Forecast - by Application
- 10.1.1. Machine Tool
- 10.1.2. Packaging
- 10.1.3. Printing
- 10.1.4. Automotive
- 10.1.5. Semiconductor
- 10.1.6. Metallurgical
- 10.1.7. Chemical
- 10.1.8. Power
- 10.1.9. Oil and Gas
- 10.1.10. Others
- 10.2. Market Analysis, Insights and Forecast - by Types
- 10.2.1. Programmable Logic Controllers (PLCs)
- 10.2.2. Programmable Automation Controllers (PACs)
- 10.1. Market Analysis, Insights and Forecast - by Application
- 11. Competitive Analysis
- 11.1. Global Market Share Analysis 2025
- 11.2. Company Profiles
- 11.2.1 Siemens
- 11.2.1.1. Overview
- 11.2.1.2. Products
- 11.2.1.3. SWOT Analysis
- 11.2.1.4. Recent Developments
- 11.2.1.5. Financials (Based on Availability)
- 11.2.2 Mitsubishi Electric
- 11.2.2.1. Overview
- 11.2.2.2. Products
- 11.2.2.3. SWOT Analysis
- 11.2.2.4. Recent Developments
- 11.2.2.5. Financials (Based on Availability)
- 11.2.3 Omron
- 11.2.3.1. Overview
- 11.2.3.2. Products
- 11.2.3.3. SWOT Analysis
- 11.2.3.4. Recent Developments
- 11.2.3.5. Financials (Based on Availability)
- 11.2.4 ABB
- 11.2.4.1. Overview
- 11.2.4.2. Products
- 11.2.4.3. SWOT Analysis
- 11.2.4.4. Recent Developments
- 11.2.4.5. Financials (Based on Availability)
- 11.2.5 Rockwell
- 11.2.5.1. Overview
- 11.2.5.2. Products
- 11.2.5.3. SWOT Analysis
- 11.2.5.4. Recent Developments
- 11.2.5.5. Financials (Based on Availability)
- 11.2.6 Beckhoff
- 11.2.6.1. Overview
- 11.2.6.2. Products
- 11.2.6.3. SWOT Analysis
- 11.2.6.4. Recent Developments
- 11.2.6.5. Financials (Based on Availability)
- 11.2.7 Schneider
- 11.2.7.1. Overview
- 11.2.7.2. Products
- 11.2.7.3. SWOT Analysis
- 11.2.7.4. Recent Developments
- 11.2.7.5. Financials (Based on Availability)
- 11.2.8 Panasonic
- 11.2.8.1. Overview
- 11.2.8.2. Products
- 11.2.8.3. SWOT Analysis
- 11.2.8.4. Recent Developments
- 11.2.8.5. Financials (Based on Availability)
- 11.2.9 National Instruments
- 11.2.9.1. Overview
- 11.2.9.2. Products
- 11.2.9.3. SWOT Analysis
- 11.2.9.4. Recent Developments
- 11.2.9.5. Financials (Based on Availability)
- 11.2.10 Artila Electronics
- 11.2.10.1. Overview
- 11.2.10.2. Products
- 11.2.10.3. SWOT Analysis
- 11.2.10.4. Recent Developments
- 11.2.10.5. Financials (Based on Availability)
- 11.2.11 Googol Technology
- 11.2.11.1. Overview
- 11.2.11.2. Products
- 11.2.11.3. SWOT Analysis
- 11.2.11.4. Recent Developments
- 11.2.11.5. Financials (Based on Availability)
- 11.2.12 Emerson
- 11.2.12.1. Overview
- 11.2.12.2. Products
- 11.2.12.3. SWOT Analysis
- 11.2.12.4. Recent Developments
- 11.2.12.5. Financials (Based on Availability)
- 11.2.13 Bosch Rexroth
- 11.2.13.1. Overview
- 11.2.13.2. Products
- 11.2.13.3. SWOT Analysis
- 11.2.13.4. Recent Developments
- 11.2.13.5. Financials (Based on Availability)
- 11.2.14 Fuji
- 11.2.14.1. Overview
- 11.2.14.2. Products
- 11.2.14.3. SWOT Analysis
- 11.2.14.4. Recent Developments
- 11.2.14.5. Financials (Based on Availability)
- 11.2.15 Toshiba
- 11.2.15.1. Overview
- 11.2.15.2. Products
- 11.2.15.3. SWOT Analysis
- 11.2.15.4. Recent Developments
- 11.2.15.5. Financials (Based on Availability)
- 11.2.16 Keyence
- 11.2.16.1. Overview
- 11.2.16.2. Products
- 11.2.16.3. SWOT Analysis
- 11.2.16.4. Recent Developments
- 11.2.16.5. Financials (Based on Availability)
- 11.2.17 Idec
- 11.2.17.1. Overview
- 11.2.17.2. Products
- 11.2.17.3. SWOT Analysis
- 11.2.17.4. Recent Developments
- 11.2.17.5. Financials (Based on Availability)
- 11.2.18 Koyo
- 11.2.18.1. Overview
- 11.2.18.2. Products
- 11.2.18.3. SWOT Analysis
- 11.2.18.4. Recent Developments
- 11.2.18.5. Financials (Based on Availability)
- 11.2.1 Siemens
List of Figures
- Figure 1: Global PLC and PAC Revenue Breakdown (billion, %) by Region 2025 & 2033
- Figure 2: North America PLC and PAC Revenue (billion), by Application 2025 & 2033
- Figure 3: North America PLC and PAC Revenue Share (%), by Application 2025 & 2033
- Figure 4: North America PLC and PAC Revenue (billion), by Types 2025 & 2033
- Figure 5: North America PLC and PAC Revenue Share (%), by Types 2025 & 2033
- Figure 6: North America PLC and PAC Revenue (billion), by Country 2025 & 2033
- Figure 7: North America PLC and PAC Revenue Share (%), by Country 2025 & 2033
- Figure 8: South America PLC and PAC Revenue (billion), by Application 2025 & 2033
- Figure 9: South America PLC and PAC Revenue Share (%), by Application 2025 & 2033
- Figure 10: South America PLC and PAC Revenue (billion), by Types 2025 & 2033
- Figure 11: South America PLC and PAC Revenue Share (%), by Types 2025 & 2033
- Figure 12: South America PLC and PAC Revenue (billion), by Country 2025 & 2033
- Figure 13: South America PLC and PAC Revenue Share (%), by Country 2025 & 2033
- Figure 14: Europe PLC and PAC Revenue (billion), by Application 2025 & 2033
- Figure 15: Europe PLC and PAC Revenue Share (%), by Application 2025 & 2033
- Figure 16: Europe PLC and PAC Revenue (billion), by Types 2025 & 2033
- Figure 17: Europe PLC and PAC Revenue Share (%), by Types 2025 & 2033
- Figure 18: Europe PLC and PAC Revenue (billion), by Country 2025 & 2033
- Figure 19: Europe PLC and PAC Revenue Share (%), by Country 2025 & 2033
- Figure 20: Middle East & Africa PLC and PAC Revenue (billion), by Application 2025 & 2033
- Figure 21: Middle East & Africa PLC and PAC Revenue Share (%), by Application 2025 & 2033
- Figure 22: Middle East & Africa PLC and PAC Revenue (billion), by Types 2025 & 2033
- Figure 23: Middle East & Africa PLC and PAC Revenue Share (%), by Types 2025 & 2033
- Figure 24: Middle East & Africa PLC and PAC Revenue (billion), by Country 2025 & 2033
- Figure 25: Middle East & Africa PLC and PAC Revenue Share (%), by Country 2025 & 2033
- Figure 26: Asia Pacific PLC and PAC Revenue (billion), by Application 2025 & 2033
- Figure 27: Asia Pacific PLC and PAC Revenue Share (%), by Application 2025 & 2033
- Figure 28: Asia Pacific PLC and PAC Revenue (billion), by Types 2025 & 2033
- Figure 29: Asia Pacific PLC and PAC Revenue Share (%), by Types 2025 & 2033
- Figure 30: Asia Pacific PLC and PAC Revenue (billion), by Country 2025 & 2033
- Figure 31: Asia Pacific PLC and PAC Revenue Share (%), by Country 2025 & 2033
List of Tables
- Table 1: Global PLC and PAC Revenue billion Forecast, by Application 2020 & 2033
- Table 2: Global PLC and PAC Revenue billion Forecast, by Types 2020 & 2033
- Table 3: Global PLC and PAC Revenue billion Forecast, by Region 2020 & 2033
- Table 4: Global PLC and PAC Revenue billion Forecast, by Application 2020 & 2033
- Table 5: Global PLC and PAC Revenue billion Forecast, by Types 2020 & 2033
- Table 6: Global PLC and PAC Revenue billion Forecast, by Country 2020 & 2033
- Table 7: United States PLC and PAC Revenue (billion) Forecast, by Application 2020 & 2033
- Table 8: Canada PLC and PAC Revenue (billion) Forecast, by Application 2020 & 2033
- Table 9: Mexico PLC and PAC Revenue (billion) Forecast, by Application 2020 & 2033
- Table 10: Global PLC and PAC Revenue billion Forecast, by Application 2020 & 2033
- Table 11: Global PLC and PAC Revenue billion Forecast, by Types 2020 & 2033
- Table 12: Global PLC and PAC Revenue billion Forecast, by Country 2020 & 2033
- Table 13: Brazil PLC and PAC Revenue (billion) Forecast, by Application 2020 & 2033
- Table 14: Argentina PLC and PAC Revenue (billion) Forecast, by Application 2020 & 2033
- Table 15: Rest of South America PLC and PAC Revenue (billion) Forecast, by Application 2020 & 2033
- Table 16: Global PLC and PAC Revenue billion Forecast, by Application 2020 & 2033
- Table 17: Global PLC and PAC Revenue billion Forecast, by Types 2020 & 2033
- Table 18: Global PLC and PAC Revenue billion Forecast, by Country 2020 & 2033
- Table 19: United Kingdom PLC and PAC Revenue (billion) Forecast, by Application 2020 & 2033
- Table 20: Germany PLC and PAC Revenue (billion) Forecast, by Application 2020 & 2033
- Table 21: France PLC and PAC Revenue (billion) Forecast, by Application 2020 & 2033
- Table 22: Italy PLC and PAC Revenue (billion) Forecast, by Application 2020 & 2033
- Table 23: Spain PLC and PAC Revenue (billion) Forecast, by Application 2020 & 2033
- Table 24: Russia PLC and PAC Revenue (billion) Forecast, by Application 2020 & 2033
- Table 25: Benelux PLC and PAC Revenue (billion) Forecast, by Application 2020 & 2033
- Table 26: Nordics PLC and PAC Revenue (billion) Forecast, by Application 2020 & 2033
- Table 27: Rest of Europe PLC and PAC Revenue (billion) Forecast, by Application 2020 & 2033
- Table 28: Global PLC and PAC Revenue billion Forecast, by Application 2020 & 2033
- Table 29: Global PLC and PAC Revenue billion Forecast, by Types 2020 & 2033
- Table 30: Global PLC and PAC Revenue billion Forecast, by Country 2020 & 2033
- Table 31: Turkey PLC and PAC Revenue (billion) Forecast, by Application 2020 & 2033
- Table 32: Israel PLC and PAC Revenue (billion) Forecast, by Application 2020 & 2033
- Table 33: GCC PLC and PAC Revenue (billion) Forecast, by Application 2020 & 2033
- Table 34: North Africa PLC and PAC Revenue (billion) Forecast, by Application 2020 & 2033
- Table 35: South Africa PLC and PAC Revenue (billion) Forecast, by Application 2020 & 2033
- Table 36: Rest of Middle East & Africa PLC and PAC Revenue (billion) Forecast, by Application 2020 & 2033
- Table 37: Global PLC and PAC Revenue billion Forecast, by Application 2020 & 2033
- Table 38: Global PLC and PAC Revenue billion Forecast, by Types 2020 & 2033
- Table 39: Global PLC and PAC Revenue billion Forecast, by Country 2020 & 2033
- Table 40: China PLC and PAC Revenue (billion) Forecast, by Application 2020 & 2033
- Table 41: India PLC and PAC Revenue (billion) Forecast, by Application 2020 & 2033
- Table 42: Japan PLC and PAC Revenue (billion) Forecast, by Application 2020 & 2033
- Table 43: South Korea PLC and PAC Revenue (billion) Forecast, by Application 2020 & 2033
- Table 44: ASEAN PLC and PAC Revenue (billion) Forecast, by Application 2020 & 2033
- Table 45: Oceania PLC and PAC Revenue (billion) Forecast, by Application 2020 & 2033
- Table 46: Rest of Asia Pacific PLC and PAC Revenue (billion) Forecast, by Application 2020 & 2033
Frequently Asked Questions
1. What is the projected Compound Annual Growth Rate (CAGR) of the PLC and PAC?
The projected CAGR is approximately 4.47%.
2. Which companies are prominent players in the PLC and PAC?
Key companies in the market include Siemens, Mitsubishi Electric, Omron, ABB, Rockwell, Beckhoff, Schneider, Panasonic, National Instruments, Artila Electronics, Googol Technology, Emerson, Bosch Rexroth, Fuji, Toshiba, Keyence, Idec, Koyo.
3. What are the main segments of the PLC and PAC?
The market segments include Application, Types.
4. Can you provide details about the market size?
The market size is estimated to be USD 17 billion as of 2022.
5. What are some drivers contributing to market growth?
N/A
6. What are the notable trends driving market growth?
N/A
7. Are there any restraints impacting market growth?
N/A
8. Can you provide examples of recent developments in the market?
N/A
9. What pricing options are available for accessing the report?
Pricing options include single-user, multi-user, and enterprise licenses priced at USD 2900.00, USD 4350.00, and USD 5800.00 respectively.
10. Is the market size provided in terms of value or volume?
The market size is provided in terms of value, measured in billion.
11. Are there any specific market keywords associated with the report?
Yes, the market keyword associated with the report is "PLC and PAC," which aids in identifying and referencing the specific market segment covered.
12. How do I determine which pricing option suits my needs best?
The pricing options vary based on user requirements and access needs. Individual users may opt for single-user licenses, while businesses requiring broader access may choose multi-user or enterprise licenses for cost-effective access to the report.
13. Are there any additional resources or data provided in the PLC and PAC report?
While the report offers comprehensive insights, it's advisable to review the specific contents or supplementary materials provided to ascertain if additional resources or data are available.
14. How can I stay updated on further developments or reports in the PLC and PAC?
To stay informed about further developments, trends, and reports in the PLC and PAC, consider subscribing to industry newsletters, following relevant companies and organizations, or regularly checking reputable industry news sources and publications.
Methodology
Step 1 - Identification of Relevant Samples Size from Population Database


Step 2 - Approaches for Defining Global Market Size (Value, Volume* & Price*)

Note*: In applicable scenarios
Step 3 - Data Sources
Primary Research
- Web Analytics
- Survey Reports
- Research Institute
- Latest Research Reports
- Opinion Leaders
Secondary Research
- Annual Reports
- White Paper
- Latest Press Release
- Industry Association
- Paid Database
- Investor Presentations

Step 4 - Data Triangulation
Involves using different sources of information in order to increase the validity of a study
These sources are likely to be stakeholders in a program - participants, other researchers, program staff, other community members, and so on.
Then we put all data in single framework & apply various statistical tools to find out the dynamic on the market.
During the analysis stage, feedback from the stakeholder groups would be compared to determine areas of agreement as well as areas of divergence