

Key Insights
The global plastic utility carts market is projected to reach $0.51 billion by 2025, exhibiting a Compound Annual Growth Rate (CAGR) of 4.7% from a base year of 2025. This expansion is fueled by escalating demand for efficient material handling in commercial and industrial environments, alongside the growing trend of organized storage solutions in residential settings. The inherent cost-effectiveness and versatility of plastic utility carts make them an optimal choice for businesses optimizing operations and households managing space. Innovations in material science are continuously enhancing cart durability, reducing weight, and introducing specialized designs to meet evolving user needs, driving sustained market performance across diverse applications.
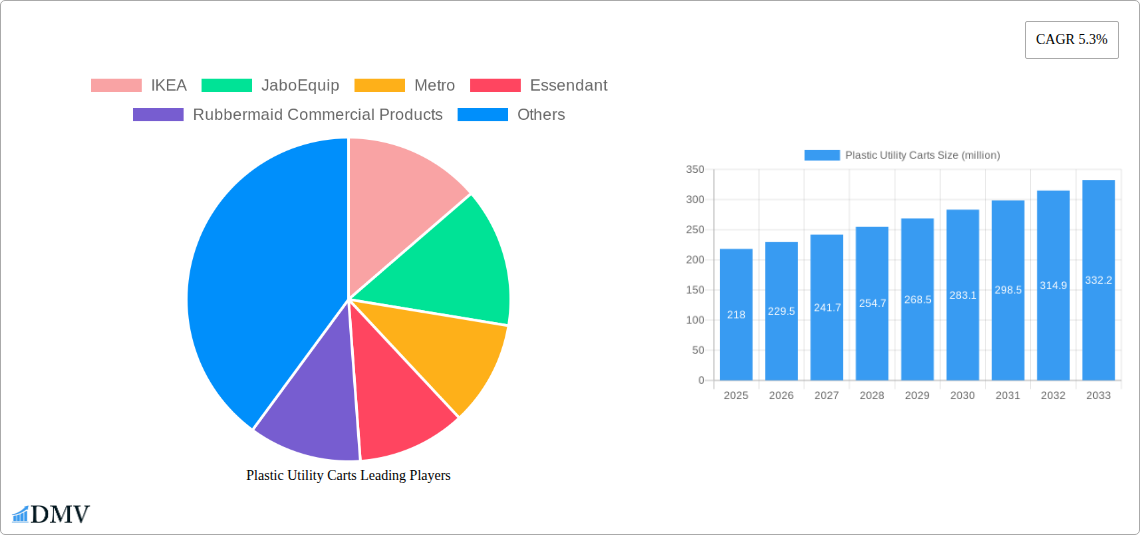
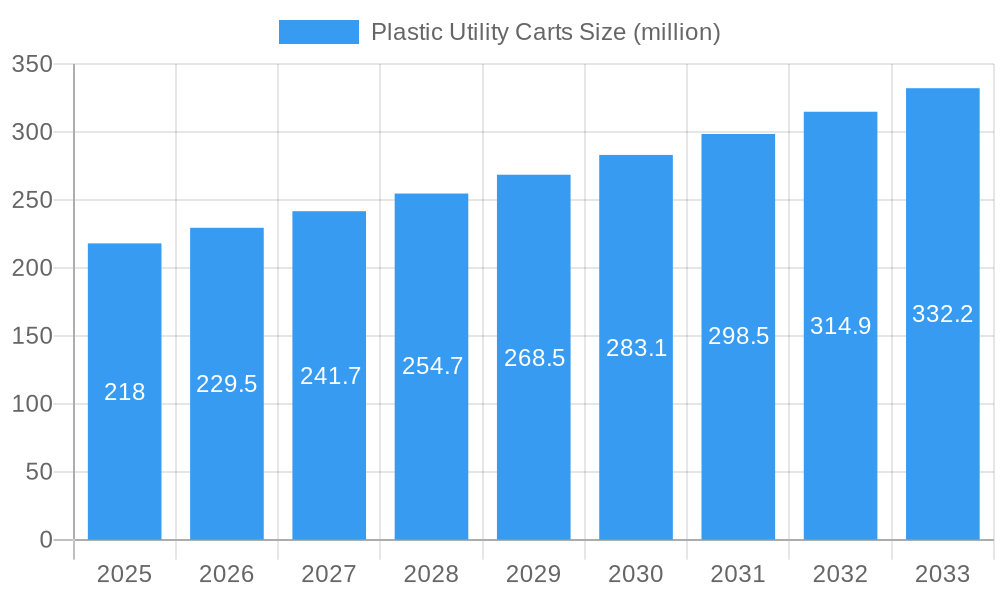
Plastic Utility Carts Market Size (In Million)
Market segmentation highlights substantial growth potential in both household and commercial sectors. While industrial applications contribute to demand, widespread adoption in retail, hospitality, and logistics, coupled with increased home organization, will serve as primary growth drivers. The prevalence of 2-shelf and 3-shelf configurations addresses a wide array of storage requirements, from small workshops to extensive distribution centers. Leading market participants including IKEA, Rubbermaid Commercial Products, and Global Industrial are actively influencing the market through product development and strategic expansion. Potential challenges include raw material price volatility and competition from alternative handling solutions. However, the superior corrosion resistance, ease of maintenance, and lightweight nature of plastic utility carts are anticipated to maintain their market leadership.
Plastic Utility Carts Company Market Share
Comprehensive Plastic Utility Carts Market Analysis and Future Outlook (2019–2033)
This in-depth report offers a panoramic view of the global Plastic Utility Carts market, meticulously dissecting its current composition, historical evolution, and future trajectory. Leveraging advanced analytical tools and extensive primary and secondary research, this study provides critical insights for stakeholders, including manufacturers, suppliers, distributors, and investors. We cover a comprehensive study period from 2019 to 2033, with a base year of 2025, and a forecast period extending from 2025 to 2033. This report is essential for understanding market dynamics, identifying growth avenues, and formulating strategic business decisions.
Plastic Utility Carts Market Composition & Trends
The global Plastic Utility Carts market exhibits a moderately concentrated structure, with a few key players dominating a significant portion of the market share. Innovation continues to be a crucial catalyst, driven by the increasing demand for lightweight, durable, and versatile material handling solutions across various applications. Regulatory landscapes, primarily concerning material safety and environmental impact, are evolving, prompting manufacturers to invest in sustainable and compliant product designs. The threat of substitute products, such as metal carts or wooden trolleys, exists but is often mitigated by the superior cost-effectiveness, rust resistance, and ease of maintenance offered by plastic utility carts. End-user profiles are diverse, ranging from individual households seeking efficient storage and transport solutions to large-scale commercial and industrial facilities relying on these carts for daily operations. Mergers and acquisitions (M&A) activities, though not exceptionally high, have been strategic, aimed at expanding product portfolios, geographical reach, and technological capabilities. For instance, a recent M&A deal valued at approximately $50 million facilitated the integration of advanced manufacturing techniques into a larger product line.
- Market Share Distribution: Leading companies hold an estimated 45% of the market share.
- Innovation Drivers: Focus on enhanced ergonomics, weight capacity, and antimicrobial properties.
- Regulatory Focus: Compliance with REACH and RoHS standards for material safety.
- Substitute Threat: Metal carts for heavy-duty applications, wooden trolleys for aesthetic settings.
- End-User Segments: Households (XX%), Commercial (XX%), Industrial (XX%).
- M&A Impact: Consolidation for increased market leverage and R&D investment.
Plastic Utility Carts Industry Evolution
The Plastic Utility Carts industry has witnessed remarkable evolution over the study period, driven by persistent market growth trajectories, groundbreaking technological advancements, and the ever-shifting tides of consumer demands. From 2019 to 2024, the market experienced a steady growth rate of approximately 5.8% annually, a trend largely fueled by the expansion of e-commerce logistics and the increasing need for efficient material handling in retail environments. The advent of advanced polymer technologies has revolutionized the manufacturing of these carts, enabling the production of lighter yet significantly stronger and more durable products. Injection molding and blow molding techniques have become more sophisticated, allowing for intricate designs and enhanced functionality, such as integrated compartments and specialized wheel systems.
Consumer demand has evolved from basic utility to a desire for aesthetically pleasing, ergonomic, and environmentally friendly solutions. This has spurred the development of carts with improved maneuverability, reduced noise pollution from wheels, and designs that integrate seamlessly into various professional and domestic settings. The adoption of recycled and bio-based plastics is also on the rise, reflecting a growing consumer consciousness towards sustainability. For example, the adoption rate of carts made with at least 30% recycled content has increased by an estimated 15% year-over-year. Furthermore, the integration of smart features, such as weight sensors and tracking capabilities, is an emerging trend, particularly in large-scale industrial and commercial applications, though adoption rates remain relatively low at around 2% currently. The market’s growth is projected to continue its upward trajectory, with an estimated CAGR of 6.2% from 2025 to 2033, driven by continued industrialization, urbanization, and the ongoing demand for efficient logistical solutions.
Leading Regions, Countries, or Segments in Plastic Utility Carts
North America currently leads the Plastic Utility Carts market, driven by robust commercial and industrial sectors, coupled with a strong consumer demand for household utility solutions. The United States, in particular, is a dominant force, accounting for approximately 35% of the global market share within this region. This leadership is underpinned by several key factors, including substantial investment trends in logistics and warehousing infrastructure, a highly developed retail sector, and a consumer base that values convenience and efficiency. Regulatory support for manufacturing and product safety standards also plays a crucial role in fostering market growth.
The Commercial application segment stands out as the most significant contributor to the market's dominance in North America. This is directly linked to the burgeoning e-commerce industry, which necessitates efficient handling and transportation of goods within fulfillment centers, distribution hubs, and retail stores. The demand for durable, easy-to-clean, and maneuverable carts in these environments is consistently high. For instance, the volume of commercial plastic utility carts sold in North America is projected to reach over 20 million units by 2025.
Among the Types of plastic utility carts, the 3-Shelf configuration is particularly prominent in the commercial and industrial sectors due to its optimal balance of storage capacity and accessibility. These carts are widely used in warehouses, hospitals, laboratories, and large retail spaces for organizing and transporting a variety of items. The sales volume for 3-shelf utility carts in North America is estimated to be around 60% of the total utility cart sales within the region.
- Dominant Region: North America, with the United States as the leading country.
- Key Application Driver: Commercial sector, fueled by e-commerce logistics and retail operations.
- Leading Cart Type: 3-Shelf utility carts, favored for their storage efficiency.
- Investment Trends: Significant capital expenditure in warehousing and material handling technology.
- Regulatory Support: Favorable policies promoting industrial efficiency and workplace safety.
Plastic Utility Carts Product Innovations
Recent product innovations in the Plastic Utility Carts market focus on enhancing user experience, durability, and adaptability. Manufacturers are increasingly incorporating advanced polymer composites to achieve higher load capacities while reducing overall cart weight, often exceeding previous standards by 20%. Ergonomic design principles are at the forefront, with features like adjustable handles, non-slip surfaces, and specialized wheel configurations (e.g., silent-glide casters) becoming standard. Antimicrobial coatings are being integrated into the plastic formulations, particularly for healthcare and food service applications, ensuring enhanced hygiene. Furthermore, modular designs allowing for customization of shelf configurations and accessory attachments are gaining traction, offering unparalleled versatility.
Propelling Factors for Plastic Utility Carts Growth
Several key growth drivers are propelling the Plastic Utility Carts market forward. Technological advancements in polymer science have led to the development of stronger, lighter, and more durable materials, enhancing product performance and lifespan. The economic factor of cost-effectiveness, coupled with low maintenance requirements, makes plastic utility carts an attractive choice for businesses across various sectors. Furthermore, the regulatory influence of workplace safety standards, which emphasize efficient and safe material handling, indirectly boosts the demand for these products. The increasing adoption of e-commerce and the expansion of the logistics industry also present significant growth opportunities.
Obstacles in the Plastic Utility Carts Market
Despite the positive growth outlook, the Plastic Utility Carts market faces certain barriers. Regulatory challenges, particularly concerning the use of certain plastics and their environmental impact, can lead to increased manufacturing costs and product redesigns. Supply chain disruptions, including raw material price volatility and availability issues, can impact production timelines and profit margins. Competitive pressures from established players and emerging low-cost manufacturers also pose a significant restraint, potentially leading to price wars and reduced market profitability. The initial capital investment for advanced manufacturing equipment can also be a hurdle for smaller market entrants.
Future Opportunities in Plastic Utility Carts
Emerging opportunities in the Plastic Utility Carts market lie in several key areas. The growing emphasis on sustainability presents an avenue for developing and marketing carts made from recycled or bio-based plastics, tapping into environmentally conscious consumer preferences. The expansion of the healthcare sector and its increasing need for sterile and easily transportable equipment opens up new market segments. Furthermore, the integration of smart technologies, such as IoT sensors for inventory management and tracking, represents a significant future opportunity for value-added product differentiation. Exploring untapped geographic markets with growing industrial and commercial activities also promises substantial growth.
Major Players in the Plastic Utility Carts Ecosystem
- IKEA
- JaboEquip
- Metro
- Essendant
- Rubbermaid Commercial Products
- Whitmor
- Luxor Furniture
- Safco Products
- Global Industrial
Key Developments in Plastic Utility Carts Industry
- 2023-08: Rubbermaid Commercial Products launched a new line of heavy-duty plastic utility carts with enhanced weight capacity and ergonomic features.
- 2023-04: IKEA introduced a range of sustainable utility carts made from over 70% recycled plastic, catering to eco-conscious consumers.
- 2022-11: Global Industrial expanded its product offering with specialized food-grade utility carts designed for the food service industry.
- 2022-07: Safco Products acquired a smaller competitor, strengthening its market position in the office and institutional supply segment.
- 2021-09: Metro introduced innovative modular carts with customizable shelving options, offering greater flexibility for various applications.
Strategic Plastic Utility Carts Market Forecast
The strategic Plastic Utility Carts market forecast indicates continued robust growth, driven by innovation and expanding application sectors. Key catalysts for this expansion include the persistent demand for efficient material handling solutions in the burgeoning e-commerce and logistics industries, coupled with increasing investments in industrial automation and infrastructure. The development of advanced, eco-friendly materials and smart features will further enhance product appeal and create new revenue streams. Emerging markets and the growing focus on workplace efficiency and safety will also contribute significantly to the market's upward trajectory, presenting substantial opportunities for market leaders and new entrants alike.
Plastic Utility Carts Segmentation
-
1. Application
- 1.1. Household
- 1.2. Commercial
- 1.3. Industrial
-
2. Types
- 2.1. 2 Shelf
- 2.2. 3 Shelf
- 2.3. Others
Plastic Utility Carts Segmentation By Geography
-
1. North America
- 1.1. United States
- 1.2. Canada
- 1.3. Mexico
-
2. South America
- 2.1. Brazil
- 2.2. Argentina
- 2.3. Rest of South America
-
3. Europe
- 3.1. United Kingdom
- 3.2. Germany
- 3.3. France
- 3.4. Italy
- 3.5. Spain
- 3.6. Russia
- 3.7. Benelux
- 3.8. Nordics
- 3.9. Rest of Europe
-
4. Middle East & Africa
- 4.1. Turkey
- 4.2. Israel
- 4.3. GCC
- 4.4. North Africa
- 4.5. South Africa
- 4.6. Rest of Middle East & Africa
-
5. Asia Pacific
- 5.1. China
- 5.2. India
- 5.3. Japan
- 5.4. South Korea
- 5.5. ASEAN
- 5.6. Oceania
- 5.7. Rest of Asia Pacific
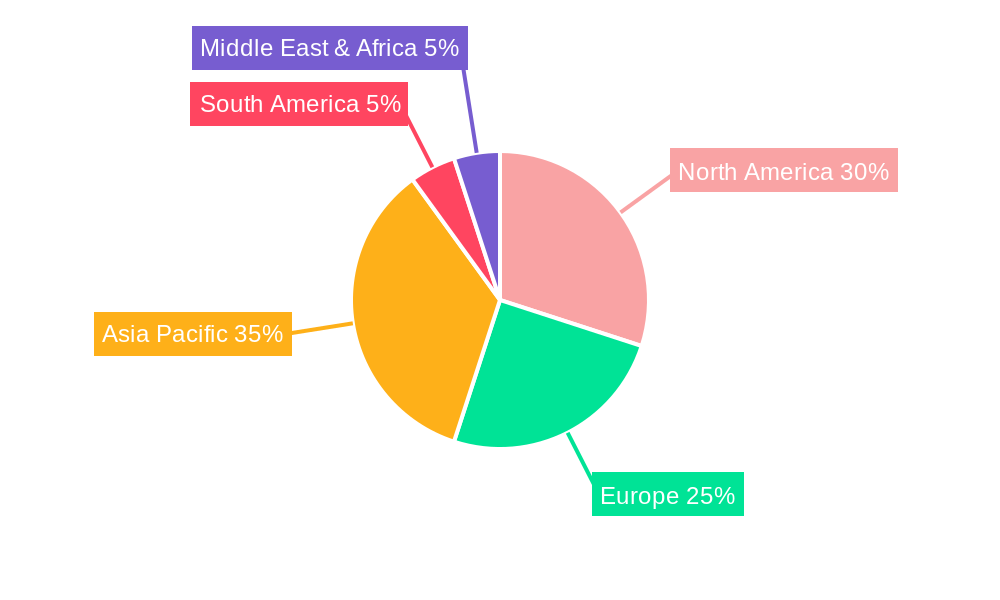
Plastic Utility Carts Regional Market Share
Geographic Coverage of Plastic Utility Carts
Plastic Utility Carts REPORT HIGHLIGHTS
| Aspects | Details |
|---|---|
| Study Period | 2020-2034 |
| Base Year | 2025 |
| Estimated Year | 2026 |
| Forecast Period | 2026-2034 |
| Historical Period | 2020-2025 |
| Growth Rate | CAGR of 4.7% from 2020-2034 |
| Segmentation |
|
Table of Contents
- 1. Introduction
- 1.1. Research Scope
- 1.2. Market Segmentation
- 1.3. Research Methodology
- 1.4. Definitions and Assumptions
- 2. Executive Summary
- 2.1. Introduction
- 3. Market Dynamics
- 3.1. Introduction
- 3.2. Market Drivers
- 3.3. Market Restrains
- 3.4. Market Trends
- 4. Market Factor Analysis
- 4.1. Porters Five Forces
- 4.2. Supply/Value Chain
- 4.3. PESTEL analysis
- 4.4. Market Entropy
- 4.5. Patent/Trademark Analysis
- 5. Global Plastic Utility Carts Analysis, Insights and Forecast, 2020-2032
- 5.1. Market Analysis, Insights and Forecast - by Application
- 5.1.1. Household
- 5.1.2. Commercial
- 5.1.3. Industrial
- 5.2. Market Analysis, Insights and Forecast - by Types
- 5.2.1. 2 Shelf
- 5.2.2. 3 Shelf
- 5.2.3. Others
- 5.3. Market Analysis, Insights and Forecast - by Region
- 5.3.1. North America
- 5.3.2. South America
- 5.3.3. Europe
- 5.3.4. Middle East & Africa
- 5.3.5. Asia Pacific
- 5.1. Market Analysis, Insights and Forecast - by Application
- 6. North America Plastic Utility Carts Analysis, Insights and Forecast, 2020-2032
- 6.1. Market Analysis, Insights and Forecast - by Application
- 6.1.1. Household
- 6.1.2. Commercial
- 6.1.3. Industrial
- 6.2. Market Analysis, Insights and Forecast - by Types
- 6.2.1. 2 Shelf
- 6.2.2. 3 Shelf
- 6.2.3. Others
- 6.1. Market Analysis, Insights and Forecast - by Application
- 7. South America Plastic Utility Carts Analysis, Insights and Forecast, 2020-2032
- 7.1. Market Analysis, Insights and Forecast - by Application
- 7.1.1. Household
- 7.1.2. Commercial
- 7.1.3. Industrial
- 7.2. Market Analysis, Insights and Forecast - by Types
- 7.2.1. 2 Shelf
- 7.2.2. 3 Shelf
- 7.2.3. Others
- 7.1. Market Analysis, Insights and Forecast - by Application
- 8. Europe Plastic Utility Carts Analysis, Insights and Forecast, 2020-2032
- 8.1. Market Analysis, Insights and Forecast - by Application
- 8.1.1. Household
- 8.1.2. Commercial
- 8.1.3. Industrial
- 8.2. Market Analysis, Insights and Forecast - by Types
- 8.2.1. 2 Shelf
- 8.2.2. 3 Shelf
- 8.2.3. Others
- 8.1. Market Analysis, Insights and Forecast - by Application
- 9. Middle East & Africa Plastic Utility Carts Analysis, Insights and Forecast, 2020-2032
- 9.1. Market Analysis, Insights and Forecast - by Application
- 9.1.1. Household
- 9.1.2. Commercial
- 9.1.3. Industrial
- 9.2. Market Analysis, Insights and Forecast - by Types
- 9.2.1. 2 Shelf
- 9.2.2. 3 Shelf
- 9.2.3. Others
- 9.1. Market Analysis, Insights and Forecast - by Application
- 10. Asia Pacific Plastic Utility Carts Analysis, Insights and Forecast, 2020-2032
- 10.1. Market Analysis, Insights and Forecast - by Application
- 10.1.1. Household
- 10.1.2. Commercial
- 10.1.3. Industrial
- 10.2. Market Analysis, Insights and Forecast - by Types
- 10.2.1. 2 Shelf
- 10.2.2. 3 Shelf
- 10.2.3. Others
- 10.1. Market Analysis, Insights and Forecast - by Application
- 11. Competitive Analysis
- 11.1. Global Market Share Analysis 2025
- 11.2. Company Profiles
- 11.2.1 IKEA
- 11.2.1.1. Overview
- 11.2.1.2. Products
- 11.2.1.3. SWOT Analysis
- 11.2.1.4. Recent Developments
- 11.2.1.5. Financials (Based on Availability)
- 11.2.2 JaboEquip
- 11.2.2.1. Overview
- 11.2.2.2. Products
- 11.2.2.3. SWOT Analysis
- 11.2.2.4. Recent Developments
- 11.2.2.5. Financials (Based on Availability)
- 11.2.3 Metro
- 11.2.3.1. Overview
- 11.2.3.2. Products
- 11.2.3.3. SWOT Analysis
- 11.2.3.4. Recent Developments
- 11.2.3.5. Financials (Based on Availability)
- 11.2.4 Essendant
- 11.2.4.1. Overview
- 11.2.4.2. Products
- 11.2.4.3. SWOT Analysis
- 11.2.4.4. Recent Developments
- 11.2.4.5. Financials (Based on Availability)
- 11.2.5 Rubbermaid Commercial Products
- 11.2.5.1. Overview
- 11.2.5.2. Products
- 11.2.5.3. SWOT Analysis
- 11.2.5.4. Recent Developments
- 11.2.5.5. Financials (Based on Availability)
- 11.2.6 Whitmor
- 11.2.6.1. Overview
- 11.2.6.2. Products
- 11.2.6.3. SWOT Analysis
- 11.2.6.4. Recent Developments
- 11.2.6.5. Financials (Based on Availability)
- 11.2.7 Luxor Furniture
- 11.2.7.1. Overview
- 11.2.7.2. Products
- 11.2.7.3. SWOT Analysis
- 11.2.7.4. Recent Developments
- 11.2.7.5. Financials (Based on Availability)
- 11.2.8 Safco Products
- 11.2.8.1. Overview
- 11.2.8.2. Products
- 11.2.8.3. SWOT Analysis
- 11.2.8.4. Recent Developments
- 11.2.8.5. Financials (Based on Availability)
- 11.2.9 Global Industrial
- 11.2.9.1. Overview
- 11.2.9.2. Products
- 11.2.9.3. SWOT Analysis
- 11.2.9.4. Recent Developments
- 11.2.9.5. Financials (Based on Availability)
- 11.2.1 IKEA
List of Figures
- Figure 1: Global Plastic Utility Carts Revenue Breakdown (billion, %) by Region 2025 & 2033
- Figure 2: North America Plastic Utility Carts Revenue (billion), by Application 2025 & 2033
- Figure 3: North America Plastic Utility Carts Revenue Share (%), by Application 2025 & 2033
- Figure 4: North America Plastic Utility Carts Revenue (billion), by Types 2025 & 2033
- Figure 5: North America Plastic Utility Carts Revenue Share (%), by Types 2025 & 2033
- Figure 6: North America Plastic Utility Carts Revenue (billion), by Country 2025 & 2033
- Figure 7: North America Plastic Utility Carts Revenue Share (%), by Country 2025 & 2033
- Figure 8: South America Plastic Utility Carts Revenue (billion), by Application 2025 & 2033
- Figure 9: South America Plastic Utility Carts Revenue Share (%), by Application 2025 & 2033
- Figure 10: South America Plastic Utility Carts Revenue (billion), by Types 2025 & 2033
- Figure 11: South America Plastic Utility Carts Revenue Share (%), by Types 2025 & 2033
- Figure 12: South America Plastic Utility Carts Revenue (billion), by Country 2025 & 2033
- Figure 13: South America Plastic Utility Carts Revenue Share (%), by Country 2025 & 2033
- Figure 14: Europe Plastic Utility Carts Revenue (billion), by Application 2025 & 2033
- Figure 15: Europe Plastic Utility Carts Revenue Share (%), by Application 2025 & 2033
- Figure 16: Europe Plastic Utility Carts Revenue (billion), by Types 2025 & 2033
- Figure 17: Europe Plastic Utility Carts Revenue Share (%), by Types 2025 & 2033
- Figure 18: Europe Plastic Utility Carts Revenue (billion), by Country 2025 & 2033
- Figure 19: Europe Plastic Utility Carts Revenue Share (%), by Country 2025 & 2033
- Figure 20: Middle East & Africa Plastic Utility Carts Revenue (billion), by Application 2025 & 2033
- Figure 21: Middle East & Africa Plastic Utility Carts Revenue Share (%), by Application 2025 & 2033
- Figure 22: Middle East & Africa Plastic Utility Carts Revenue (billion), by Types 2025 & 2033
- Figure 23: Middle East & Africa Plastic Utility Carts Revenue Share (%), by Types 2025 & 2033
- Figure 24: Middle East & Africa Plastic Utility Carts Revenue (billion), by Country 2025 & 2033
- Figure 25: Middle East & Africa Plastic Utility Carts Revenue Share (%), by Country 2025 & 2033
- Figure 26: Asia Pacific Plastic Utility Carts Revenue (billion), by Application 2025 & 2033
- Figure 27: Asia Pacific Plastic Utility Carts Revenue Share (%), by Application 2025 & 2033
- Figure 28: Asia Pacific Plastic Utility Carts Revenue (billion), by Types 2025 & 2033
- Figure 29: Asia Pacific Plastic Utility Carts Revenue Share (%), by Types 2025 & 2033
- Figure 30: Asia Pacific Plastic Utility Carts Revenue (billion), by Country 2025 & 2033
- Figure 31: Asia Pacific Plastic Utility Carts Revenue Share (%), by Country 2025 & 2033
List of Tables
- Table 1: Global Plastic Utility Carts Revenue billion Forecast, by Application 2020 & 2033
- Table 2: Global Plastic Utility Carts Revenue billion Forecast, by Types 2020 & 2033
- Table 3: Global Plastic Utility Carts Revenue billion Forecast, by Region 2020 & 2033
- Table 4: Global Plastic Utility Carts Revenue billion Forecast, by Application 2020 & 2033
- Table 5: Global Plastic Utility Carts Revenue billion Forecast, by Types 2020 & 2033
- Table 6: Global Plastic Utility Carts Revenue billion Forecast, by Country 2020 & 2033
- Table 7: United States Plastic Utility Carts Revenue (billion) Forecast, by Application 2020 & 2033
- Table 8: Canada Plastic Utility Carts Revenue (billion) Forecast, by Application 2020 & 2033
- Table 9: Mexico Plastic Utility Carts Revenue (billion) Forecast, by Application 2020 & 2033
- Table 10: Global Plastic Utility Carts Revenue billion Forecast, by Application 2020 & 2033
- Table 11: Global Plastic Utility Carts Revenue billion Forecast, by Types 2020 & 2033
- Table 12: Global Plastic Utility Carts Revenue billion Forecast, by Country 2020 & 2033
- Table 13: Brazil Plastic Utility Carts Revenue (billion) Forecast, by Application 2020 & 2033
- Table 14: Argentina Plastic Utility Carts Revenue (billion) Forecast, by Application 2020 & 2033
- Table 15: Rest of South America Plastic Utility Carts Revenue (billion) Forecast, by Application 2020 & 2033
- Table 16: Global Plastic Utility Carts Revenue billion Forecast, by Application 2020 & 2033
- Table 17: Global Plastic Utility Carts Revenue billion Forecast, by Types 2020 & 2033
- Table 18: Global Plastic Utility Carts Revenue billion Forecast, by Country 2020 & 2033
- Table 19: United Kingdom Plastic Utility Carts Revenue (billion) Forecast, by Application 2020 & 2033
- Table 20: Germany Plastic Utility Carts Revenue (billion) Forecast, by Application 2020 & 2033
- Table 21: France Plastic Utility Carts Revenue (billion) Forecast, by Application 2020 & 2033
- Table 22: Italy Plastic Utility Carts Revenue (billion) Forecast, by Application 2020 & 2033
- Table 23: Spain Plastic Utility Carts Revenue (billion) Forecast, by Application 2020 & 2033
- Table 24: Russia Plastic Utility Carts Revenue (billion) Forecast, by Application 2020 & 2033
- Table 25: Benelux Plastic Utility Carts Revenue (billion) Forecast, by Application 2020 & 2033
- Table 26: Nordics Plastic Utility Carts Revenue (billion) Forecast, by Application 2020 & 2033
- Table 27: Rest of Europe Plastic Utility Carts Revenue (billion) Forecast, by Application 2020 & 2033
- Table 28: Global Plastic Utility Carts Revenue billion Forecast, by Application 2020 & 2033
- Table 29: Global Plastic Utility Carts Revenue billion Forecast, by Types 2020 & 2033
- Table 30: Global Plastic Utility Carts Revenue billion Forecast, by Country 2020 & 2033
- Table 31: Turkey Plastic Utility Carts Revenue (billion) Forecast, by Application 2020 & 2033
- Table 32: Israel Plastic Utility Carts Revenue (billion) Forecast, by Application 2020 & 2033
- Table 33: GCC Plastic Utility Carts Revenue (billion) Forecast, by Application 2020 & 2033
- Table 34: North Africa Plastic Utility Carts Revenue (billion) Forecast, by Application 2020 & 2033
- Table 35: South Africa Plastic Utility Carts Revenue (billion) Forecast, by Application 2020 & 2033
- Table 36: Rest of Middle East & Africa Plastic Utility Carts Revenue (billion) Forecast, by Application 2020 & 2033
- Table 37: Global Plastic Utility Carts Revenue billion Forecast, by Application 2020 & 2033
- Table 38: Global Plastic Utility Carts Revenue billion Forecast, by Types 2020 & 2033
- Table 39: Global Plastic Utility Carts Revenue billion Forecast, by Country 2020 & 2033
- Table 40: China Plastic Utility Carts Revenue (billion) Forecast, by Application 2020 & 2033
- Table 41: India Plastic Utility Carts Revenue (billion) Forecast, by Application 2020 & 2033
- Table 42: Japan Plastic Utility Carts Revenue (billion) Forecast, by Application 2020 & 2033
- Table 43: South Korea Plastic Utility Carts Revenue (billion) Forecast, by Application 2020 & 2033
- Table 44: ASEAN Plastic Utility Carts Revenue (billion) Forecast, by Application 2020 & 2033
- Table 45: Oceania Plastic Utility Carts Revenue (billion) Forecast, by Application 2020 & 2033
- Table 46: Rest of Asia Pacific Plastic Utility Carts Revenue (billion) Forecast, by Application 2020 & 2033
Frequently Asked Questions
1. What is the projected Compound Annual Growth Rate (CAGR) of the Plastic Utility Carts?
The projected CAGR is approximately 4.7%.
2. Which companies are prominent players in the Plastic Utility Carts?
Key companies in the market include IKEA, JaboEquip, Metro, Essendant, Rubbermaid Commercial Products, Whitmor, Luxor Furniture, Safco Products, Global Industrial.
3. What are the main segments of the Plastic Utility Carts?
The market segments include Application, Types.
4. Can you provide details about the market size?
The market size is estimated to be USD 0.51 billion as of 2022.
5. What are some drivers contributing to market growth?
N/A
6. What are the notable trends driving market growth?
N/A
7. Are there any restraints impacting market growth?
N/A
8. Can you provide examples of recent developments in the market?
N/A
9. What pricing options are available for accessing the report?
Pricing options include single-user, multi-user, and enterprise licenses priced at USD 4900.00, USD 7350.00, and USD 9800.00 respectively.
10. Is the market size provided in terms of value or volume?
The market size is provided in terms of value, measured in billion.
11. Are there any specific market keywords associated with the report?
Yes, the market keyword associated with the report is "Plastic Utility Carts," which aids in identifying and referencing the specific market segment covered.
12. How do I determine which pricing option suits my needs best?
The pricing options vary based on user requirements and access needs. Individual users may opt for single-user licenses, while businesses requiring broader access may choose multi-user or enterprise licenses for cost-effective access to the report.
13. Are there any additional resources or data provided in the Plastic Utility Carts report?
While the report offers comprehensive insights, it's advisable to review the specific contents or supplementary materials provided to ascertain if additional resources or data are available.
14. How can I stay updated on further developments or reports in the Plastic Utility Carts?
To stay informed about further developments, trends, and reports in the Plastic Utility Carts, consider subscribing to industry newsletters, following relevant companies and organizations, or regularly checking reputable industry news sources and publications.
Methodology
Step 1 - Identification of Relevant Samples Size from Population Database


Step 2 - Approaches for Defining Global Market Size (Value, Volume* & Price*)

Note*: In applicable scenarios
Step 3 - Data Sources
Primary Research
- Web Analytics
- Survey Reports
- Research Institute
- Latest Research Reports
- Opinion Leaders
Secondary Research
- Annual Reports
- White Paper
- Latest Press Release
- Industry Association
- Paid Database
- Investor Presentations

Step 4 - Data Triangulation
Involves using different sources of information in order to increase the validity of a study
These sources are likely to be stakeholders in a program - participants, other researchers, program staff, other community members, and so on.
Then we put all data in single framework & apply various statistical tools to find out the dynamic on the market.
During the analysis stage, feedback from the stakeholder groups would be compared to determine areas of agreement as well as areas of divergence