

Key Insights
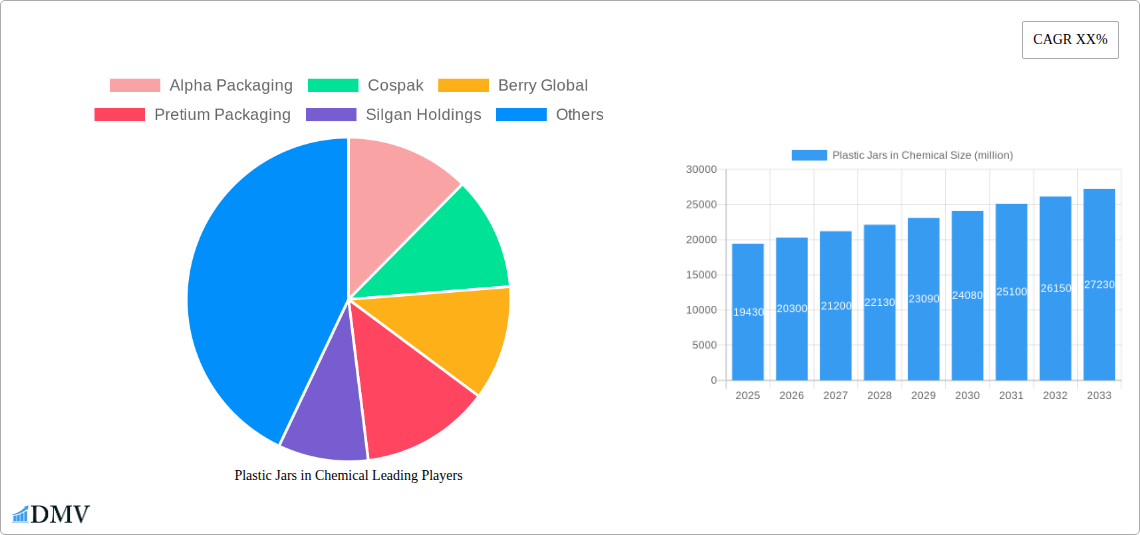
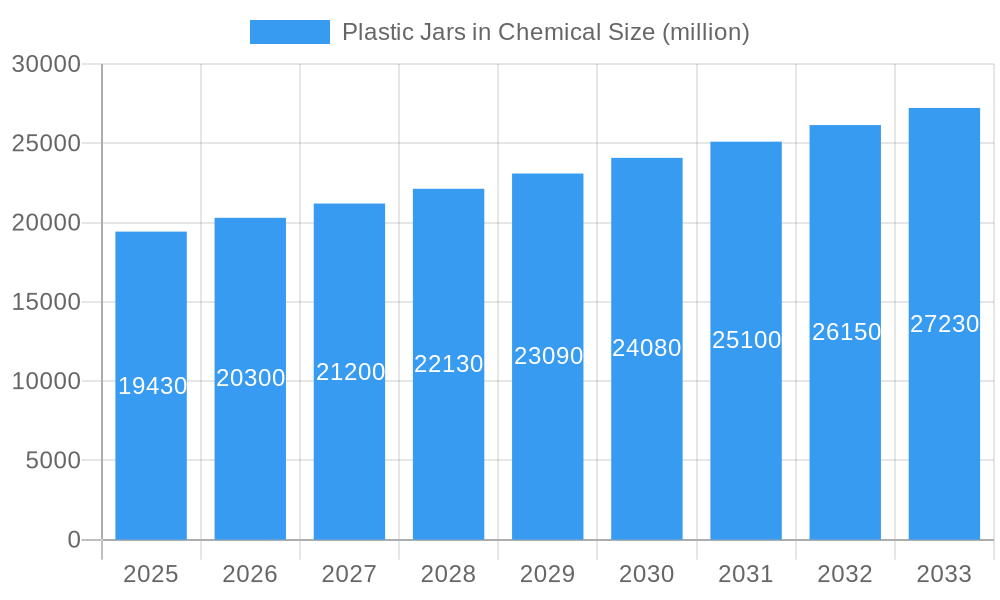
The global plastic jars market for chemical applications is poised for robust growth, with an estimated market size of $19.43 billion in 2025. This expansion is driven by the increasing demand for safe, durable, and cost-effective packaging solutions across various chemical sectors. The market is projected to expand at a Compound Annual Growth Rate (CAGR) of 4.45%, indicating a steady upward trajectory throughout the forecast period of 2025-2033. Key applications driving this demand include industrial chemicals, where the need for secure containment of hazardous and non-hazardous substances is paramount, and agricultural chemicals, which rely on resilient packaging for fertilizers, pesticides, and herbicides. The versatility of plastic materials like PET, PE, PVC, and PP allows for tailored solutions that meet specific chemical resistance and barrier property requirements. Leading companies such as Alpha Packaging, Berry Global, and Silgan Holdings are at the forefront, innovating with advanced materials and sustainable packaging options to capture market share.
Plastic Jars in Chemical Market Size (In Billion)
Further analysis reveals that the market's growth will be propelled by a convergence of factors. The expanding manufacturing base globally, particularly in the Asia Pacific region, necessitates a greater volume of chemical products and, consequently, their packaging. Furthermore, the inherent advantages of plastic jars – lightweight, shatter-resistant, and customizable – make them a preferred choice over traditional glass or metal containers in many chemical industry segments. Emerging trends such as the development of specialized barrier coatings to enhance chemical compatibility and the increasing focus on recycled and recyclable plastic materials for enhanced sustainability are expected to shape the market landscape. While cost-effective production and a wide array of types of jars available, including PET and PE variants, are significant drivers, potential challenges such as fluctuating raw material prices and stringent regulatory compliance in certain regions could present some restraints, though these are expected to be largely overcome by the market's inherent dynamism and ongoing innovation.
Plastic Jars in Chemical Company Market Share
Plastic Jars in Chemical Market: Comprehensive Analysis and Forecast (2019-2033)
This in-depth report provides a definitive analysis of the global Plastic Jars in Chemical market, offering critical insights for stakeholders seeking to capitalize on evolving industry dynamics. Spanning a comprehensive study period from 2019 to 2033, with a base year of 2025, this report leverages historical data (2019-2024) and a robust forecast period (2025-2033) to deliver actionable intelligence. We delve into market composition, industry evolution, regional dominance, product innovation, growth drivers, challenges, future opportunities, and the competitive landscape, providing a 360-degree view of this vital sector.
Plastic Jars in Chemical Market Composition & Trends
The Plastic Jars in Chemical market exhibits a moderately concentrated landscape, with key players like Alpha Packaging, Cospak, Berry Global, Pretium Packaging, Silgan Holdings, and SKS Bottle and Packaging strategically positioned. Innovation is driven by the demand for enhanced chemical resistance, improved barrier properties, and sustainable packaging solutions. The regulatory environment, encompassing stringent safety standards and evolving environmental mandates, significantly influences product development and material choices. Substitute products, such as glass and metal containers, present a persistent, albeit diminishing, competitive threat, primarily countered by the superior cost-effectiveness and versatility of plastic jars. End-user profiles span a broad spectrum, with Industrial Chemicals and Agricultural Chemicals representing the dominant applications. M&A activities, with an estimated total deal value of over XXX billion during the historical period, are expected to continue as companies seek to expand their market reach, technological capabilities, and product portfolios.
- Market Share Distribution: Dominant players hold a combined market share exceeding 60 billion, with strategic acquisitions playing a pivotal role in consolidating market presence.
- M&A Deal Values: An estimated XXX billion in M&A transactions occurred between 2019 and 2024, indicating a strong trend towards consolidation and strategic partnerships.
- Innovation Catalysts: Focus on lightweighting, recyclability, and advanced barrier technologies drives R&D investments, estimated at over XXX billion annually.
- Regulatory Landscape: Compliance with evolving chemical containment and environmental regulations is paramount, influencing material selection and design, with an estimated XXX billion in compliance investments.
Plastic Jars in Chemical Industry Evolution
The Plastic Jars in Chemical industry has undergone a significant evolution, characterized by consistent market growth trajectories, fueled by the ever-increasing demand for effective and safe containment solutions across various chemical sectors. From 2019 to 2024, the market experienced a compound annual growth rate (CAGR) of approximately 5.XX%, a trend projected to continue with a CAGR of 6.XX% during the forecast period. Technological advancements have been instrumental in this expansion, with the introduction of high-performance polymers and sophisticated manufacturing techniques enabling the production of jars with superior chemical resistance, durability, and tamper-evident features. These advancements are crucial for safeguarding sensitive chemicals, preventing leakage, and ensuring product integrity during storage and transportation. Shifting consumer and industrial demands have also played a pivotal role. There's a growing emphasis on lightweight, cost-effective, and environmentally responsible packaging. This has propelled the adoption of materials like PET and PP, known for their recyclability and lower carbon footprint compared to traditional alternatives. Furthermore, the rise of e-commerce for chemical products necessitates robust packaging solutions that can withstand the rigors of shipping, further stimulating innovation and market expansion. The development of specialized plastic jars tailored for specific chemical formulations, such as aggressive acids or volatile solvents, has broadened the market's applicability and solidified its importance within the chemical supply chain. The estimated market size for plastic jars in chemical applications is projected to reach over XXX billion by 2033, a testament to the industry's resilience and adaptive capacity.
- Market Growth Trajectories: Historical CAGR (2019-2024) of 5.XX% and projected CAGR (2025-2033) of 6.XX%, indicating sustained market expansion.
- Technological Advancements: Increased adoption of blow molding and injection molding technologies, leading to enhanced product precision and efficiency, with an estimated XXX billion in technology investments.
- Shifting Consumer Demands: Growing preference for sustainable and recyclable packaging solutions, driving innovation in eco-friendly materials and manufacturing processes, with an estimated XXX billion in sustainable material R&D.
- Adoption Metrics: Over XX% of chemical manufacturers are now utilizing plastic jars for their product lines, up from XX% in 2019.
Leading Regions, Countries, or Segments in Plastic Jars in Chemical
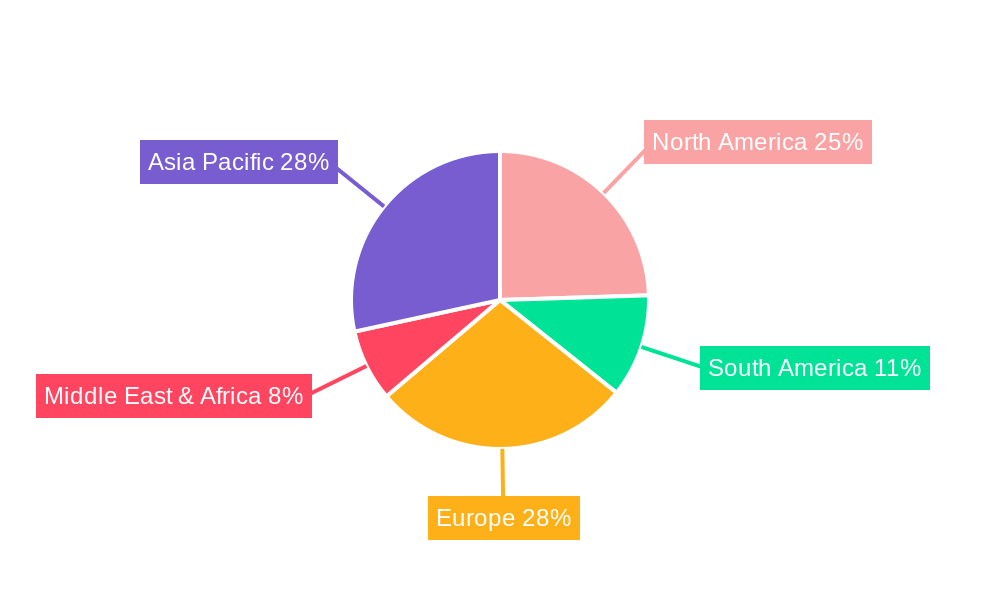
North America and Asia-Pacific are poised to lead the Plastic Jars in Chemical market, driven by robust industrial activity and a burgeoning agricultural sector. Within these regions, the Industrial Chemicals segment represents the largest application, accounting for an estimated 60% of the market share. This dominance is attributed to the vast array of industrial processes requiring reliable and cost-effective containment for solvents, reagents, lubricants, and cleaning agents. The consistent demand from manufacturing, automotive, and electronics industries underpins this segment's strength.
The Types segment is characterized by the significant prevalence of PET Jars and PE Jars, together holding an estimated 75% market share. PET jars offer excellent clarity, barrier properties, and chemical resistance, making them ideal for a wide range of industrial and agricultural chemicals. PE jars, particularly HDPE, are favored for their durability, impact resistance, and cost-effectiveness, making them suitable for bulk chemicals and agricultural formulations. Regulatory support for plastic recycling initiatives and the increasing adoption of sustainable packaging solutions are key drivers in these leading segments. Investment trends in advanced manufacturing capabilities and a growing awareness of the environmental impact of packaging are further bolstering the adoption of PET and PE jars.
- Dominant Region: North America, with an estimated market share exceeding XXX billion, driven by advanced industrial infrastructure and strong demand for specialty chemicals.
- Leading Application: Industrial Chemicals, accounting for approximately 60% of the market revenue, fueled by diverse manufacturing and processing needs.
- Key Material Type: PET Jars and PE Jars collectively represent over 75% of the market share due to their versatile properties and cost-effectiveness.
- Investment Trends: Significant investments, estimated at over XXX billion, are being directed towards advanced manufacturing facilities and R&D for enhanced polymer technologies in these leading regions.
- Regulatory Support: Government initiatives promoting recycling and sustainable packaging are creating a favorable environment for plastic jar manufacturers, with estimated XXX billion in supportive programs.
Plastic Jars in Chemical Product Innovations
Product innovations in the Plastic Jars in Chemical market are primarily focused on enhancing chemical compatibility, improving barrier properties against moisture and oxygen, and integrating smart features for traceability and tamper evidence. The development of multi-layer co-extruded jars and the use of advanced barrier coatings are crucial for extending the shelf-life of sensitive chemicals. Furthermore, the integration of child-resistant closures and ergonomic designs enhances user safety and convenience. Lightweighting initiatives are also a key focus, reducing transportation costs and environmental impact without compromising structural integrity. The estimated annual investment in product innovation within this sector is over XXX billion.
Propelling Factors for Plastic Jars in Chemical Growth
The growth of the Plastic Jars in Chemical market is propelled by several key factors. The increasing global demand for chemicals across diverse industries, from agriculture to manufacturing, directly translates to a higher need for reliable packaging solutions. Technological advancements in polymer science and manufacturing processes have enabled the creation of more durable, chemically resistant, and cost-effective plastic jars. Furthermore, the growing emphasis on sustainability and recyclability is driving innovation in eco-friendly plastic materials and closed-loop systems. Regulatory frameworks that promote safe chemical storage and transportation also indirectly support the market's expansion. The estimated market growth is projected to be over XXX billion by 2033.
- Increasing Chemical Demand: Sustained global demand across industrial and agricultural sectors.
- Technological Advancements: Innovation in polymer formulations and manufacturing efficiency.
- Sustainability Focus: Growing adoption of recyclable and bio-based plastics.
- Cost-Effectiveness: Competitive pricing compared to traditional packaging materials.
Obstacles in the Plastic Jars in Chemical Market
Despite the promising growth, the Plastic Jars in Chemical market faces certain obstacles. Stringent regulatory compliance regarding chemical handling and disposal can be complex and costly for manufacturers. Fluctuations in raw material prices, particularly for petroleum-based plastics, can impact production costs and profit margins. Concerns surrounding plastic waste and its environmental impact continue to fuel the demand for alternative materials, necessitating ongoing innovation in recyclability and biodegradable options. Supply chain disruptions, as witnessed in recent global events, can also affect production and delivery timelines. The estimated impact of these obstacles on market growth is a reduction of approximately XX% in the short term.
- Regulatory Hurdles: Evolving and stringent compliance requirements for chemical containment.
- Raw Material Volatility: Price fluctuations in virgin plastic resins impacting manufacturing costs.
- Environmental Concerns: Public perception and increasing demand for sustainable alternatives.
- Supply Chain Vulnerabilities: Potential disruptions affecting raw material availability and finished goods delivery.
Future Opportunities in Plastic Jars in Chemical
The Plastic Jars in Chemical market is ripe with future opportunities. The increasing demand for specialty chemicals in emerging economies presents significant expansion potential. Innovations in smart packaging, including integrated sensors for monitoring chemical integrity and QR codes for supply chain traceability, offer a competitive edge. The development and wider adoption of advanced biodegradable and compostable plastic materials will address environmental concerns and open new market segments. Furthermore, the growing trend towards customized packaging solutions tailored to specific chemical formulations will create niche market opportunities. The estimated market potential from these opportunities is over XXX billion by 2033.
- Emerging Markets: Expansion into developing economies with growing chemical industries.
- Smart Packaging Solutions: Integration of IoT and traceability features.
- Sustainable Materials: Growth in demand for biodegradable and bio-based plastics.
- Customization: Development of bespoke packaging for specialized chemical applications.
Major Players in the Plastic Jars in Chemical Ecosystem
- Alpha Packaging
- Cospak
- Berry Global
- Pretium Packaging
- Silgan Holdings
- SKS Bottle and Packaging
Key Developments in Plastic Jars in Chemical Industry
- 2023 October: Berry Global launches a new range of high-barrier PET jars with enhanced chemical resistance, catering to the pharmaceutical and fine chemical sectors.
- 2024 January: Silgan Holdings announces a significant investment in R&D for advanced recycling technologies for its plastic packaging portfolio, aiming for a XX% increase in recycled content by 2028.
- 2024 March: Pretium Packaging acquires a specialized manufacturer of rigid plastic containers, expanding its capabilities in the industrial chemical packaging segment.
- 2024 June: SKS Bottle and Packaging introduces a new line of eco-friendly plastic jars made from post-consumer recycled (PCR) materials, offering a sustainable alternative for various chemical applications.
- 2025 Q1: Alpha Packaging develops innovative tamper-evident closures for plastic jars, enhancing product security and user safety for sensitive chemical products.
Strategic Plastic Jars in Chemical Market Forecast
The strategic forecast for the Plastic Jars in Chemical market is overwhelmingly positive, driven by robust demand from industrial and agricultural sectors, coupled with continuous technological innovation. The market's ability to adapt to sustainability trends by developing and adopting recycled and bio-based materials will be a critical growth catalyst. Furthermore, strategic investments in advanced manufacturing and supply chain optimization will ensure competitive pricing and reliable delivery. Emerging markets and the demand for specialized, high-performance packaging solutions will unlock significant future revenue streams, positioning the Plastic Jars in Chemical market for sustained growth and expansion, projected to reach over XXX billion by the end of the forecast period.
Plastic Jars in Chemical Segmentation
-
1. Application
- 1.1. Industrial Chemicals
- 1.2. Agricultural Chemicals
- 1.3. Others
-
2. Types
- 2.1. PET Jars
- 2.2. PE Jars
- 2.3. PVC Jars
- 2.4. PP Jars
- 2.5. PS Jars
- 2.6. Others
Plastic Jars in Chemical Segmentation By Geography
-
1. North America
- 1.1. United States
- 1.2. Canada
- 1.3. Mexico
-
2. South America
- 2.1. Brazil
- 2.2. Argentina
- 2.3. Rest of South America
-
3. Europe
- 3.1. United Kingdom
- 3.2. Germany
- 3.3. France
- 3.4. Italy
- 3.5. Spain
- 3.6. Russia
- 3.7. Benelux
- 3.8. Nordics
- 3.9. Rest of Europe
-
4. Middle East & Africa
- 4.1. Turkey
- 4.2. Israel
- 4.3. GCC
- 4.4. North Africa
- 4.5. South Africa
- 4.6. Rest of Middle East & Africa
-
5. Asia Pacific
- 5.1. China
- 5.2. India
- 5.3. Japan
- 5.4. South Korea
- 5.5. ASEAN
- 5.6. Oceania
- 5.7. Rest of Asia Pacific
Plastic Jars in Chemical Regional Market Share
Geographic Coverage of Plastic Jars in Chemical
Plastic Jars in Chemical REPORT HIGHLIGHTS
| Aspects | Details |
|---|---|
| Study Period | 2020-2034 |
| Base Year | 2025 |
| Estimated Year | 2026 |
| Forecast Period | 2026-2034 |
| Historical Period | 2020-2025 |
| Growth Rate | CAGR of 4.45% from 2020-2034 |
| Segmentation |
|
Table of Contents
- 1. Introduction
- 1.1. Research Scope
- 1.2. Market Segmentation
- 1.3. Research Methodology
- 1.4. Definitions and Assumptions
- 2. Executive Summary
- 2.1. Introduction
- 3. Market Dynamics
- 3.1. Introduction
- 3.2. Market Drivers
- 3.3. Market Restrains
- 3.4. Market Trends
- 4. Market Factor Analysis
- 4.1. Porters Five Forces
- 4.2. Supply/Value Chain
- 4.3. PESTEL analysis
- 4.4. Market Entropy
- 4.5. Patent/Trademark Analysis
- 5. Global Plastic Jars in Chemical Analysis, Insights and Forecast, 2020-2032
- 5.1. Market Analysis, Insights and Forecast - by Application
- 5.1.1. Industrial Chemicals
- 5.1.2. Agricultural Chemicals
- 5.1.3. Others
- 5.2. Market Analysis, Insights and Forecast - by Types
- 5.2.1. PET Jars
- 5.2.2. PE Jars
- 5.2.3. PVC Jars
- 5.2.4. PP Jars
- 5.2.5. PS Jars
- 5.2.6. Others
- 5.3. Market Analysis, Insights and Forecast - by Region
- 5.3.1. North America
- 5.3.2. South America
- 5.3.3. Europe
- 5.3.4. Middle East & Africa
- 5.3.5. Asia Pacific
- 5.1. Market Analysis, Insights and Forecast - by Application
- 6. North America Plastic Jars in Chemical Analysis, Insights and Forecast, 2020-2032
- 6.1. Market Analysis, Insights and Forecast - by Application
- 6.1.1. Industrial Chemicals
- 6.1.2. Agricultural Chemicals
- 6.1.3. Others
- 6.2. Market Analysis, Insights and Forecast - by Types
- 6.2.1. PET Jars
- 6.2.2. PE Jars
- 6.2.3. PVC Jars
- 6.2.4. PP Jars
- 6.2.5. PS Jars
- 6.2.6. Others
- 6.1. Market Analysis, Insights and Forecast - by Application
- 7. South America Plastic Jars in Chemical Analysis, Insights and Forecast, 2020-2032
- 7.1. Market Analysis, Insights and Forecast - by Application
- 7.1.1. Industrial Chemicals
- 7.1.2. Agricultural Chemicals
- 7.1.3. Others
- 7.2. Market Analysis, Insights and Forecast - by Types
- 7.2.1. PET Jars
- 7.2.2. PE Jars
- 7.2.3. PVC Jars
- 7.2.4. PP Jars
- 7.2.5. PS Jars
- 7.2.6. Others
- 7.1. Market Analysis, Insights and Forecast - by Application
- 8. Europe Plastic Jars in Chemical Analysis, Insights and Forecast, 2020-2032
- 8.1. Market Analysis, Insights and Forecast - by Application
- 8.1.1. Industrial Chemicals
- 8.1.2. Agricultural Chemicals
- 8.1.3. Others
- 8.2. Market Analysis, Insights and Forecast - by Types
- 8.2.1. PET Jars
- 8.2.2. PE Jars
- 8.2.3. PVC Jars
- 8.2.4. PP Jars
- 8.2.5. PS Jars
- 8.2.6. Others
- 8.1. Market Analysis, Insights and Forecast - by Application
- 9. Middle East & Africa Plastic Jars in Chemical Analysis, Insights and Forecast, 2020-2032
- 9.1. Market Analysis, Insights and Forecast - by Application
- 9.1.1. Industrial Chemicals
- 9.1.2. Agricultural Chemicals
- 9.1.3. Others
- 9.2. Market Analysis, Insights and Forecast - by Types
- 9.2.1. PET Jars
- 9.2.2. PE Jars
- 9.2.3. PVC Jars
- 9.2.4. PP Jars
- 9.2.5. PS Jars
- 9.2.6. Others
- 9.1. Market Analysis, Insights and Forecast - by Application
- 10. Asia Pacific Plastic Jars in Chemical Analysis, Insights and Forecast, 2020-2032
- 10.1. Market Analysis, Insights and Forecast - by Application
- 10.1.1. Industrial Chemicals
- 10.1.2. Agricultural Chemicals
- 10.1.3. Others
- 10.2. Market Analysis, Insights and Forecast - by Types
- 10.2.1. PET Jars
- 10.2.2. PE Jars
- 10.2.3. PVC Jars
- 10.2.4. PP Jars
- 10.2.5. PS Jars
- 10.2.6. Others
- 10.1. Market Analysis, Insights and Forecast - by Application
- 11. Competitive Analysis
- 11.1. Global Market Share Analysis 2025
- 11.2. Company Profiles
- 11.2.1 Alpha Packaging
- 11.2.1.1. Overview
- 11.2.1.2. Products
- 11.2.1.3. SWOT Analysis
- 11.2.1.4. Recent Developments
- 11.2.1.5. Financials (Based on Availability)
- 11.2.2 Cospak
- 11.2.2.1. Overview
- 11.2.2.2. Products
- 11.2.2.3. SWOT Analysis
- 11.2.2.4. Recent Developments
- 11.2.2.5. Financials (Based on Availability)
- 11.2.3 Berry Global
- 11.2.3.1. Overview
- 11.2.3.2. Products
- 11.2.3.3. SWOT Analysis
- 11.2.3.4. Recent Developments
- 11.2.3.5. Financials (Based on Availability)
- 11.2.4 Pretium Packaging
- 11.2.4.1. Overview
- 11.2.4.2. Products
- 11.2.4.3. SWOT Analysis
- 11.2.4.4. Recent Developments
- 11.2.4.5. Financials (Based on Availability)
- 11.2.5 Silgan Holdings
- 11.2.5.1. Overview
- 11.2.5.2. Products
- 11.2.5.3. SWOT Analysis
- 11.2.5.4. Recent Developments
- 11.2.5.5. Financials (Based on Availability)
- 11.2.6 SKS Bottle and Packaging
- 11.2.6.1. Overview
- 11.2.6.2. Products
- 11.2.6.3. SWOT Analysis
- 11.2.6.4. Recent Developments
- 11.2.6.5. Financials (Based on Availability)
- 11.2.1 Alpha Packaging
List of Figures
- Figure 1: Global Plastic Jars in Chemical Revenue Breakdown (undefined, %) by Region 2025 & 2033
- Figure 2: North America Plastic Jars in Chemical Revenue (undefined), by Application 2025 & 2033
- Figure 3: North America Plastic Jars in Chemical Revenue Share (%), by Application 2025 & 2033
- Figure 4: North America Plastic Jars in Chemical Revenue (undefined), by Types 2025 & 2033
- Figure 5: North America Plastic Jars in Chemical Revenue Share (%), by Types 2025 & 2033
- Figure 6: North America Plastic Jars in Chemical Revenue (undefined), by Country 2025 & 2033
- Figure 7: North America Plastic Jars in Chemical Revenue Share (%), by Country 2025 & 2033
- Figure 8: South America Plastic Jars in Chemical Revenue (undefined), by Application 2025 & 2033
- Figure 9: South America Plastic Jars in Chemical Revenue Share (%), by Application 2025 & 2033
- Figure 10: South America Plastic Jars in Chemical Revenue (undefined), by Types 2025 & 2033
- Figure 11: South America Plastic Jars in Chemical Revenue Share (%), by Types 2025 & 2033
- Figure 12: South America Plastic Jars in Chemical Revenue (undefined), by Country 2025 & 2033
- Figure 13: South America Plastic Jars in Chemical Revenue Share (%), by Country 2025 & 2033
- Figure 14: Europe Plastic Jars in Chemical Revenue (undefined), by Application 2025 & 2033
- Figure 15: Europe Plastic Jars in Chemical Revenue Share (%), by Application 2025 & 2033
- Figure 16: Europe Plastic Jars in Chemical Revenue (undefined), by Types 2025 & 2033
- Figure 17: Europe Plastic Jars in Chemical Revenue Share (%), by Types 2025 & 2033
- Figure 18: Europe Plastic Jars in Chemical Revenue (undefined), by Country 2025 & 2033
- Figure 19: Europe Plastic Jars in Chemical Revenue Share (%), by Country 2025 & 2033
- Figure 20: Middle East & Africa Plastic Jars in Chemical Revenue (undefined), by Application 2025 & 2033
- Figure 21: Middle East & Africa Plastic Jars in Chemical Revenue Share (%), by Application 2025 & 2033
- Figure 22: Middle East & Africa Plastic Jars in Chemical Revenue (undefined), by Types 2025 & 2033
- Figure 23: Middle East & Africa Plastic Jars in Chemical Revenue Share (%), by Types 2025 & 2033
- Figure 24: Middle East & Africa Plastic Jars in Chemical Revenue (undefined), by Country 2025 & 2033
- Figure 25: Middle East & Africa Plastic Jars in Chemical Revenue Share (%), by Country 2025 & 2033
- Figure 26: Asia Pacific Plastic Jars in Chemical Revenue (undefined), by Application 2025 & 2033
- Figure 27: Asia Pacific Plastic Jars in Chemical Revenue Share (%), by Application 2025 & 2033
- Figure 28: Asia Pacific Plastic Jars in Chemical Revenue (undefined), by Types 2025 & 2033
- Figure 29: Asia Pacific Plastic Jars in Chemical Revenue Share (%), by Types 2025 & 2033
- Figure 30: Asia Pacific Plastic Jars in Chemical Revenue (undefined), by Country 2025 & 2033
- Figure 31: Asia Pacific Plastic Jars in Chemical Revenue Share (%), by Country 2025 & 2033
List of Tables
- Table 1: Global Plastic Jars in Chemical Revenue undefined Forecast, by Application 2020 & 2033
- Table 2: Global Plastic Jars in Chemical Revenue undefined Forecast, by Types 2020 & 2033
- Table 3: Global Plastic Jars in Chemical Revenue undefined Forecast, by Region 2020 & 2033
- Table 4: Global Plastic Jars in Chemical Revenue undefined Forecast, by Application 2020 & 2033
- Table 5: Global Plastic Jars in Chemical Revenue undefined Forecast, by Types 2020 & 2033
- Table 6: Global Plastic Jars in Chemical Revenue undefined Forecast, by Country 2020 & 2033
- Table 7: United States Plastic Jars in Chemical Revenue (undefined) Forecast, by Application 2020 & 2033
- Table 8: Canada Plastic Jars in Chemical Revenue (undefined) Forecast, by Application 2020 & 2033
- Table 9: Mexico Plastic Jars in Chemical Revenue (undefined) Forecast, by Application 2020 & 2033
- Table 10: Global Plastic Jars in Chemical Revenue undefined Forecast, by Application 2020 & 2033
- Table 11: Global Plastic Jars in Chemical Revenue undefined Forecast, by Types 2020 & 2033
- Table 12: Global Plastic Jars in Chemical Revenue undefined Forecast, by Country 2020 & 2033
- Table 13: Brazil Plastic Jars in Chemical Revenue (undefined) Forecast, by Application 2020 & 2033
- Table 14: Argentina Plastic Jars in Chemical Revenue (undefined) Forecast, by Application 2020 & 2033
- Table 15: Rest of South America Plastic Jars in Chemical Revenue (undefined) Forecast, by Application 2020 & 2033
- Table 16: Global Plastic Jars in Chemical Revenue undefined Forecast, by Application 2020 & 2033
- Table 17: Global Plastic Jars in Chemical Revenue undefined Forecast, by Types 2020 & 2033
- Table 18: Global Plastic Jars in Chemical Revenue undefined Forecast, by Country 2020 & 2033
- Table 19: United Kingdom Plastic Jars in Chemical Revenue (undefined) Forecast, by Application 2020 & 2033
- Table 20: Germany Plastic Jars in Chemical Revenue (undefined) Forecast, by Application 2020 & 2033
- Table 21: France Plastic Jars in Chemical Revenue (undefined) Forecast, by Application 2020 & 2033
- Table 22: Italy Plastic Jars in Chemical Revenue (undefined) Forecast, by Application 2020 & 2033
- Table 23: Spain Plastic Jars in Chemical Revenue (undefined) Forecast, by Application 2020 & 2033
- Table 24: Russia Plastic Jars in Chemical Revenue (undefined) Forecast, by Application 2020 & 2033
- Table 25: Benelux Plastic Jars in Chemical Revenue (undefined) Forecast, by Application 2020 & 2033
- Table 26: Nordics Plastic Jars in Chemical Revenue (undefined) Forecast, by Application 2020 & 2033
- Table 27: Rest of Europe Plastic Jars in Chemical Revenue (undefined) Forecast, by Application 2020 & 2033
- Table 28: Global Plastic Jars in Chemical Revenue undefined Forecast, by Application 2020 & 2033
- Table 29: Global Plastic Jars in Chemical Revenue undefined Forecast, by Types 2020 & 2033
- Table 30: Global Plastic Jars in Chemical Revenue undefined Forecast, by Country 2020 & 2033
- Table 31: Turkey Plastic Jars in Chemical Revenue (undefined) Forecast, by Application 2020 & 2033
- Table 32: Israel Plastic Jars in Chemical Revenue (undefined) Forecast, by Application 2020 & 2033
- Table 33: GCC Plastic Jars in Chemical Revenue (undefined) Forecast, by Application 2020 & 2033
- Table 34: North Africa Plastic Jars in Chemical Revenue (undefined) Forecast, by Application 2020 & 2033
- Table 35: South Africa Plastic Jars in Chemical Revenue (undefined) Forecast, by Application 2020 & 2033
- Table 36: Rest of Middle East & Africa Plastic Jars in Chemical Revenue (undefined) Forecast, by Application 2020 & 2033
- Table 37: Global Plastic Jars in Chemical Revenue undefined Forecast, by Application 2020 & 2033
- Table 38: Global Plastic Jars in Chemical Revenue undefined Forecast, by Types 2020 & 2033
- Table 39: Global Plastic Jars in Chemical Revenue undefined Forecast, by Country 2020 & 2033
- Table 40: China Plastic Jars in Chemical Revenue (undefined) Forecast, by Application 2020 & 2033
- Table 41: India Plastic Jars in Chemical Revenue (undefined) Forecast, by Application 2020 & 2033
- Table 42: Japan Plastic Jars in Chemical Revenue (undefined) Forecast, by Application 2020 & 2033
- Table 43: South Korea Plastic Jars in Chemical Revenue (undefined) Forecast, by Application 2020 & 2033
- Table 44: ASEAN Plastic Jars in Chemical Revenue (undefined) Forecast, by Application 2020 & 2033
- Table 45: Oceania Plastic Jars in Chemical Revenue (undefined) Forecast, by Application 2020 & 2033
- Table 46: Rest of Asia Pacific Plastic Jars in Chemical Revenue (undefined) Forecast, by Application 2020 & 2033
Frequently Asked Questions
1. What is the projected Compound Annual Growth Rate (CAGR) of the Plastic Jars in Chemical?
The projected CAGR is approximately 4.45%.
2. Which companies are prominent players in the Plastic Jars in Chemical?
Key companies in the market include Alpha Packaging, Cospak, Berry Global, Pretium Packaging, Silgan Holdings, SKS Bottle and Packaging.
3. What are the main segments of the Plastic Jars in Chemical?
The market segments include Application, Types.
4. Can you provide details about the market size?
The market size is estimated to be USD XXX N/A as of 2022.
5. What are some drivers contributing to market growth?
N/A
6. What are the notable trends driving market growth?
N/A
7. Are there any restraints impacting market growth?
N/A
8. Can you provide examples of recent developments in the market?
N/A
9. What pricing options are available for accessing the report?
Pricing options include single-user, multi-user, and enterprise licenses priced at USD 4900.00, USD 7350.00, and USD 9800.00 respectively.
10. Is the market size provided in terms of value or volume?
The market size is provided in terms of value, measured in N/A.
11. Are there any specific market keywords associated with the report?
Yes, the market keyword associated with the report is "Plastic Jars in Chemical," which aids in identifying and referencing the specific market segment covered.
12. How do I determine which pricing option suits my needs best?
The pricing options vary based on user requirements and access needs. Individual users may opt for single-user licenses, while businesses requiring broader access may choose multi-user or enterprise licenses for cost-effective access to the report.
13. Are there any additional resources or data provided in the Plastic Jars in Chemical report?
While the report offers comprehensive insights, it's advisable to review the specific contents or supplementary materials provided to ascertain if additional resources or data are available.
14. How can I stay updated on further developments or reports in the Plastic Jars in Chemical?
To stay informed about further developments, trends, and reports in the Plastic Jars in Chemical, consider subscribing to industry newsletters, following relevant companies and organizations, or regularly checking reputable industry news sources and publications.
Methodology
Step 1 - Identification of Relevant Samples Size from Population Database


Step 2 - Approaches for Defining Global Market Size (Value, Volume* & Price*)

Note*: In applicable scenarios
Step 3 - Data Sources
Primary Research
- Web Analytics
- Survey Reports
- Research Institute
- Latest Research Reports
- Opinion Leaders
Secondary Research
- Annual Reports
- White Paper
- Latest Press Release
- Industry Association
- Paid Database
- Investor Presentations

Step 4 - Data Triangulation
Involves using different sources of information in order to increase the validity of a study
These sources are likely to be stakeholders in a program - participants, other researchers, program staff, other community members, and so on.
Then we put all data in single framework & apply various statistical tools to find out the dynamic on the market.
During the analysis stage, feedback from the stakeholder groups would be compared to determine areas of agreement as well as areas of divergence