

Key Insights
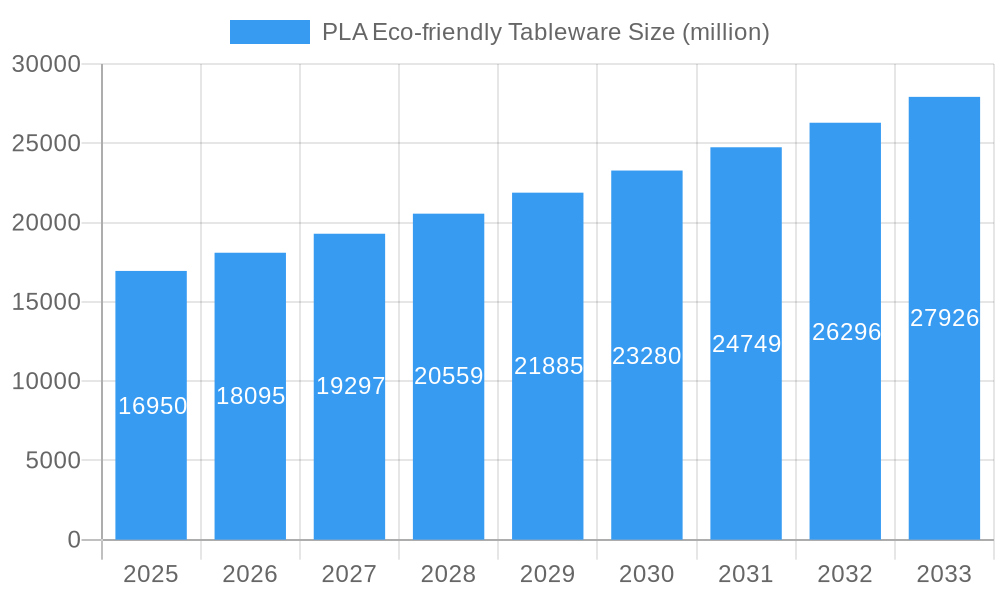
The global PLA eco-friendly tableware market is experiencing robust growth, projected to reach $16.95 billion by 2025, with a compelling CAGR of 6.78% during the forecast period of 2025-2033. This expansion is primarily fueled by a confluence of escalating environmental consciousness among consumers and businesses, coupled with increasingly stringent government regulations aimed at curbing single-use plastic waste. The demand for sustainable alternatives in the food service industry, particularly from fast-food restaurants, hotels, and general restaurants, is a significant driver. These establishments are actively seeking compostable and biodegradable tableware solutions to align with corporate social responsibility goals and to appeal to an environmentally aware customer base. Emerging economies, driven by rapid urbanization and a growing middle class, are also contributing significantly to market expansion as awareness of plastic pollution issues grows.
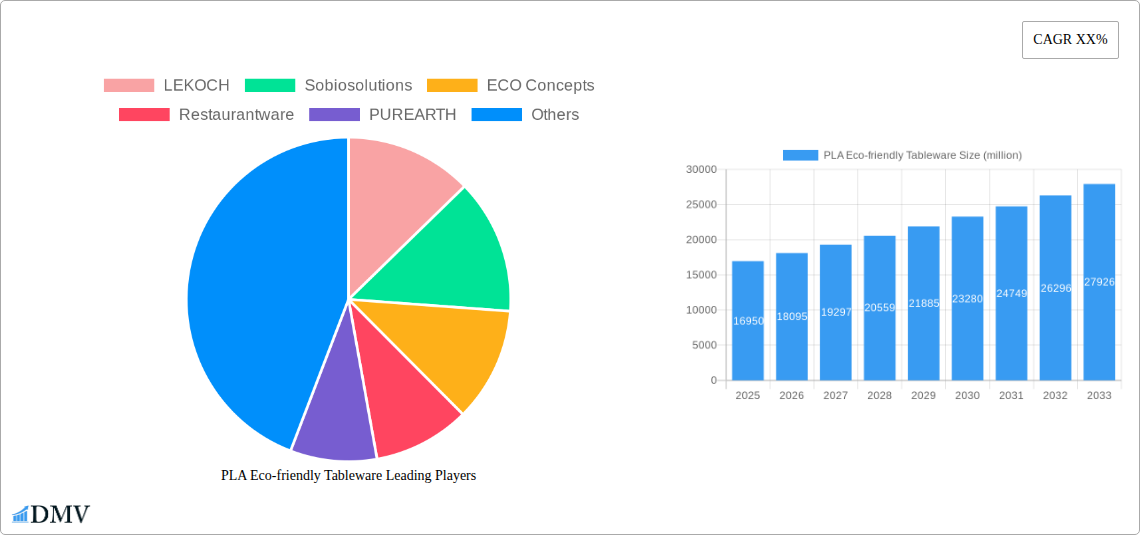
PLA Eco-friendly Tableware Market Size (In Billion)
Key trends shaping the PLA eco-friendly tableware market include advancements in material science leading to improved durability and heat resistance of PLA products, making them more competitive with traditional plastics. The rise of innovative product designs, including customizable options for branding and specific event needs, is also a notable trend. Furthermore, the increasing availability of PLA-based cups, covers, and straws directly addresses high-volume consumption areas within the food service sector. While the market is poised for substantial growth, certain restraints, such as the relatively higher cost of PLA compared to conventional plastics and the need for specific composting infrastructure, pose challenges. However, ongoing technological innovations and scaling of production are expected to mitigate these cost disparities over time, further solidifying PLA eco-friendly tableware's position as a leading sustainable solution.
PLA Eco-friendly Tableware Company Market Share
Report Description: PLA Eco-friendly Tableware Market Analysis & Forecast 2019-2033
This comprehensive report delves deep into the burgeoning PLA eco-friendly tableware market, providing an in-depth analysis of its current composition, historical evolution, and future trajectory. With a study period spanning from 2019 to 2033, this report offers invaluable insights for stakeholders seeking to understand the dynamics of sustainable food service solutions. The report leverages a base year of 2025 and an estimated year also of 2025, with a detailed forecast period from 2025 to 2033, building upon a robust historical period from 2019 to 2024. We meticulously examine the market's intricate landscape, from key players and technological innovations to regional dominance and emerging opportunities, all while focusing on billion-dollar market values and projections.
PLA Eco-friendly Tableware Market Composition & Trends
The global PLA eco-friendly tableware market exhibits a dynamic composition characterized by increasing adoption across various food service applications. Market concentration, while present among leading players, is evolving with the influx of innovative startups and established manufacturers expanding their sustainable product portfolios. Key innovation catalysts include advancements in biopolymer processing, improved durability, and enhanced compostability certifications. Regulatory landscapes worldwide are increasingly favoring sustainable alternatives, driving demand for biodegradable tableware and compostable food packaging. Substitute products, such as other bioplastics and traditional materials with recycled content, pose a competitive threat, but the superior eco-credentials of PLA continue to drive its market penetration. End-user profiles are diverse, encompassing quick-service restaurants, hotels, fine dining establishments, catering services, and individual consumers seeking environmentally friendly disposable cutlery and eco-friendly food containers. Mergers and acquisitions (M&A) activity within the sector is anticipated to rise as companies seek to consolidate market share, expand technological capabilities, and enhance their distribution networks. Projected M&A deal values are expected to reach in the billions over the forecast period, reflecting the growing strategic importance of this market.
- Market Share Distribution: While specific figures are proprietary, leading companies like LEKOCH and PUREARTH command significant market presence.
- Innovation Catalysts: Improved PLA formulations for heat resistance, grease resistance, and visual appeal.
- Regulatory Landscapes: Growing mandates for single-use plastic bans and incentivized use of compostable materials.
- Substitute Products: Bamboo tableware, bagasse tableware, recycled paper products.
- End-User Profiles: Dominance of fast food restaurants and hotels for bulk consumption.
- M&A Activities: Strategic acquisitions to gain market access and technological expertise.
PLA Eco-friendly Tableware Industry Evolution
The PLA eco-friendly tableware industry has witnessed a significant evolutionary arc, transforming from a niche segment to a mainstream solution for sustainable food service. Over the historical period (2019-2024), the market experienced a steady upward trajectory, driven by growing consumer awareness of plastic pollution and increasing corporate social responsibility initiatives. This period saw initial investments in research and development, leading to improved product quality and a wider variety of offerings, including PLA cups, PLA lids, and PLA straws. The base year (2025) marks a pivotal point where the industry is poised for accelerated growth, fueled by more stringent environmental regulations and a significant shift in consumer preference towards sustainable dining options.
Market growth trajectories have been consistently positive, with projected compound annual growth rates (CAGR) in the high single digits to low double digits throughout the forecast period (2025-2033). Technological advancements have been central to this evolution. Innovations in polymerization techniques have led to enhanced tensile strength, heat tolerance, and clarity of PLA-based products, making them more versatile and suitable for a broader range of applications. Furthermore, advancements in industrial composting infrastructure are crucial for realizing the full environmental benefits of PLA, encouraging greater adoption. Shifting consumer demands have been a paramount driver. Consumers, increasingly conscious of their environmental footprint, are actively seeking out businesses that offer eco-friendly disposable tableware. This demand extends from individual consumers choosing reusable or compostable options for home use to large corporations prioritizing sustainable supply chains. The application in fast food restaurants has seen a particularly robust growth, driven by the high volume of disposable tableware used and the increasing pressure on these establishments to adopt greener practices. Similarly, hotels and restaurants are embracing PLA to enhance their sustainability image and meet the expectations of eco-conscious travelers and diners. The segment of PLA straws, though facing some initial challenges related to performance in hot beverages, has seen significant innovation, leading to improved designs and wider acceptance. The overall industry evolution is a testament to the successful intersection of environmental imperative, technological innovation, and evolving consumer consciousness, paving the way for a billion-dollar market in sustainable tableware solutions.
Leading Regions, Countries, or Segments in PLA Eco-friendly Tableware
The dominance within the PLA eco-friendly tableware market is currently most pronounced in regions and countries that have proactively implemented stringent environmental policies and exhibit high consumer demand for sustainable products. North America and Europe stand out as leading regions due to robust governmental support for biodegradable products, coupled with a well-established infrastructure for industrial composting. Within these regions, the Application: Fast Food Restaurant segment is a significant driver of market growth. The sheer volume of disposable tableware consumed by fast-food chains, coupled with increasing public and regulatory pressure to reduce plastic waste, makes this a prime market for PLA adoption.
- Dominant Region: North America, driven by strong regulatory frameworks and high consumer demand for eco-friendly solutions.
- Key Country Drivers (North America): United States and Canada, with supportive legislation and a growing number of food service businesses committed to sustainability.
- Dominant Application Segment: Fast Food Restaurants, due to high consumption volumes and significant environmental impact concerns.
- Investment Trends: Increased capital expenditure by fast-food chains to transition to sustainable packaging solutions.
- Regulatory Support: Bans on single-use plastics and incentives for biodegradable alternatives directly boost PLA adoption.
- Consumer Preference: Growing demand from consumers for environmentally responsible dining experiences, influencing brand choices.
- Key Country Drivers (Europe): Germany, France, and the United Kingdom, with ambitious sustainability goals and widespread consumer awareness.
- Investment Trends: Significant investments in bioplastics manufacturing and waste management infrastructure.
- Regulatory Support: EU directives on single-use plastics and national legislation promoting circular economy principles.
- Consumer Preference: High environmental consciousness and a willingness to pay a premium for sustainable products.
Beyond fast food, the Application: Hotels segment also exhibits strong growth, driven by the hospitality industry's focus on enhancing its sustainability credentials to attract eco-conscious travelers. The Types: PLA Cup and PLA Cover are the most prevalent product categories across all applications due to their widespread daily use. The market's expansion in these leading regions and segments is indicative of a broader global shift towards sustainable consumption patterns, translating into substantial market value and future growth potential.
PLA Eco-friendly Tableware Product Innovations
Recent product innovations in the PLA eco-friendly tableware market are significantly enhancing performance and broadening application possibilities. Manufacturers are developing PLA-based products with improved heat resistance, enabling their use with hot beverages and foods without compromising structural integrity. Advancements in barrier properties are also addressing concerns about grease and moisture resistance, making PLA suitable for a wider array of food types. Unique selling propositions include enhanced compostability certifications, ensuring efficient breakdown in industrial facilities, and the development of aesthetically pleasing designs and textures that rival traditional tableware. Technological advancements focus on optimizing the extrusion and molding processes to reduce manufacturing costs and increase production efficiency, thereby making eco-friendly disposable cutlery and containers more economically viable.
Propelling Factors for PLA Eco-friendly Tableware Growth
The PLA eco-friendly tableware market is propelled by a confluence of powerful factors. Growing global awareness of plastic pollution and its detrimental environmental impact is a primary catalyst, driving both consumer and corporate demand for sustainable alternatives. Stringent government regulations and bans on single-use plastics worldwide are creating a favorable market environment, pushing businesses to adopt compliant and eco-friendly solutions like biodegradable food packaging. Technological advancements in PLA production and processing are leading to improved product performance, durability, and cost-effectiveness, making PLA a more competitive choice. Furthermore, the increasing corporate social responsibility (CSR) initiatives and brand commitments to sustainability are influencing procurement decisions, leading to a wider adoption of PLA tableware across various food service sectors.
Obstacles in the PLA Eco-friendly Tableware Market
Despite robust growth, the PLA eco-friendly tableware market faces certain obstacles. The primary challenge remains the availability and accessibility of industrial composting facilities, which are crucial for the effective end-of-life management of PLA products. Without proper composting infrastructure, PLA can end up in landfills, diminishing its environmental benefits. Supply chain disruptions, including fluctuations in raw material availability and pricing, can impact production costs and lead times, affecting market stability. Competitive pressures from alternative sustainable materials, as well as cost-sensitive markets, also present challenges. Furthermore, consumer confusion regarding the proper disposal of PLA products can hinder its widespread adoption and perceived environmental advantage.
Future Opportunities in PLA Eco-friendly Tableware
The PLA eco-friendly tableware market is ripe with emerging opportunities. The expansion of industrial composting infrastructure globally presents a significant opportunity to enhance the circularity of PLA products and address end-of-life concerns. Innovations in developing PLA blends and composites with enhanced properties, such as greater heat resistance and compostability in home environments, will unlock new market segments. The growing trend of food delivery and take-out services creates substantial demand for eco-friendly disposable cutlery and compostable food containers. Furthermore, exploring new geographic markets with developing environmental awareness and regulatory frameworks offers significant growth potential for sustainable tableware manufacturers.
Major Players in the PLA Eco-friendly Tableware Ecosystem
- LEKOCH
- Sobiosolutions
- ECO Concepts
- Restaurantware
- PUREARTH
- Eco-Products
- SelfEco
- Farwind
- Chuk
- VerTerra
- BioPak
- Ecosoulife
- Greenovation
- DevEuro
- Polar Pak
- YJS
Key Developments in PLA Eco-friendly Tableware Industry
- 2023 March: LEKOCH launches a new line of PLA cutlery with enhanced tensile strength, designed for hot food applications.
- 2023 July: Eco-Products announces a strategic partnership with a major fast-food chain to supply PLA cups and lids across their outlets.
- 2024 January: PUREARTH expands its production capacity for PLA straws to meet growing demand from the beverage industry.
- 2024 April: Regulatory bodies in several European countries introduce new mandates for compostable food packaging, boosting the market for companies like BioPak and VerTerra.
- 2024 September: Research into advanced PLA formulations with improved barrier properties and home compostability gains momentum, promising further innovation from players like Ecosoulife and Greenovation.
Strategic PLA Eco-friendly Tableware Market Forecast
The strategic outlook for the PLA eco-friendly tableware market is overwhelmingly positive, driven by sustained global momentum towards sustainability and a robust pipeline of innovation. Key growth catalysts include increasingly stringent environmental regulations, growing consumer preference for eco-conscious products, and advancements in material science leading to improved performance and cost-competitiveness of PLA-based solutions. The expansion of food delivery services and the hospitality sector's commitment to green practices further solidify this positive trajectory. With the anticipated expansion of industrial composting infrastructure and the development of more versatile PLA products, the market is poised for significant growth, presenting substantial opportunities for established players and new entrants alike to capture a substantial share of this rapidly expanding billion-dollar market.
PLA Eco-friendly Tableware Segmentation
-
1. Application
- 1.1. Fast Food Restaurant
- 1.2. Hotels
- 1.3. Restaurant
- 1.4. Others
-
2. Types
- 2.1. PLA Cup
- 2.2. PLA Cover
- 2.3. PLA Straws
- 2.4. Others
PLA Eco-friendly Tableware Segmentation By Geography
-
1. North America
- 1.1. United States
- 1.2. Canada
- 1.3. Mexico
-
2. South America
- 2.1. Brazil
- 2.2. Argentina
- 2.3. Rest of South America
-
3. Europe
- 3.1. United Kingdom
- 3.2. Germany
- 3.3. France
- 3.4. Italy
- 3.5. Spain
- 3.6. Russia
- 3.7. Benelux
- 3.8. Nordics
- 3.9. Rest of Europe
-
4. Middle East & Africa
- 4.1. Turkey
- 4.2. Israel
- 4.3. GCC
- 4.4. North Africa
- 4.5. South Africa
- 4.6. Rest of Middle East & Africa
-
5. Asia Pacific
- 5.1. China
- 5.2. India
- 5.3. Japan
- 5.4. South Korea
- 5.5. ASEAN
- 5.6. Oceania
- 5.7. Rest of Asia Pacific
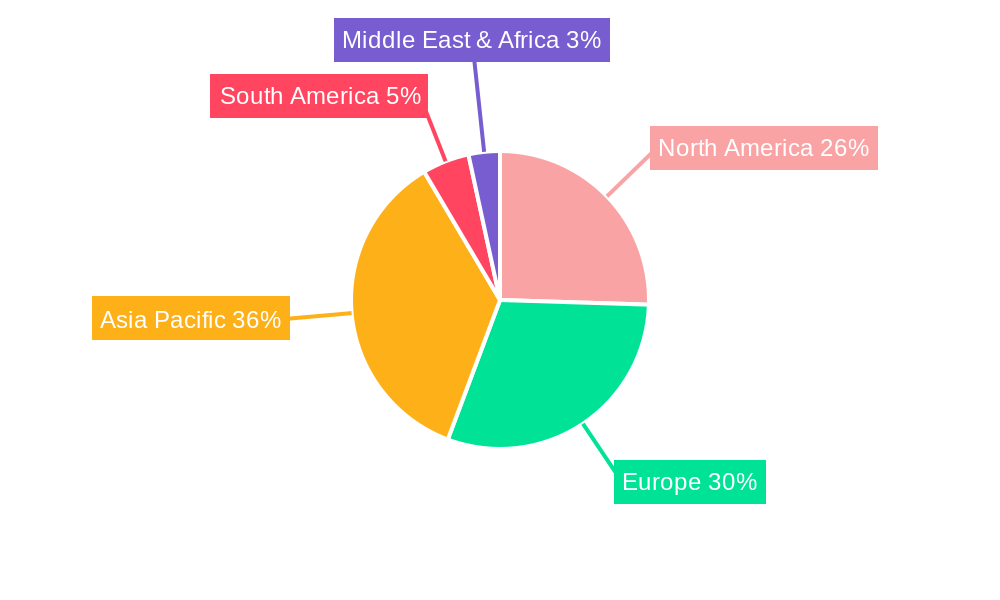
PLA Eco-friendly Tableware Regional Market Share
Geographic Coverage of PLA Eco-friendly Tableware
PLA Eco-friendly Tableware REPORT HIGHLIGHTS
| Aspects | Details |
|---|---|
| Study Period | 2020-2034 |
| Base Year | 2025 |
| Estimated Year | 2026 |
| Forecast Period | 2026-2034 |
| Historical Period | 2020-2025 |
| Growth Rate | CAGR of 6.78% from 2020-2034 |
| Segmentation |
|
Table of Contents
- 1. Introduction
- 1.1. Research Scope
- 1.2. Market Segmentation
- 1.3. Research Methodology
- 1.4. Definitions and Assumptions
- 2. Executive Summary
- 2.1. Introduction
- 3. Market Dynamics
- 3.1. Introduction
- 3.2. Market Drivers
- 3.3. Market Restrains
- 3.4. Market Trends
- 4. Market Factor Analysis
- 4.1. Porters Five Forces
- 4.2. Supply/Value Chain
- 4.3. PESTEL analysis
- 4.4. Market Entropy
- 4.5. Patent/Trademark Analysis
- 5. Global PLA Eco-friendly Tableware Analysis, Insights and Forecast, 2020-2032
- 5.1. Market Analysis, Insights and Forecast - by Application
- 5.1.1. Fast Food Restaurant
- 5.1.2. Hotels
- 5.1.3. Restaurant
- 5.1.4. Others
- 5.2. Market Analysis, Insights and Forecast - by Types
- 5.2.1. PLA Cup
- 5.2.2. PLA Cover
- 5.2.3. PLA Straws
- 5.2.4. Others
- 5.3. Market Analysis, Insights and Forecast - by Region
- 5.3.1. North America
- 5.3.2. South America
- 5.3.3. Europe
- 5.3.4. Middle East & Africa
- 5.3.5. Asia Pacific
- 5.1. Market Analysis, Insights and Forecast - by Application
- 6. North America PLA Eco-friendly Tableware Analysis, Insights and Forecast, 2020-2032
- 6.1. Market Analysis, Insights and Forecast - by Application
- 6.1.1. Fast Food Restaurant
- 6.1.2. Hotels
- 6.1.3. Restaurant
- 6.1.4. Others
- 6.2. Market Analysis, Insights and Forecast - by Types
- 6.2.1. PLA Cup
- 6.2.2. PLA Cover
- 6.2.3. PLA Straws
- 6.2.4. Others
- 6.1. Market Analysis, Insights and Forecast - by Application
- 7. South America PLA Eco-friendly Tableware Analysis, Insights and Forecast, 2020-2032
- 7.1. Market Analysis, Insights and Forecast - by Application
- 7.1.1. Fast Food Restaurant
- 7.1.2. Hotels
- 7.1.3. Restaurant
- 7.1.4. Others
- 7.2. Market Analysis, Insights and Forecast - by Types
- 7.2.1. PLA Cup
- 7.2.2. PLA Cover
- 7.2.3. PLA Straws
- 7.2.4. Others
- 7.1. Market Analysis, Insights and Forecast - by Application
- 8. Europe PLA Eco-friendly Tableware Analysis, Insights and Forecast, 2020-2032
- 8.1. Market Analysis, Insights and Forecast - by Application
- 8.1.1. Fast Food Restaurant
- 8.1.2. Hotels
- 8.1.3. Restaurant
- 8.1.4. Others
- 8.2. Market Analysis, Insights and Forecast - by Types
- 8.2.1. PLA Cup
- 8.2.2. PLA Cover
- 8.2.3. PLA Straws
- 8.2.4. Others
- 8.1. Market Analysis, Insights and Forecast - by Application
- 9. Middle East & Africa PLA Eco-friendly Tableware Analysis, Insights and Forecast, 2020-2032
- 9.1. Market Analysis, Insights and Forecast - by Application
- 9.1.1. Fast Food Restaurant
- 9.1.2. Hotels
- 9.1.3. Restaurant
- 9.1.4. Others
- 9.2. Market Analysis, Insights and Forecast - by Types
- 9.2.1. PLA Cup
- 9.2.2. PLA Cover
- 9.2.3. PLA Straws
- 9.2.4. Others
- 9.1. Market Analysis, Insights and Forecast - by Application
- 10. Asia Pacific PLA Eco-friendly Tableware Analysis, Insights and Forecast, 2020-2032
- 10.1. Market Analysis, Insights and Forecast - by Application
- 10.1.1. Fast Food Restaurant
- 10.1.2. Hotels
- 10.1.3. Restaurant
- 10.1.4. Others
- 10.2. Market Analysis, Insights and Forecast - by Types
- 10.2.1. PLA Cup
- 10.2.2. PLA Cover
- 10.2.3. PLA Straws
- 10.2.4. Others
- 10.1. Market Analysis, Insights and Forecast - by Application
- 11. Competitive Analysis
- 11.1. Global Market Share Analysis 2025
- 11.2. Company Profiles
- 11.2.1 LEKOCH
- 11.2.1.1. Overview
- 11.2.1.2. Products
- 11.2.1.3. SWOT Analysis
- 11.2.1.4. Recent Developments
- 11.2.1.5. Financials (Based on Availability)
- 11.2.2 Sobiosolutions
- 11.2.2.1. Overview
- 11.2.2.2. Products
- 11.2.2.3. SWOT Analysis
- 11.2.2.4. Recent Developments
- 11.2.2.5. Financials (Based on Availability)
- 11.2.3 ECO Concepts
- 11.2.3.1. Overview
- 11.2.3.2. Products
- 11.2.3.3. SWOT Analysis
- 11.2.3.4. Recent Developments
- 11.2.3.5. Financials (Based on Availability)
- 11.2.4 Restaurantware
- 11.2.4.1. Overview
- 11.2.4.2. Products
- 11.2.4.3. SWOT Analysis
- 11.2.4.4. Recent Developments
- 11.2.4.5. Financials (Based on Availability)
- 11.2.5 PUREARTH
- 11.2.5.1. Overview
- 11.2.5.2. Products
- 11.2.5.3. SWOT Analysis
- 11.2.5.4. Recent Developments
- 11.2.5.5. Financials (Based on Availability)
- 11.2.6 Eco-Products
- 11.2.6.1. Overview
- 11.2.6.2. Products
- 11.2.6.3. SWOT Analysis
- 11.2.6.4. Recent Developments
- 11.2.6.5. Financials (Based on Availability)
- 11.2.7 SelfEco
- 11.2.7.1. Overview
- 11.2.7.2. Products
- 11.2.7.3. SWOT Analysis
- 11.2.7.4. Recent Developments
- 11.2.7.5. Financials (Based on Availability)
- 11.2.8 Farwind
- 11.2.8.1. Overview
- 11.2.8.2. Products
- 11.2.8.3. SWOT Analysis
- 11.2.8.4. Recent Developments
- 11.2.8.5. Financials (Based on Availability)
- 11.2.9 Chuk
- 11.2.9.1. Overview
- 11.2.9.2. Products
- 11.2.9.3. SWOT Analysis
- 11.2.9.4. Recent Developments
- 11.2.9.5. Financials (Based on Availability)
- 11.2.10 VerTerra
- 11.2.10.1. Overview
- 11.2.10.2. Products
- 11.2.10.3. SWOT Analysis
- 11.2.10.4. Recent Developments
- 11.2.10.5. Financials (Based on Availability)
- 11.2.11 BioPak
- 11.2.11.1. Overview
- 11.2.11.2. Products
- 11.2.11.3. SWOT Analysis
- 11.2.11.4. Recent Developments
- 11.2.11.5. Financials (Based on Availability)
- 11.2.12 Ecosoulife
- 11.2.12.1. Overview
- 11.2.12.2. Products
- 11.2.12.3. SWOT Analysis
- 11.2.12.4. Recent Developments
- 11.2.12.5. Financials (Based on Availability)
- 11.2.13 Greenovation
- 11.2.13.1. Overview
- 11.2.13.2. Products
- 11.2.13.3. SWOT Analysis
- 11.2.13.4. Recent Developments
- 11.2.13.5. Financials (Based on Availability)
- 11.2.14 DevEuro
- 11.2.14.1. Overview
- 11.2.14.2. Products
- 11.2.14.3. SWOT Analysis
- 11.2.14.4. Recent Developments
- 11.2.14.5. Financials (Based on Availability)
- 11.2.15 Polar Pak
- 11.2.15.1. Overview
- 11.2.15.2. Products
- 11.2.15.3. SWOT Analysis
- 11.2.15.4. Recent Developments
- 11.2.15.5. Financials (Based on Availability)
- 11.2.16 YJS
- 11.2.16.1. Overview
- 11.2.16.2. Products
- 11.2.16.3. SWOT Analysis
- 11.2.16.4. Recent Developments
- 11.2.16.5. Financials (Based on Availability)
- 11.2.1 LEKOCH
List of Figures
- Figure 1: Global PLA Eco-friendly Tableware Revenue Breakdown (undefined, %) by Region 2025 & 2033
- Figure 2: North America PLA Eco-friendly Tableware Revenue (undefined), by Application 2025 & 2033
- Figure 3: North America PLA Eco-friendly Tableware Revenue Share (%), by Application 2025 & 2033
- Figure 4: North America PLA Eco-friendly Tableware Revenue (undefined), by Types 2025 & 2033
- Figure 5: North America PLA Eco-friendly Tableware Revenue Share (%), by Types 2025 & 2033
- Figure 6: North America PLA Eco-friendly Tableware Revenue (undefined), by Country 2025 & 2033
- Figure 7: North America PLA Eco-friendly Tableware Revenue Share (%), by Country 2025 & 2033
- Figure 8: South America PLA Eco-friendly Tableware Revenue (undefined), by Application 2025 & 2033
- Figure 9: South America PLA Eco-friendly Tableware Revenue Share (%), by Application 2025 & 2033
- Figure 10: South America PLA Eco-friendly Tableware Revenue (undefined), by Types 2025 & 2033
- Figure 11: South America PLA Eco-friendly Tableware Revenue Share (%), by Types 2025 & 2033
- Figure 12: South America PLA Eco-friendly Tableware Revenue (undefined), by Country 2025 & 2033
- Figure 13: South America PLA Eco-friendly Tableware Revenue Share (%), by Country 2025 & 2033
- Figure 14: Europe PLA Eco-friendly Tableware Revenue (undefined), by Application 2025 & 2033
- Figure 15: Europe PLA Eco-friendly Tableware Revenue Share (%), by Application 2025 & 2033
- Figure 16: Europe PLA Eco-friendly Tableware Revenue (undefined), by Types 2025 & 2033
- Figure 17: Europe PLA Eco-friendly Tableware Revenue Share (%), by Types 2025 & 2033
- Figure 18: Europe PLA Eco-friendly Tableware Revenue (undefined), by Country 2025 & 2033
- Figure 19: Europe PLA Eco-friendly Tableware Revenue Share (%), by Country 2025 & 2033
- Figure 20: Middle East & Africa PLA Eco-friendly Tableware Revenue (undefined), by Application 2025 & 2033
- Figure 21: Middle East & Africa PLA Eco-friendly Tableware Revenue Share (%), by Application 2025 & 2033
- Figure 22: Middle East & Africa PLA Eco-friendly Tableware Revenue (undefined), by Types 2025 & 2033
- Figure 23: Middle East & Africa PLA Eco-friendly Tableware Revenue Share (%), by Types 2025 & 2033
- Figure 24: Middle East & Africa PLA Eco-friendly Tableware Revenue (undefined), by Country 2025 & 2033
- Figure 25: Middle East & Africa PLA Eco-friendly Tableware Revenue Share (%), by Country 2025 & 2033
- Figure 26: Asia Pacific PLA Eco-friendly Tableware Revenue (undefined), by Application 2025 & 2033
- Figure 27: Asia Pacific PLA Eco-friendly Tableware Revenue Share (%), by Application 2025 & 2033
- Figure 28: Asia Pacific PLA Eco-friendly Tableware Revenue (undefined), by Types 2025 & 2033
- Figure 29: Asia Pacific PLA Eco-friendly Tableware Revenue Share (%), by Types 2025 & 2033
- Figure 30: Asia Pacific PLA Eco-friendly Tableware Revenue (undefined), by Country 2025 & 2033
- Figure 31: Asia Pacific PLA Eco-friendly Tableware Revenue Share (%), by Country 2025 & 2033
List of Tables
- Table 1: Global PLA Eco-friendly Tableware Revenue undefined Forecast, by Application 2020 & 2033
- Table 2: Global PLA Eco-friendly Tableware Revenue undefined Forecast, by Types 2020 & 2033
- Table 3: Global PLA Eco-friendly Tableware Revenue undefined Forecast, by Region 2020 & 2033
- Table 4: Global PLA Eco-friendly Tableware Revenue undefined Forecast, by Application 2020 & 2033
- Table 5: Global PLA Eco-friendly Tableware Revenue undefined Forecast, by Types 2020 & 2033
- Table 6: Global PLA Eco-friendly Tableware Revenue undefined Forecast, by Country 2020 & 2033
- Table 7: United States PLA Eco-friendly Tableware Revenue (undefined) Forecast, by Application 2020 & 2033
- Table 8: Canada PLA Eco-friendly Tableware Revenue (undefined) Forecast, by Application 2020 & 2033
- Table 9: Mexico PLA Eco-friendly Tableware Revenue (undefined) Forecast, by Application 2020 & 2033
- Table 10: Global PLA Eco-friendly Tableware Revenue undefined Forecast, by Application 2020 & 2033
- Table 11: Global PLA Eco-friendly Tableware Revenue undefined Forecast, by Types 2020 & 2033
- Table 12: Global PLA Eco-friendly Tableware Revenue undefined Forecast, by Country 2020 & 2033
- Table 13: Brazil PLA Eco-friendly Tableware Revenue (undefined) Forecast, by Application 2020 & 2033
- Table 14: Argentina PLA Eco-friendly Tableware Revenue (undefined) Forecast, by Application 2020 & 2033
- Table 15: Rest of South America PLA Eco-friendly Tableware Revenue (undefined) Forecast, by Application 2020 & 2033
- Table 16: Global PLA Eco-friendly Tableware Revenue undefined Forecast, by Application 2020 & 2033
- Table 17: Global PLA Eco-friendly Tableware Revenue undefined Forecast, by Types 2020 & 2033
- Table 18: Global PLA Eco-friendly Tableware Revenue undefined Forecast, by Country 2020 & 2033
- Table 19: United Kingdom PLA Eco-friendly Tableware Revenue (undefined) Forecast, by Application 2020 & 2033
- Table 20: Germany PLA Eco-friendly Tableware Revenue (undefined) Forecast, by Application 2020 & 2033
- Table 21: France PLA Eco-friendly Tableware Revenue (undefined) Forecast, by Application 2020 & 2033
- Table 22: Italy PLA Eco-friendly Tableware Revenue (undefined) Forecast, by Application 2020 & 2033
- Table 23: Spain PLA Eco-friendly Tableware Revenue (undefined) Forecast, by Application 2020 & 2033
- Table 24: Russia PLA Eco-friendly Tableware Revenue (undefined) Forecast, by Application 2020 & 2033
- Table 25: Benelux PLA Eco-friendly Tableware Revenue (undefined) Forecast, by Application 2020 & 2033
- Table 26: Nordics PLA Eco-friendly Tableware Revenue (undefined) Forecast, by Application 2020 & 2033
- Table 27: Rest of Europe PLA Eco-friendly Tableware Revenue (undefined) Forecast, by Application 2020 & 2033
- Table 28: Global PLA Eco-friendly Tableware Revenue undefined Forecast, by Application 2020 & 2033
- Table 29: Global PLA Eco-friendly Tableware Revenue undefined Forecast, by Types 2020 & 2033
- Table 30: Global PLA Eco-friendly Tableware Revenue undefined Forecast, by Country 2020 & 2033
- Table 31: Turkey PLA Eco-friendly Tableware Revenue (undefined) Forecast, by Application 2020 & 2033
- Table 32: Israel PLA Eco-friendly Tableware Revenue (undefined) Forecast, by Application 2020 & 2033
- Table 33: GCC PLA Eco-friendly Tableware Revenue (undefined) Forecast, by Application 2020 & 2033
- Table 34: North Africa PLA Eco-friendly Tableware Revenue (undefined) Forecast, by Application 2020 & 2033
- Table 35: South Africa PLA Eco-friendly Tableware Revenue (undefined) Forecast, by Application 2020 & 2033
- Table 36: Rest of Middle East & Africa PLA Eco-friendly Tableware Revenue (undefined) Forecast, by Application 2020 & 2033
- Table 37: Global PLA Eco-friendly Tableware Revenue undefined Forecast, by Application 2020 & 2033
- Table 38: Global PLA Eco-friendly Tableware Revenue undefined Forecast, by Types 2020 & 2033
- Table 39: Global PLA Eco-friendly Tableware Revenue undefined Forecast, by Country 2020 & 2033
- Table 40: China PLA Eco-friendly Tableware Revenue (undefined) Forecast, by Application 2020 & 2033
- Table 41: India PLA Eco-friendly Tableware Revenue (undefined) Forecast, by Application 2020 & 2033
- Table 42: Japan PLA Eco-friendly Tableware Revenue (undefined) Forecast, by Application 2020 & 2033
- Table 43: South Korea PLA Eco-friendly Tableware Revenue (undefined) Forecast, by Application 2020 & 2033
- Table 44: ASEAN PLA Eco-friendly Tableware Revenue (undefined) Forecast, by Application 2020 & 2033
- Table 45: Oceania PLA Eco-friendly Tableware Revenue (undefined) Forecast, by Application 2020 & 2033
- Table 46: Rest of Asia Pacific PLA Eco-friendly Tableware Revenue (undefined) Forecast, by Application 2020 & 2033
Frequently Asked Questions
1. What is the projected Compound Annual Growth Rate (CAGR) of the PLA Eco-friendly Tableware?
The projected CAGR is approximately 6.78%.
2. Which companies are prominent players in the PLA Eco-friendly Tableware?
Key companies in the market include LEKOCH, Sobiosolutions, ECO Concepts, Restaurantware, PUREARTH, Eco-Products, SelfEco, Farwind, Chuk, VerTerra, BioPak, Ecosoulife, Greenovation, DevEuro, Polar Pak, YJS.
3. What are the main segments of the PLA Eco-friendly Tableware?
The market segments include Application, Types.
4. Can you provide details about the market size?
The market size is estimated to be USD XXX N/A as of 2022.
5. What are some drivers contributing to market growth?
N/A
6. What are the notable trends driving market growth?
N/A
7. Are there any restraints impacting market growth?
N/A
8. Can you provide examples of recent developments in the market?
N/A
9. What pricing options are available for accessing the report?
Pricing options include single-user, multi-user, and enterprise licenses priced at USD 2900.00, USD 4350.00, and USD 5800.00 respectively.
10. Is the market size provided in terms of value or volume?
The market size is provided in terms of value, measured in N/A.
11. Are there any specific market keywords associated with the report?
Yes, the market keyword associated with the report is "PLA Eco-friendly Tableware," which aids in identifying and referencing the specific market segment covered.
12. How do I determine which pricing option suits my needs best?
The pricing options vary based on user requirements and access needs. Individual users may opt for single-user licenses, while businesses requiring broader access may choose multi-user or enterprise licenses for cost-effective access to the report.
13. Are there any additional resources or data provided in the PLA Eco-friendly Tableware report?
While the report offers comprehensive insights, it's advisable to review the specific contents or supplementary materials provided to ascertain if additional resources or data are available.
14. How can I stay updated on further developments or reports in the PLA Eco-friendly Tableware?
To stay informed about further developments, trends, and reports in the PLA Eco-friendly Tableware, consider subscribing to industry newsletters, following relevant companies and organizations, or regularly checking reputable industry news sources and publications.
Methodology
Step 1 - Identification of Relevant Samples Size from Population Database


Step 2 - Approaches for Defining Global Market Size (Value, Volume* & Price*)

Note*: In applicable scenarios
Step 3 - Data Sources
Primary Research
- Web Analytics
- Survey Reports
- Research Institute
- Latest Research Reports
- Opinion Leaders
Secondary Research
- Annual Reports
- White Paper
- Latest Press Release
- Industry Association
- Paid Database
- Investor Presentations

Step 4 - Data Triangulation
Involves using different sources of information in order to increase the validity of a study
These sources are likely to be stakeholders in a program - participants, other researchers, program staff, other community members, and so on.
Then we put all data in single framework & apply various statistical tools to find out the dynamic on the market.
During the analysis stage, feedback from the stakeholder groups would be compared to determine areas of agreement as well as areas of divergence