

Key Insights
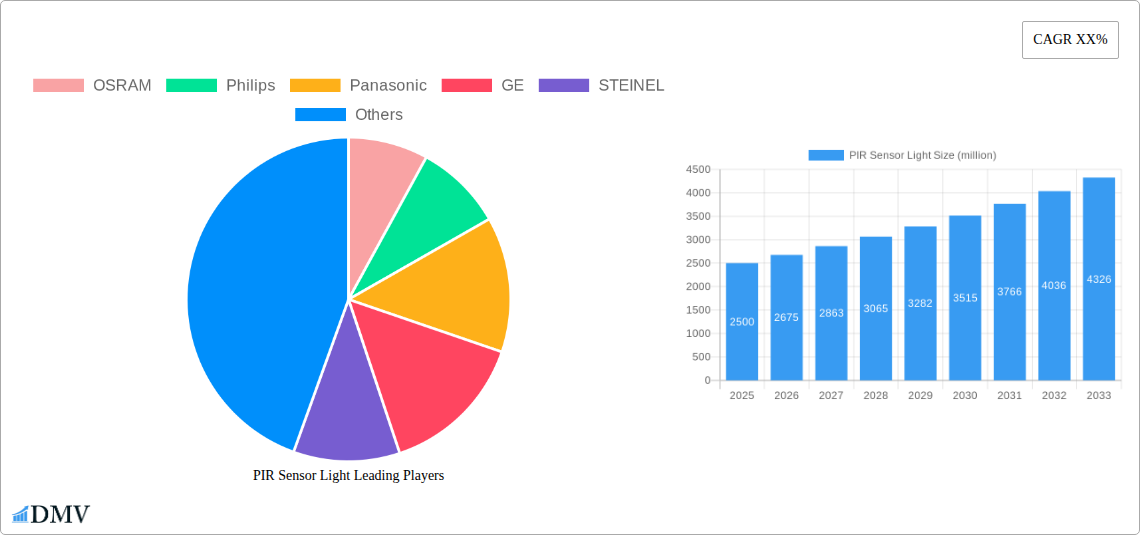
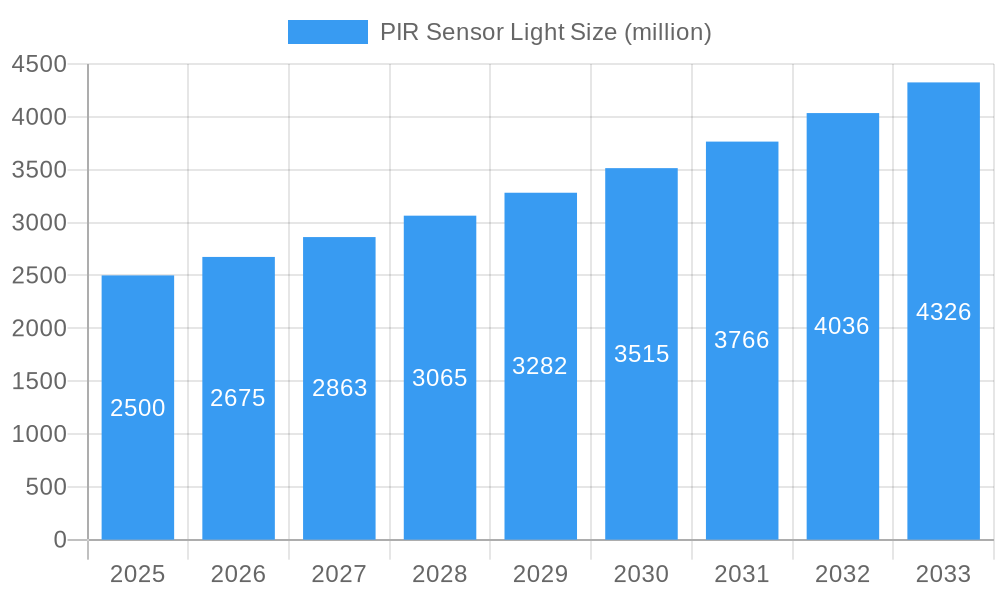
The PIR sensor light market, encompassing motion-activated lighting solutions, is experiencing robust growth driven by increasing demand for enhanced security, energy efficiency, and convenience in residential and commercial settings. The market's expansion is fueled by several key factors. Firstly, rising consumer awareness regarding energy conservation is boosting adoption of energy-efficient LED-based PIR sensor lights, which automatically switch on only when motion is detected. Secondly, advancements in sensor technology, resulting in improved detection range, accuracy, and reduced false triggers, are making these lights more appealing. The integration of smart home technology further enhances market appeal, allowing users to control and schedule lighting remotely via smartphones or other smart devices. This trend is particularly pronounced in developed regions like North America and Europe, where smart home adoption rates are high. However, factors such as the initial investment cost for installing these systems and concerns about privacy related to motion detection can act as market restraints. Major players like OSRAM, Philips, and others are continuously innovating with new product features and functionalities to drive market penetration. We estimate the market size to be around $2.5 billion in 2025, growing at a CAGR of 7% through 2033, driven by continued technological advancements and increasing adoption across diverse applications.
PIR Sensor Light Market Size (In Billion)
The segmentation of the PIR sensor light market is diverse, including indoor and outdoor applications, variations in lighting technology (LED, incandescent), power source (battery, mains), and price points catering to various consumer segments. Competitive landscape analysis reveals the presence of both established lighting manufacturers and specialized sensor technology providers. Growth opportunities exist in expanding into emerging markets with increasing urbanization and infrastructure development. Further market penetration could be achieved by focusing on niche applications like smart street lighting, industrial automation, and security systems for commercial buildings. Focusing on cost-effective solutions and user-friendly installation processes could also attract a wider consumer base. The market is expected to see increased consolidation as larger players acquire smaller companies specializing in specific sensor technologies or geographic markets. Long-term growth will depend on innovation in areas such as improved energy efficiency, smarter control systems, and integration with broader smart home ecosystems.
PIR Sensor Light Company Market Share
PIR Sensor Light Market Report: A Comprehensive Analysis (2019-2033)
This insightful report provides a comprehensive analysis of the global PIR Sensor Light market, projecting a market value exceeding $XX million by 2033. The report covers the period from 2019 to 2033, with 2025 as the base and estimated year. It offers a deep dive into market composition, industry evolution, leading players, and future opportunities, equipping stakeholders with actionable insights for strategic decision-making.
PIR Sensor Light Market Composition & Trends
This section evaluates the market's competitive landscape, examining market concentration, innovation drivers, regulatory influences, substitute products, end-user profiles, and mergers and acquisitions (M&A) activity. The analysis covers the historical period (2019-2024) and projects trends through 2033.
Market Concentration and Share Distribution: The PIR sensor light market exhibits a moderately consolidated structure, with leading players like OSRAM, Philips, and Panasonic holding a significant combined market share of approximately XX%. Smaller players, including STEINEL, Ring (Mr Beams), and others, contribute to the remaining market share. The market share distribution is expected to remain relatively stable during the forecast period, although some shifts are anticipated due to technological advancements and strategic alliances.
Innovation Catalysts and Regulatory Landscape: Ongoing innovation in LED technology, improved sensor sensitivity, and smart home integration are major catalysts for market growth. Stringent energy efficiency regulations globally are driving adoption of energy-saving PIR sensor lights. The introduction of new smart features, such as app-based controls and integration with other IoT devices, are further propelling market expansion.
Substitute Products and End-User Profiles: While traditional lighting solutions represent a primary substitute, the increasing demand for energy efficiency and security features positions PIR sensor lights favorably. Key end-user segments include residential, commercial, and industrial applications, with residential dominating the market.
M&A Activities: During the historical period, several M&A activities were observed in the sector, resulting in approximately $XX million in deal values. These activities have predominantly focused on expanding product portfolios and geographical reach. Future M&A activities are expected to consolidate the market further.
PIR Sensor Light Industry Evolution
This section details the evolution of the PIR sensor light market, analyzing growth trajectories, technological advancements, and shifting consumer demands from 2019 to 2033. The analysis includes specific data points on growth rates and adoption metrics.
The global PIR sensor light market has experienced significant growth in the historical period (2019-2024), with a compound annual growth rate (CAGR) of approximately XX%. This growth is primarily attributed to increasing demand for energy-efficient lighting solutions, rising security concerns, and expanding smart home adoption. Technological advancements, such as the introduction of longer-lasting, more energy-efficient LEDs, along with improved sensor technology, have enhanced product performance and affordability, fueling market expansion.
The forecast period (2025-2033) anticipates continued growth, albeit at a slightly moderated pace, with a projected CAGR of approximately XX%. The adoption rate of PIR sensor lights in both new construction and retrofitting applications is expected to increase steadily. Consumers are increasingly drawn to smart features, such as motion detection, scheduling capabilities, and integration with other smart home systems.
Leading Regions, Countries, or Segments in PIR Sensor Light
This section pinpoints the leading region, country, or segment in the PIR sensor light market.
Dominant Region: North America consistently holds the largest market share, driven by high consumer spending on home improvement and security solutions, as well as stringent energy efficiency standards.
Key Drivers in North America:
- High levels of disposable income and consumer spending on home improvement.
- Strong adoption of smart home technology.
- Stringent energy efficiency regulations encouraging the adoption of energy-saving lighting.
- Increasing focus on security measures, including motion-sensing lighting.
The dominance of North America can be attributed to a combination of factors, including high consumer spending power, robust adoption of smart home technology, and supportive government regulations favoring energy efficiency. These factors drive strong demand for PIR sensor lights across both residential and commercial sectors. Further analysis reveals a strong correlation between higher disposable incomes and increased PIR sensor light adoption rates.
PIR Sensor Light Product Innovations
Recent product innovations in PIR sensor lights have focused on improving energy efficiency, enhancing sensor accuracy, and integrating smart features. The incorporation of advanced LED technology has enabled longer lifespan and reduced energy consumption. Sophisticated sensor algorithms improve motion detection accuracy, minimizing false triggers. Integration with smart home ecosystems allows for remote control and scheduling, adding convenience and enhancing security. Unique selling propositions (USPs) include features like adjustable sensitivity, multiple lighting modes (e.g., brightness levels, color temperatures), and compatibility with various smart home platforms.
Propelling Factors for PIR Sensor Light Growth
Several key factors drive the growth of the PIR sensor light market. Increased demand for energy-efficient lighting solutions is a significant driver, as PIR sensor lights automatically switch on only when needed, considerably reducing energy consumption compared to traditional lighting systems. Growing concerns about home security are also boosting demand, with PIR sensor lights providing an effective deterrent against intruders. Moreover, the integration of these lights with smart home systems enhances convenience and control, appealing to technologically-savvy consumers. Government regulations promoting energy efficiency further stimulate market growth.
Obstacles in the PIR Sensor Light Market
Despite its growth potential, the PIR sensor light market faces certain challenges. Supply chain disruptions caused by global events can lead to increased production costs and delays, impacting market growth. Competitive pressures from established lighting manufacturers and emerging players can also put downward pressure on pricing. Furthermore, fluctuating raw material prices can affect overall profitability and accessibility. Finally, the varying levels of technological adoption across different regions can influence market penetration rates.
Future Opportunities in PIR Sensor Light
The future of the PIR sensor light market holds immense potential. The integration of these lights with advanced sensor technologies (e.g., facial recognition) and AI-powered features will create more sophisticated and personalized security systems. Expansion into new geographical regions with growing infrastructure and rising disposable incomes will also contribute to market growth. Further development and integration within the Internet of Things (IoT) ecosystem will unlock even more potential. Lastly, innovations in sustainable and eco-friendly materials could broaden the appeal of PIR sensor lights.
Major Players in the PIR Sensor Light Ecosystem
- OSRAM
- Philips
- Panasonic
- GE
- STEINEL
- Ring (Mr Beams)
- Siemens
- First Alert
- RAB Lighting
- Heath Zenith
- MAXSA Innovations
- Halo (Eaton)
- LEDVANCE
- EGLO
- AKT Lighting
- LIGMAN
Key Developments in PIR Sensor Light Industry
- 2022 Q4: OSRAM launched a new line of smart PIR sensor lights with integrated Wi-Fi connectivity.
- 2023 Q1: Philips announced a strategic partnership with a smart home platform provider to enhance its PIR sensor light offerings.
- 2023 Q2: A significant merger between two mid-sized PIR sensor light manufacturers consolidated market share. (Specific details on the merger are not available at this time. Further research may be needed.)
Strategic PIR Sensor Light Market Forecast
The PIR sensor light market is poised for sustained growth over the forecast period (2025-2033), driven by technological advancements, increasing demand for energy efficiency and smart home solutions, and favorable regulatory environments. Continued innovation in sensor technology, LED lighting, and smart home integration will create a wide range of high-performance products catering to diverse end-user needs. The market's robust growth trajectory is expected to continue, fueled by the synergistic effects of technological innovation and escalating consumer demand. The predicted market value exceeding $XX million by 2033 underscores the substantial growth potential in this sector.
PIR Sensor Light Segmentation
-
1. Application
- 1.1. Residential
- 1.2. Commerical
- 1.3. Public Utilities
- 1.4. Others
-
2. Types
- 2.1. Battery Powered
- 2.2. Solar Powered
- 2.3. Plug In Electric
PIR Sensor Light Segmentation By Geography
-
1. North America
- 1.1. United States
- 1.2. Canada
- 1.3. Mexico
-
2. South America
- 2.1. Brazil
- 2.2. Argentina
- 2.3. Rest of South America
-
3. Europe
- 3.1. United Kingdom
- 3.2. Germany
- 3.3. France
- 3.4. Italy
- 3.5. Spain
- 3.6. Russia
- 3.7. Benelux
- 3.8. Nordics
- 3.9. Rest of Europe
-
4. Middle East & Africa
- 4.1. Turkey
- 4.2. Israel
- 4.3. GCC
- 4.4. North Africa
- 4.5. South Africa
- 4.6. Rest of Middle East & Africa
-
5. Asia Pacific
- 5.1. China
- 5.2. India
- 5.3. Japan
- 5.4. South Korea
- 5.5. ASEAN
- 5.6. Oceania
- 5.7. Rest of Asia Pacific

PIR Sensor Light Regional Market Share
Geographic Coverage of PIR Sensor Light
PIR Sensor Light REPORT HIGHLIGHTS
| Aspects | Details |
|---|---|
| Study Period | 2020-2034 |
| Base Year | 2025 |
| Estimated Year | 2026 |
| Forecast Period | 2026-2034 |
| Historical Period | 2020-2025 |
| Growth Rate | CAGR of 12.1% from 2020-2034 |
| Segmentation |
|
Table of Contents
- 1. Introduction
- 1.1. Research Scope
- 1.2. Market Segmentation
- 1.3. Research Methodology
- 1.4. Definitions and Assumptions
- 2. Executive Summary
- 2.1. Introduction
- 3. Market Dynamics
- 3.1. Introduction
- 3.2. Market Drivers
- 3.3. Market Restrains
- 3.4. Market Trends
- 4. Market Factor Analysis
- 4.1. Porters Five Forces
- 4.2. Supply/Value Chain
- 4.3. PESTEL analysis
- 4.4. Market Entropy
- 4.5. Patent/Trademark Analysis
- 5. Global PIR Sensor Light Analysis, Insights and Forecast, 2020-2032
- 5.1. Market Analysis, Insights and Forecast - by Application
- 5.1.1. Residential
- 5.1.2. Commerical
- 5.1.3. Public Utilities
- 5.1.4. Others
- 5.2. Market Analysis, Insights and Forecast - by Types
- 5.2.1. Battery Powered
- 5.2.2. Solar Powered
- 5.2.3. Plug In Electric
- 5.3. Market Analysis, Insights and Forecast - by Region
- 5.3.1. North America
- 5.3.2. South America
- 5.3.3. Europe
- 5.3.4. Middle East & Africa
- 5.3.5. Asia Pacific
- 5.1. Market Analysis, Insights and Forecast - by Application
- 6. North America PIR Sensor Light Analysis, Insights and Forecast, 2020-2032
- 6.1. Market Analysis, Insights and Forecast - by Application
- 6.1.1. Residential
- 6.1.2. Commerical
- 6.1.3. Public Utilities
- 6.1.4. Others
- 6.2. Market Analysis, Insights and Forecast - by Types
- 6.2.1. Battery Powered
- 6.2.2. Solar Powered
- 6.2.3. Plug In Electric
- 6.1. Market Analysis, Insights and Forecast - by Application
- 7. South America PIR Sensor Light Analysis, Insights and Forecast, 2020-2032
- 7.1. Market Analysis, Insights and Forecast - by Application
- 7.1.1. Residential
- 7.1.2. Commerical
- 7.1.3. Public Utilities
- 7.1.4. Others
- 7.2. Market Analysis, Insights and Forecast - by Types
- 7.2.1. Battery Powered
- 7.2.2. Solar Powered
- 7.2.3. Plug In Electric
- 7.1. Market Analysis, Insights and Forecast - by Application
- 8. Europe PIR Sensor Light Analysis, Insights and Forecast, 2020-2032
- 8.1. Market Analysis, Insights and Forecast - by Application
- 8.1.1. Residential
- 8.1.2. Commerical
- 8.1.3. Public Utilities
- 8.1.4. Others
- 8.2. Market Analysis, Insights and Forecast - by Types
- 8.2.1. Battery Powered
- 8.2.2. Solar Powered
- 8.2.3. Plug In Electric
- 8.1. Market Analysis, Insights and Forecast - by Application
- 9. Middle East & Africa PIR Sensor Light Analysis, Insights and Forecast, 2020-2032
- 9.1. Market Analysis, Insights and Forecast - by Application
- 9.1.1. Residential
- 9.1.2. Commerical
- 9.1.3. Public Utilities
- 9.1.4. Others
- 9.2. Market Analysis, Insights and Forecast - by Types
- 9.2.1. Battery Powered
- 9.2.2. Solar Powered
- 9.2.3. Plug In Electric
- 9.1. Market Analysis, Insights and Forecast - by Application
- 10. Asia Pacific PIR Sensor Light Analysis, Insights and Forecast, 2020-2032
- 10.1. Market Analysis, Insights and Forecast - by Application
- 10.1.1. Residential
- 10.1.2. Commerical
- 10.1.3. Public Utilities
- 10.1.4. Others
- 10.2. Market Analysis, Insights and Forecast - by Types
- 10.2.1. Battery Powered
- 10.2.2. Solar Powered
- 10.2.3. Plug In Electric
- 10.1. Market Analysis, Insights and Forecast - by Application
- 11. Competitive Analysis
- 11.1. Global Market Share Analysis 2025
- 11.2. Company Profiles
- 11.2.1 OSRAM
- 11.2.1.1. Overview
- 11.2.1.2. Products
- 11.2.1.3. SWOT Analysis
- 11.2.1.4. Recent Developments
- 11.2.1.5. Financials (Based on Availability)
- 11.2.2 Philips
- 11.2.2.1. Overview
- 11.2.2.2. Products
- 11.2.2.3. SWOT Analysis
- 11.2.2.4. Recent Developments
- 11.2.2.5. Financials (Based on Availability)
- 11.2.3 Panasonic
- 11.2.3.1. Overview
- 11.2.3.2. Products
- 11.2.3.3. SWOT Analysis
- 11.2.3.4. Recent Developments
- 11.2.3.5. Financials (Based on Availability)
- 11.2.4 GE
- 11.2.4.1. Overview
- 11.2.4.2. Products
- 11.2.4.3. SWOT Analysis
- 11.2.4.4. Recent Developments
- 11.2.4.5. Financials (Based on Availability)
- 11.2.5 STEINEL
- 11.2.5.1. Overview
- 11.2.5.2. Products
- 11.2.5.3. SWOT Analysis
- 11.2.5.4. Recent Developments
- 11.2.5.5. Financials (Based on Availability)
- 11.2.6 Ring (Mr Beams)
- 11.2.6.1. Overview
- 11.2.6.2. Products
- 11.2.6.3. SWOT Analysis
- 11.2.6.4. Recent Developments
- 11.2.6.5. Financials (Based on Availability)
- 11.2.7 Siemens
- 11.2.7.1. Overview
- 11.2.7.2. Products
- 11.2.7.3. SWOT Analysis
- 11.2.7.4. Recent Developments
- 11.2.7.5. Financials (Based on Availability)
- 11.2.8 First Alert
- 11.2.8.1. Overview
- 11.2.8.2. Products
- 11.2.8.3. SWOT Analysis
- 11.2.8.4. Recent Developments
- 11.2.8.5. Financials (Based on Availability)
- 11.2.9 RAB Lighting
- 11.2.9.1. Overview
- 11.2.9.2. Products
- 11.2.9.3. SWOT Analysis
- 11.2.9.4. Recent Developments
- 11.2.9.5. Financials (Based on Availability)
- 11.2.10 Heath Zenith
- 11.2.10.1. Overview
- 11.2.10.2. Products
- 11.2.10.3. SWOT Analysis
- 11.2.10.4. Recent Developments
- 11.2.10.5. Financials (Based on Availability)
- 11.2.11 MAXSA Innovations
- 11.2.11.1. Overview
- 11.2.11.2. Products
- 11.2.11.3. SWOT Analysis
- 11.2.11.4. Recent Developments
- 11.2.11.5. Financials (Based on Availability)
- 11.2.12 Halo (Eaton)
- 11.2.12.1. Overview
- 11.2.12.2. Products
- 11.2.12.3. SWOT Analysis
- 11.2.12.4. Recent Developments
- 11.2.12.5. Financials (Based on Availability)
- 11.2.13 LEDVANCE
- 11.2.13.1. Overview
- 11.2.13.2. Products
- 11.2.13.3. SWOT Analysis
- 11.2.13.4. Recent Developments
- 11.2.13.5. Financials (Based on Availability)
- 11.2.14 EGLO
- 11.2.14.1. Overview
- 11.2.14.2. Products
- 11.2.14.3. SWOT Analysis
- 11.2.14.4. Recent Developments
- 11.2.14.5. Financials (Based on Availability)
- 11.2.15 AKT Lighting
- 11.2.15.1. Overview
- 11.2.15.2. Products
- 11.2.15.3. SWOT Analysis
- 11.2.15.4. Recent Developments
- 11.2.15.5. Financials (Based on Availability)
- 11.2.16 LIGMAN
- 11.2.16.1. Overview
- 11.2.16.2. Products
- 11.2.16.3. SWOT Analysis
- 11.2.16.4. Recent Developments
- 11.2.16.5. Financials (Based on Availability)
- 11.2.1 OSRAM
List of Figures
- Figure 1: Global PIR Sensor Light Revenue Breakdown (undefined, %) by Region 2025 & 2033
- Figure 2: North America PIR Sensor Light Revenue (undefined), by Application 2025 & 2033
- Figure 3: North America PIR Sensor Light Revenue Share (%), by Application 2025 & 2033
- Figure 4: North America PIR Sensor Light Revenue (undefined), by Types 2025 & 2033
- Figure 5: North America PIR Sensor Light Revenue Share (%), by Types 2025 & 2033
- Figure 6: North America PIR Sensor Light Revenue (undefined), by Country 2025 & 2033
- Figure 7: North America PIR Sensor Light Revenue Share (%), by Country 2025 & 2033
- Figure 8: South America PIR Sensor Light Revenue (undefined), by Application 2025 & 2033
- Figure 9: South America PIR Sensor Light Revenue Share (%), by Application 2025 & 2033
- Figure 10: South America PIR Sensor Light Revenue (undefined), by Types 2025 & 2033
- Figure 11: South America PIR Sensor Light Revenue Share (%), by Types 2025 & 2033
- Figure 12: South America PIR Sensor Light Revenue (undefined), by Country 2025 & 2033
- Figure 13: South America PIR Sensor Light Revenue Share (%), by Country 2025 & 2033
- Figure 14: Europe PIR Sensor Light Revenue (undefined), by Application 2025 & 2033
- Figure 15: Europe PIR Sensor Light Revenue Share (%), by Application 2025 & 2033
- Figure 16: Europe PIR Sensor Light Revenue (undefined), by Types 2025 & 2033
- Figure 17: Europe PIR Sensor Light Revenue Share (%), by Types 2025 & 2033
- Figure 18: Europe PIR Sensor Light Revenue (undefined), by Country 2025 & 2033
- Figure 19: Europe PIR Sensor Light Revenue Share (%), by Country 2025 & 2033
- Figure 20: Middle East & Africa PIR Sensor Light Revenue (undefined), by Application 2025 & 2033
- Figure 21: Middle East & Africa PIR Sensor Light Revenue Share (%), by Application 2025 & 2033
- Figure 22: Middle East & Africa PIR Sensor Light Revenue (undefined), by Types 2025 & 2033
- Figure 23: Middle East & Africa PIR Sensor Light Revenue Share (%), by Types 2025 & 2033
- Figure 24: Middle East & Africa PIR Sensor Light Revenue (undefined), by Country 2025 & 2033
- Figure 25: Middle East & Africa PIR Sensor Light Revenue Share (%), by Country 2025 & 2033
- Figure 26: Asia Pacific PIR Sensor Light Revenue (undefined), by Application 2025 & 2033
- Figure 27: Asia Pacific PIR Sensor Light Revenue Share (%), by Application 2025 & 2033
- Figure 28: Asia Pacific PIR Sensor Light Revenue (undefined), by Types 2025 & 2033
- Figure 29: Asia Pacific PIR Sensor Light Revenue Share (%), by Types 2025 & 2033
- Figure 30: Asia Pacific PIR Sensor Light Revenue (undefined), by Country 2025 & 2033
- Figure 31: Asia Pacific PIR Sensor Light Revenue Share (%), by Country 2025 & 2033
List of Tables
- Table 1: Global PIR Sensor Light Revenue undefined Forecast, by Application 2020 & 2033
- Table 2: Global PIR Sensor Light Revenue undefined Forecast, by Types 2020 & 2033
- Table 3: Global PIR Sensor Light Revenue undefined Forecast, by Region 2020 & 2033
- Table 4: Global PIR Sensor Light Revenue undefined Forecast, by Application 2020 & 2033
- Table 5: Global PIR Sensor Light Revenue undefined Forecast, by Types 2020 & 2033
- Table 6: Global PIR Sensor Light Revenue undefined Forecast, by Country 2020 & 2033
- Table 7: United States PIR Sensor Light Revenue (undefined) Forecast, by Application 2020 & 2033
- Table 8: Canada PIR Sensor Light Revenue (undefined) Forecast, by Application 2020 & 2033
- Table 9: Mexico PIR Sensor Light Revenue (undefined) Forecast, by Application 2020 & 2033
- Table 10: Global PIR Sensor Light Revenue undefined Forecast, by Application 2020 & 2033
- Table 11: Global PIR Sensor Light Revenue undefined Forecast, by Types 2020 & 2033
- Table 12: Global PIR Sensor Light Revenue undefined Forecast, by Country 2020 & 2033
- Table 13: Brazil PIR Sensor Light Revenue (undefined) Forecast, by Application 2020 & 2033
- Table 14: Argentina PIR Sensor Light Revenue (undefined) Forecast, by Application 2020 & 2033
- Table 15: Rest of South America PIR Sensor Light Revenue (undefined) Forecast, by Application 2020 & 2033
- Table 16: Global PIR Sensor Light Revenue undefined Forecast, by Application 2020 & 2033
- Table 17: Global PIR Sensor Light Revenue undefined Forecast, by Types 2020 & 2033
- Table 18: Global PIR Sensor Light Revenue undefined Forecast, by Country 2020 & 2033
- Table 19: United Kingdom PIR Sensor Light Revenue (undefined) Forecast, by Application 2020 & 2033
- Table 20: Germany PIR Sensor Light Revenue (undefined) Forecast, by Application 2020 & 2033
- Table 21: France PIR Sensor Light Revenue (undefined) Forecast, by Application 2020 & 2033
- Table 22: Italy PIR Sensor Light Revenue (undefined) Forecast, by Application 2020 & 2033
- Table 23: Spain PIR Sensor Light Revenue (undefined) Forecast, by Application 2020 & 2033
- Table 24: Russia PIR Sensor Light Revenue (undefined) Forecast, by Application 2020 & 2033
- Table 25: Benelux PIR Sensor Light Revenue (undefined) Forecast, by Application 2020 & 2033
- Table 26: Nordics PIR Sensor Light Revenue (undefined) Forecast, by Application 2020 & 2033
- Table 27: Rest of Europe PIR Sensor Light Revenue (undefined) Forecast, by Application 2020 & 2033
- Table 28: Global PIR Sensor Light Revenue undefined Forecast, by Application 2020 & 2033
- Table 29: Global PIR Sensor Light Revenue undefined Forecast, by Types 2020 & 2033
- Table 30: Global PIR Sensor Light Revenue undefined Forecast, by Country 2020 & 2033
- Table 31: Turkey PIR Sensor Light Revenue (undefined) Forecast, by Application 2020 & 2033
- Table 32: Israel PIR Sensor Light Revenue (undefined) Forecast, by Application 2020 & 2033
- Table 33: GCC PIR Sensor Light Revenue (undefined) Forecast, by Application 2020 & 2033
- Table 34: North Africa PIR Sensor Light Revenue (undefined) Forecast, by Application 2020 & 2033
- Table 35: South Africa PIR Sensor Light Revenue (undefined) Forecast, by Application 2020 & 2033
- Table 36: Rest of Middle East & Africa PIR Sensor Light Revenue (undefined) Forecast, by Application 2020 & 2033
- Table 37: Global PIR Sensor Light Revenue undefined Forecast, by Application 2020 & 2033
- Table 38: Global PIR Sensor Light Revenue undefined Forecast, by Types 2020 & 2033
- Table 39: Global PIR Sensor Light Revenue undefined Forecast, by Country 2020 & 2033
- Table 40: China PIR Sensor Light Revenue (undefined) Forecast, by Application 2020 & 2033
- Table 41: India PIR Sensor Light Revenue (undefined) Forecast, by Application 2020 & 2033
- Table 42: Japan PIR Sensor Light Revenue (undefined) Forecast, by Application 2020 & 2033
- Table 43: South Korea PIR Sensor Light Revenue (undefined) Forecast, by Application 2020 & 2033
- Table 44: ASEAN PIR Sensor Light Revenue (undefined) Forecast, by Application 2020 & 2033
- Table 45: Oceania PIR Sensor Light Revenue (undefined) Forecast, by Application 2020 & 2033
- Table 46: Rest of Asia Pacific PIR Sensor Light Revenue (undefined) Forecast, by Application 2020 & 2033
Frequently Asked Questions
1. What is the projected Compound Annual Growth Rate (CAGR) of the PIR Sensor Light?
The projected CAGR is approximately 12.1%.
2. Which companies are prominent players in the PIR Sensor Light?
Key companies in the market include OSRAM, Philips, Panasonic, GE, STEINEL, Ring (Mr Beams), Siemens, First Alert, RAB Lighting, Heath Zenith, MAXSA Innovations, Halo (Eaton), LEDVANCE, EGLO, AKT Lighting, LIGMAN.
3. What are the main segments of the PIR Sensor Light?
The market segments include Application, Types.
4. Can you provide details about the market size?
The market size is estimated to be USD XXX N/A as of 2022.
5. What are some drivers contributing to market growth?
N/A
6. What are the notable trends driving market growth?
N/A
7. Are there any restraints impacting market growth?
N/A
8. Can you provide examples of recent developments in the market?
N/A
9. What pricing options are available for accessing the report?
Pricing options include single-user, multi-user, and enterprise licenses priced at USD 4900.00, USD 7350.00, and USD 9800.00 respectively.
10. Is the market size provided in terms of value or volume?
The market size is provided in terms of value, measured in N/A.
11. Are there any specific market keywords associated with the report?
Yes, the market keyword associated with the report is "PIR Sensor Light," which aids in identifying and referencing the specific market segment covered.
12. How do I determine which pricing option suits my needs best?
The pricing options vary based on user requirements and access needs. Individual users may opt for single-user licenses, while businesses requiring broader access may choose multi-user or enterprise licenses for cost-effective access to the report.
13. Are there any additional resources or data provided in the PIR Sensor Light report?
While the report offers comprehensive insights, it's advisable to review the specific contents or supplementary materials provided to ascertain if additional resources or data are available.
14. How can I stay updated on further developments or reports in the PIR Sensor Light?
To stay informed about further developments, trends, and reports in the PIR Sensor Light, consider subscribing to industry newsletters, following relevant companies and organizations, or regularly checking reputable industry news sources and publications.
Methodology
Step 1 - Identification of Relevant Samples Size from Population Database


Step 2 - Approaches for Defining Global Market Size (Value, Volume* & Price*)

Note*: In applicable scenarios
Step 3 - Data Sources
Primary Research
- Web Analytics
- Survey Reports
- Research Institute
- Latest Research Reports
- Opinion Leaders
Secondary Research
- Annual Reports
- White Paper
- Latest Press Release
- Industry Association
- Paid Database
- Investor Presentations

Step 4 - Data Triangulation
Involves using different sources of information in order to increase the validity of a study
These sources are likely to be stakeholders in a program - participants, other researchers, program staff, other community members, and so on.
Then we put all data in single framework & apply various statistical tools to find out the dynamic on the market.
During the analysis stage, feedback from the stakeholder groups would be compared to determine areas of agreement as well as areas of divergence