

Key Insights
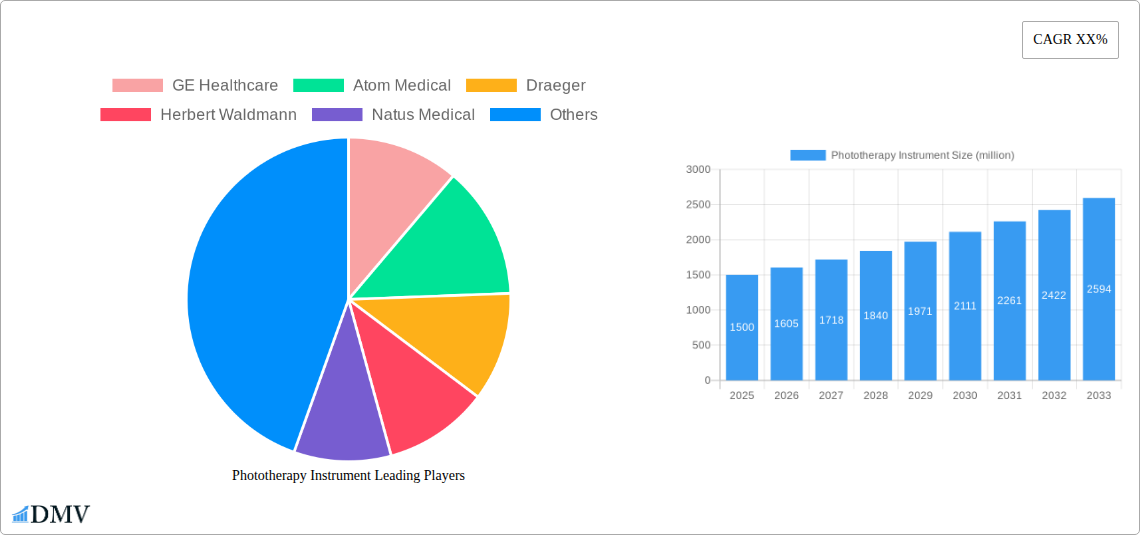
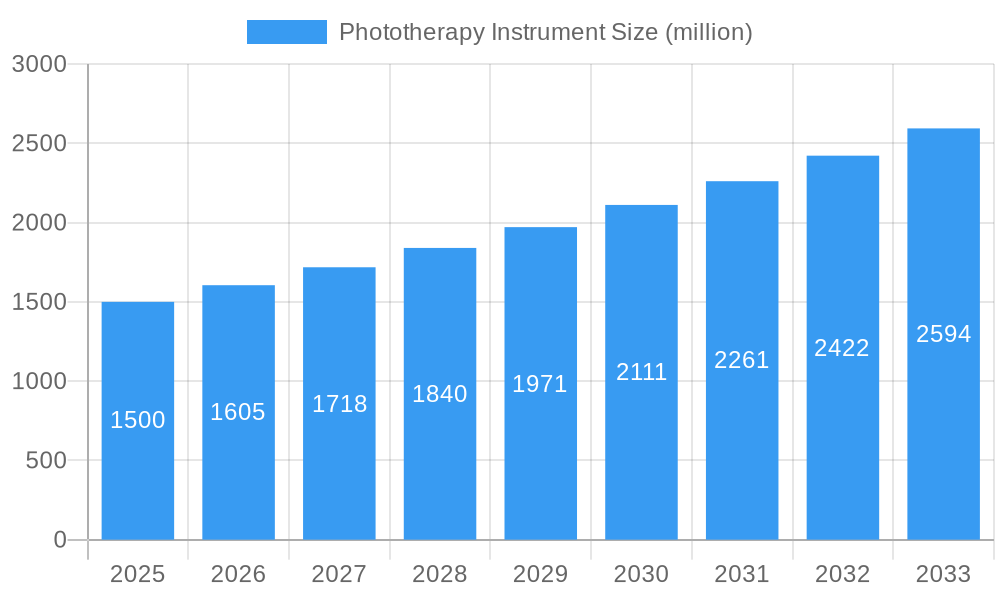
The global phototherapy instrument market is experiencing robust growth, driven by the increasing prevalence of jaundice in newborns, rising awareness of skin disorders treatable with phototherapy, and technological advancements leading to more efficient and portable devices. The market, estimated at $1.5 billion in 2025, is projected to exhibit a compound annual growth rate (CAGR) of 7% from 2025 to 2033, reaching approximately $2.7 billion by 2033. This growth is fueled by several key factors. Firstly, the expanding geriatric population, susceptible to skin conditions like psoriasis and vitiligo, significantly boosts demand. Secondly, the development of LED-based phototherapy units offers advantages in terms of energy efficiency, cost-effectiveness, and reduced treatment time, driving market adoption. Finally, ongoing research and development efforts are focused on improving the efficacy and safety of phototherapy, further contributing to market expansion. Key players such as GE Healthcare, Atom Medical, and Draeger are leveraging these trends through product innovation and strategic partnerships to gain a competitive edge. However, high initial investment costs associated with advanced phototherapy systems and the availability of alternative treatment options could pose some challenges to market growth.
Phototherapy Instrument Market Size (In Billion)
Despite these challenges, the market presents significant opportunities, particularly in emerging economies where access to advanced healthcare technologies is gradually improving. The market is segmented by product type (e.g., bilirubinometers, LED phototherapy units, fluorescent lamps), application (neonatal jaundice, psoriasis, vitiligo), and end-user (hospitals, clinics, homecare settings). Growth in the homecare setting is particularly noteworthy, reflecting a trend towards convenient and accessible treatment options. Strategic acquisitions, collaborations, and a focus on developing user-friendly and affordable devices will be crucial for companies aiming to capitalize on the market's substantial growth potential. The continued focus on improving device portability and ease of use will further facilitate broader market penetration, especially in underserved regions.
Phototherapy Instrument Company Market Share
Phototherapy Instrument Market Report: A Comprehensive Analysis (2019-2033)
This insightful report provides a detailed analysis of the global phototherapy instrument market, projecting a market value exceeding $XX million by 2033. The study covers the period from 2019 to 2033, with 2025 serving as both the base and estimated year. This comprehensive analysis delves into market composition, technological advancements, regional dominance, key players, and future growth opportunities. It is an indispensable resource for stakeholders, investors, and industry professionals seeking a thorough understanding of this dynamic market.
Phototherapy Instrument Market Composition & Trends
The global phototherapy instrument market, valued at $XX million in 2025, exhibits a moderately consolidated structure. Key players, including GE Healthcare, Atom Medical, and Draeger, hold significant market share, although the presence of numerous smaller companies indicates a competitive landscape. Market share distribution among the top five players is estimated at approximately XX%, reflecting the presence of both established and emerging businesses. Innovation is a crucial driver, fueled by advancements in LED technology, improved treatment efficacy, and the development of portable and user-friendly devices. The regulatory landscape varies across regions, impacting market access and product approvals. Substitute products, such as topical treatments, exist but often lack the efficacy and speed of phototherapy. The primary end-users are hospitals, clinics, and dermatology practices, with increasing adoption in home healthcare settings. Mergers and acquisitions (M&A) activity in the past five years has been moderate, with total deal values estimated at $XX million, primarily focused on expanding product portfolios and geographical reach.
- Market Concentration: Moderately consolidated, with top five players holding approximately XX% market share.
- Innovation Catalysts: Advancements in LED technology, improved treatment efficacy, and portability.
- Regulatory Landscape: Varies across regions, impacting market access.
- Substitute Products: Topical treatments, but often less effective.
- End-User Profile: Hospitals, clinics, dermatology practices, and home healthcare.
- M&A Activity (2019-2024): Estimated total deal value of $XX million.
Phototherapy Instrument Industry Evolution
The phototherapy instrument market has witnessed significant growth over the historical period (2019-2024), with a Compound Annual Growth Rate (CAGR) of approximately XX%. This growth is primarily attributed to increasing prevalence of skin disorders, rising awareness of phototherapy benefits, technological advancements leading to improved treatment outcomes, and expansion into new geographical markets. Technological advancements have focused on enhancing the efficacy and safety of treatment, reducing treatment times, and improving portability. Consumer demands are shifting towards more convenient, user-friendly, and cost-effective devices, pushing manufacturers to innovate and meet these needs. The adoption rate of phototherapy instruments, particularly in developing economies, is expected to increase significantly in the forecast period (2025-2033), driven by growing healthcare infrastructure and increased physician awareness.
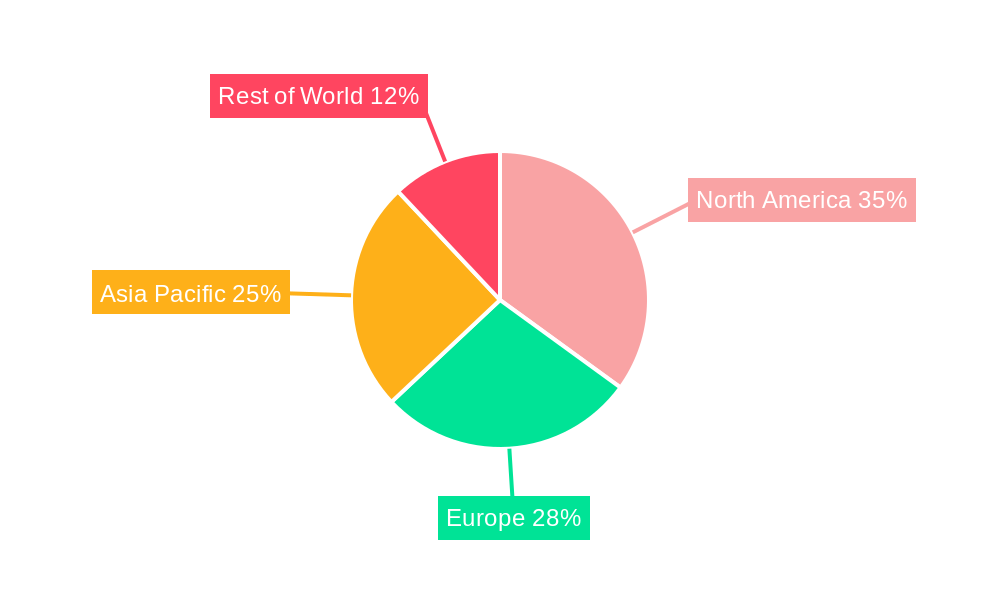
Leading Regions, Countries, or Segments in Phototherapy Instrument
North America currently dominates the global phototherapy instrument market, accounting for approximately XX% of the total revenue in 2025. This dominance is attributed to several factors:
- High Prevalence of Skin Disorders: A significant population base with a high incidence of conditions treatable with phototherapy.
- Advanced Healthcare Infrastructure: Well-established healthcare systems with readily available access to advanced medical technologies.
- High Healthcare Expenditure: Substantial investment in healthcare infrastructure and technology.
- Stringent Regulatory Environment: Encouraging innovation and ensuring product safety and efficacy.
- Strong Market Presence of Key Players: Significant presence and market penetration of leading phototherapy instrument manufacturers.
European countries also hold a substantial market share, driven by similar factors, albeit with some regional variations in healthcare spending and regulatory frameworks. The Asia-Pacific region is anticipated to show significant growth in the forecast period, driven by rising disposable income, increasing healthcare awareness, and a growing middle class.
Phototherapy Instrument Product Innovations
Recent innovations in phototherapy instruments include the development of more compact and portable devices, improved LED technology offering higher irradiance and spectral purity, and the integration of advanced features such as real-time monitoring and treatment optimization. These innovations improve treatment efficacy, reduce treatment times, and enhance patient comfort, contributing to wider adoption and improved treatment outcomes. Unique selling propositions often focus on ease of use, portability, enhanced safety features, and superior treatment results.
Propelling Factors for Phototherapy Instrument Growth
The growth of the phototherapy instrument market is driven by several key factors: The rising prevalence of skin disorders like psoriasis and vitiligo fuels demand for effective treatment options. Advancements in LED technology offer superior treatment efficacy and patient comfort. Government initiatives and increased awareness campaigns are promoting phototherapy as a safe and effective treatment modality. Furthermore, favorable reimbursement policies in several countries are making phototherapy more accessible and affordable.
Obstacles in the Phototherapy Instrument Market
Challenges in the market include high initial investment costs for advanced instruments, potential side effects associated with phototherapy requiring careful monitoring, and stringent regulatory approvals. Supply chain disruptions, particularly in the procurement of essential components, can impact production and market availability. Competition from established players and new entrants adds further pressure.
Future Opportunities in Phototherapy Instrument
Future opportunities lie in the development of personalized phototherapy treatments, integration with telehealth platforms, and expansion into emerging markets. The application of artificial intelligence (AI) for treatment optimization and patient monitoring presents a promising avenue. Additionally, exploring new therapeutic applications beyond skin disorders holds significant potential.
Major Players in the Phototherapy Instrument Ecosystem
- GE Healthcare
- Atom Medical
- Draeger
- Herbert Waldmann
- Natus Medical
- Daavlin
- Beurer
- National Biological
- DAVID
- MTTS Asia
- Nice Neotech
- SIGMA
- Kernel
- Wuhan Bojian Electronic
Key Developments in Phototherapy Instrument Industry
- January 2023: GE Healthcare launched a new generation of phototherapy instrument featuring improved LED technology.
- June 2022: Atom Medical announced a strategic partnership to expand its distribution network in Asia.
- November 2021: Draeger received regulatory approval for its new phototherapy device in the European Union. (Further developments to be added based on available data)
Strategic Phototherapy Instrument Market Forecast
The phototherapy instrument market is poised for robust growth in the forecast period (2025-2033), driven by technological advancements, increasing prevalence of skin disorders, and expanding applications. The market is expected to benefit from the integration of advanced technologies, rising healthcare expenditure, and growing awareness of phototherapy's benefits. The entry of new players and strategic collaborations will further contribute to market expansion, resulting in substantial growth potential.
Phototherapy Instrument Segmentation
-
1. Application
- 1.1. Hospital
- 1.2. Clinic
- 1.3. Household
-
2. Types
- 2.1. LED Type
- 2.2. Fiber Type
- 2.3. Other
Phototherapy Instrument Segmentation By Geography
-
1. North America
- 1.1. United States
- 1.2. Canada
- 1.3. Mexico
-
2. South America
- 2.1. Brazil
- 2.2. Argentina
- 2.3. Rest of South America
-
3. Europe
- 3.1. United Kingdom
- 3.2. Germany
- 3.3. France
- 3.4. Italy
- 3.5. Spain
- 3.6. Russia
- 3.7. Benelux
- 3.8. Nordics
- 3.9. Rest of Europe
-
4. Middle East & Africa
- 4.1. Turkey
- 4.2. Israel
- 4.3. GCC
- 4.4. North Africa
- 4.5. South Africa
- 4.6. Rest of Middle East & Africa
-
5. Asia Pacific
- 5.1. China
- 5.2. India
- 5.3. Japan
- 5.4. South Korea
- 5.5. ASEAN
- 5.6. Oceania
- 5.7. Rest of Asia Pacific
Phototherapy Instrument Regional Market Share
Geographic Coverage of Phototherapy Instrument
Phototherapy Instrument REPORT HIGHLIGHTS
| Aspects | Details |
|---|---|
| Study Period | 2020-2034 |
| Base Year | 2025 |
| Estimated Year | 2026 |
| Forecast Period | 2026-2034 |
| Historical Period | 2020-2025 |
| Growth Rate | CAGR of XX% from 2020-2034 |
| Segmentation |
|
Table of Contents
- 1. Introduction
- 1.1. Research Scope
- 1.2. Market Segmentation
- 1.3. Research Objective
- 1.4. Definitions and Assumptions
- 2. Executive Summary
- 2.1. Market Snapshot
- 3. Market Dynamics
- 3.1. Market Drivers
- 3.2. Market Restrains
- 3.3. Market Trends
- 3.4. Market Opportunities
- 4. Market Factor Analysis
- 4.1. Porters Five Forces
- 4.1.1. Bargaining Power of Suppliers
- 4.1.2. Bargaining Power of Buyers
- 4.1.3. Threat of New Entrants
- 4.1.4. Threat of Substitutes
- 4.1.5. Competitive Rivalry
- 4.2. PESTEL analysis
- 4.3. BCG Analysis
- 4.3.1. Stars (High Growth, High Market Share)
- 4.3.2. Cash Cows (Low Growth, High Market Share)
- 4.3.3. Question Mark (High Growth, Low Market Share)
- 4.3.4. Dogs (Low Growth, Low Market Share)
- 4.4. Ansoff Matrix Analysis
- 4.5. Supply Chain Analysis
- 4.6. Regulatory Landscape
- 4.7. Current Market Potential and Opportunity Assessment (TAM–SAM–SOM Framework)
- 4.8. DMV Analyst Note
- 4.1. Porters Five Forces
- 5. Market Analysis, Insights and Forecast 2021-2033
- 5.1. Market Analysis, Insights and Forecast - by Application
- 5.1.1. Hospital
- 5.1.2. Clinic
- 5.1.3. Household
- 5.2. Market Analysis, Insights and Forecast - by Types
- 5.2.1. LED Type
- 5.2.2. Fiber Type
- 5.2.3. Other
- 5.3. Market Analysis, Insights and Forecast - by Region
- 5.3.1. North America
- 5.3.2. South America
- 5.3.3. Europe
- 5.3.4. Middle East & Africa
- 5.3.5. Asia Pacific
- 5.1. Market Analysis, Insights and Forecast - by Application
- 6. Global Phototherapy Instrument Analysis, Insights and Forecast, 2021-2033
- 6.1. Market Analysis, Insights and Forecast - by Application
- 6.1.1. Hospital
- 6.1.2. Clinic
- 6.1.3. Household
- 6.2. Market Analysis, Insights and Forecast - by Types
- 6.2.1. LED Type
- 6.2.2. Fiber Type
- 6.2.3. Other
- 6.1. Market Analysis, Insights and Forecast - by Application
- 7. North America Phototherapy Instrument Analysis, Insights and Forecast, 2020-2032
- 7.1. Market Analysis, Insights and Forecast - by Application
- 7.1.1. Hospital
- 7.1.2. Clinic
- 7.1.3. Household
- 7.2. Market Analysis, Insights and Forecast - by Types
- 7.2.1. LED Type
- 7.2.2. Fiber Type
- 7.2.3. Other
- 7.1. Market Analysis, Insights and Forecast - by Application
- 8. South America Phototherapy Instrument Analysis, Insights and Forecast, 2020-2032
- 8.1. Market Analysis, Insights and Forecast - by Application
- 8.1.1. Hospital
- 8.1.2. Clinic
- 8.1.3. Household
- 8.2. Market Analysis, Insights and Forecast - by Types
- 8.2.1. LED Type
- 8.2.2. Fiber Type
- 8.2.3. Other
- 8.1. Market Analysis, Insights and Forecast - by Application
- 9. Europe Phototherapy Instrument Analysis, Insights and Forecast, 2020-2032
- 9.1. Market Analysis, Insights and Forecast - by Application
- 9.1.1. Hospital
- 9.1.2. Clinic
- 9.1.3. Household
- 9.2. Market Analysis, Insights and Forecast - by Types
- 9.2.1. LED Type
- 9.2.2. Fiber Type
- 9.2.3. Other
- 9.1. Market Analysis, Insights and Forecast - by Application
- 10. Middle East & Africa Phototherapy Instrument Analysis, Insights and Forecast, 2020-2032
- 10.1. Market Analysis, Insights and Forecast - by Application
- 10.1.1. Hospital
- 10.1.2. Clinic
- 10.1.3. Household
- 10.2. Market Analysis, Insights and Forecast - by Types
- 10.2.1. LED Type
- 10.2.2. Fiber Type
- 10.2.3. Other
- 10.1. Market Analysis, Insights and Forecast - by Application
- 11. Asia Pacific Phototherapy Instrument Analysis, Insights and Forecast, 2020-2032
- 11.1. Market Analysis, Insights and Forecast - by Application
- 11.1.1. Hospital
- 11.1.2. Clinic
- 11.1.3. Household
- 11.2. Market Analysis, Insights and Forecast - by Types
- 11.2.1. LED Type
- 11.2.2. Fiber Type
- 11.2.3. Other
- 11.1. Market Analysis, Insights and Forecast - by Application
- 12. Competitive Analysis
- 12.1. Company Profiles
- 12.1.1 GE Healthcare
- 12.1.1.1. Company Overview
- 12.1.1.2. Products
- 12.1.1.3. Company Financials
- 12.1.1.4. SWOT Analysis
- 12.1.2 Atom Medical
- 12.1.2.1. Company Overview
- 12.1.2.2. Products
- 12.1.2.3. Company Financials
- 12.1.2.4. SWOT Analysis
- 12.1.3 Draeger
- 12.1.3.1. Company Overview
- 12.1.3.2. Products
- 12.1.3.3. Company Financials
- 12.1.3.4. SWOT Analysis
- 12.1.4 Herbert Waldmann
- 12.1.4.1. Company Overview
- 12.1.4.2. Products
- 12.1.4.3. Company Financials
- 12.1.4.4. SWOT Analysis
- 12.1.5 Natus Medical
- 12.1.5.1. Company Overview
- 12.1.5.2. Products
- 12.1.5.3. Company Financials
- 12.1.5.4. SWOT Analysis
- 12.1.6 Daavlin
- 12.1.6.1. Company Overview
- 12.1.6.2. Products
- 12.1.6.3. Company Financials
- 12.1.6.4. SWOT Analysis
- 12.1.7 Beurer
- 12.1.7.1. Company Overview
- 12.1.7.2. Products
- 12.1.7.3. Company Financials
- 12.1.7.4. SWOT Analysis
- 12.1.8 National Biological
- 12.1.8.1. Company Overview
- 12.1.8.2. Products
- 12.1.8.3. Company Financials
- 12.1.8.4. SWOT Analysis
- 12.1.9 DAVID
- 12.1.9.1. Company Overview
- 12.1.9.2. Products
- 12.1.9.3. Company Financials
- 12.1.9.4. SWOT Analysis
- 12.1.10 MTTS Asia
- 12.1.10.1. Company Overview
- 12.1.10.2. Products
- 12.1.10.3. Company Financials
- 12.1.10.4. SWOT Analysis
- 12.1.11 Nice Neotech
- 12.1.11.1. Company Overview
- 12.1.11.2. Products
- 12.1.11.3. Company Financials
- 12.1.11.4. SWOT Analysis
- 12.1.12 SIGMA
- 12.1.12.1. Company Overview
- 12.1.12.2. Products
- 12.1.12.3. Company Financials
- 12.1.12.4. SWOT Analysis
- 12.1.13 Kernel
- 12.1.13.1. Company Overview
- 12.1.13.2. Products
- 12.1.13.3. Company Financials
- 12.1.13.4. SWOT Analysis
- 12.1.14 Wuhan Bojian Electronic
- 12.1.14.1. Company Overview
- 12.1.14.2. Products
- 12.1.14.3. Company Financials
- 12.1.14.4. SWOT Analysis
- 12.1.1 GE Healthcare
- 12.2. Market Entropy
- 12.2.1 Company's Key Areas Served
- 12.2.2 Recent Developments
- 12.3. Company Market Share Analysis 2025
- 12.3.1 Top 5 Companies Market Share Analysis
- 12.3.2 Top 3 Companies Market Share Analysis
- 12.4. List of Potential Customers
- 13. Research Methodology
List of Figures
- Figure 1: Global Phototherapy Instrument Revenue Breakdown (million, %) by Region 2025 & 2033
- Figure 2: Global Phototherapy Instrument Volume Breakdown (K, %) by Region 2025 & 2033
- Figure 3: North America Phototherapy Instrument Revenue (million), by Application 2025 & 2033
- Figure 4: North America Phototherapy Instrument Volume (K), by Application 2025 & 2033
- Figure 5: North America Phototherapy Instrument Revenue Share (%), by Application 2025 & 2033
- Figure 6: North America Phototherapy Instrument Volume Share (%), by Application 2025 & 2033
- Figure 7: North America Phototherapy Instrument Revenue (million), by Types 2025 & 2033
- Figure 8: North America Phototherapy Instrument Volume (K), by Types 2025 & 2033
- Figure 9: North America Phototherapy Instrument Revenue Share (%), by Types 2025 & 2033
- Figure 10: North America Phototherapy Instrument Volume Share (%), by Types 2025 & 2033
- Figure 11: North America Phototherapy Instrument Revenue (million), by Country 2025 & 2033
- Figure 12: North America Phototherapy Instrument Volume (K), by Country 2025 & 2033
- Figure 13: North America Phototherapy Instrument Revenue Share (%), by Country 2025 & 2033
- Figure 14: North America Phototherapy Instrument Volume Share (%), by Country 2025 & 2033
- Figure 15: South America Phototherapy Instrument Revenue (million), by Application 2025 & 2033
- Figure 16: South America Phototherapy Instrument Volume (K), by Application 2025 & 2033
- Figure 17: South America Phototherapy Instrument Revenue Share (%), by Application 2025 & 2033
- Figure 18: South America Phototherapy Instrument Volume Share (%), by Application 2025 & 2033
- Figure 19: South America Phototherapy Instrument Revenue (million), by Types 2025 & 2033
- Figure 20: South America Phototherapy Instrument Volume (K), by Types 2025 & 2033
- Figure 21: South America Phototherapy Instrument Revenue Share (%), by Types 2025 & 2033
- Figure 22: South America Phototherapy Instrument Volume Share (%), by Types 2025 & 2033
- Figure 23: South America Phototherapy Instrument Revenue (million), by Country 2025 & 2033
- Figure 24: South America Phototherapy Instrument Volume (K), by Country 2025 & 2033
- Figure 25: South America Phototherapy Instrument Revenue Share (%), by Country 2025 & 2033
- Figure 26: South America Phototherapy Instrument Volume Share (%), by Country 2025 & 2033
- Figure 27: Europe Phototherapy Instrument Revenue (million), by Application 2025 & 2033
- Figure 28: Europe Phototherapy Instrument Volume (K), by Application 2025 & 2033
- Figure 29: Europe Phototherapy Instrument Revenue Share (%), by Application 2025 & 2033
- Figure 30: Europe Phototherapy Instrument Volume Share (%), by Application 2025 & 2033
- Figure 31: Europe Phototherapy Instrument Revenue (million), by Types 2025 & 2033
- Figure 32: Europe Phototherapy Instrument Volume (K), by Types 2025 & 2033
- Figure 33: Europe Phototherapy Instrument Revenue Share (%), by Types 2025 & 2033
- Figure 34: Europe Phototherapy Instrument Volume Share (%), by Types 2025 & 2033
- Figure 35: Europe Phototherapy Instrument Revenue (million), by Country 2025 & 2033
- Figure 36: Europe Phototherapy Instrument Volume (K), by Country 2025 & 2033
- Figure 37: Europe Phototherapy Instrument Revenue Share (%), by Country 2025 & 2033
- Figure 38: Europe Phototherapy Instrument Volume Share (%), by Country 2025 & 2033
- Figure 39: Middle East & Africa Phototherapy Instrument Revenue (million), by Application 2025 & 2033
- Figure 40: Middle East & Africa Phototherapy Instrument Volume (K), by Application 2025 & 2033
- Figure 41: Middle East & Africa Phototherapy Instrument Revenue Share (%), by Application 2025 & 2033
- Figure 42: Middle East & Africa Phototherapy Instrument Volume Share (%), by Application 2025 & 2033
- Figure 43: Middle East & Africa Phototherapy Instrument Revenue (million), by Types 2025 & 2033
- Figure 44: Middle East & Africa Phototherapy Instrument Volume (K), by Types 2025 & 2033
- Figure 45: Middle East & Africa Phototherapy Instrument Revenue Share (%), by Types 2025 & 2033
- Figure 46: Middle East & Africa Phototherapy Instrument Volume Share (%), by Types 2025 & 2033
- Figure 47: Middle East & Africa Phototherapy Instrument Revenue (million), by Country 2025 & 2033
- Figure 48: Middle East & Africa Phototherapy Instrument Volume (K), by Country 2025 & 2033
- Figure 49: Middle East & Africa Phototherapy Instrument Revenue Share (%), by Country 2025 & 2033
- Figure 50: Middle East & Africa Phototherapy Instrument Volume Share (%), by Country 2025 & 2033
- Figure 51: Asia Pacific Phototherapy Instrument Revenue (million), by Application 2025 & 2033
- Figure 52: Asia Pacific Phototherapy Instrument Volume (K), by Application 2025 & 2033
- Figure 53: Asia Pacific Phototherapy Instrument Revenue Share (%), by Application 2025 & 2033
- Figure 54: Asia Pacific Phototherapy Instrument Volume Share (%), by Application 2025 & 2033
- Figure 55: Asia Pacific Phototherapy Instrument Revenue (million), by Types 2025 & 2033
- Figure 56: Asia Pacific Phototherapy Instrument Volume (K), by Types 2025 & 2033
- Figure 57: Asia Pacific Phototherapy Instrument Revenue Share (%), by Types 2025 & 2033
- Figure 58: Asia Pacific Phototherapy Instrument Volume Share (%), by Types 2025 & 2033
- Figure 59: Asia Pacific Phototherapy Instrument Revenue (million), by Country 2025 & 2033
- Figure 60: Asia Pacific Phototherapy Instrument Volume (K), by Country 2025 & 2033
- Figure 61: Asia Pacific Phototherapy Instrument Revenue Share (%), by Country 2025 & 2033
- Figure 62: Asia Pacific Phototherapy Instrument Volume Share (%), by Country 2025 & 2033
List of Tables
- Table 1: Global Phototherapy Instrument Revenue million Forecast, by Application 2020 & 2033
- Table 2: Global Phototherapy Instrument Volume K Forecast, by Application 2020 & 2033
- Table 3: Global Phototherapy Instrument Revenue million Forecast, by Types 2020 & 2033
- Table 4: Global Phototherapy Instrument Volume K Forecast, by Types 2020 & 2033
- Table 5: Global Phototherapy Instrument Revenue million Forecast, by Region 2020 & 2033
- Table 6: Global Phototherapy Instrument Volume K Forecast, by Region 2020 & 2033
- Table 7: Global Phototherapy Instrument Revenue million Forecast, by Application 2020 & 2033
- Table 8: Global Phototherapy Instrument Volume K Forecast, by Application 2020 & 2033
- Table 9: Global Phototherapy Instrument Revenue million Forecast, by Types 2020 & 2033
- Table 10: Global Phototherapy Instrument Volume K Forecast, by Types 2020 & 2033
- Table 11: Global Phototherapy Instrument Revenue million Forecast, by Country 2020 & 2033
- Table 12: Global Phototherapy Instrument Volume K Forecast, by Country 2020 & 2033
- Table 13: United States Phototherapy Instrument Revenue (million) Forecast, by Application 2020 & 2033
- Table 14: United States Phototherapy Instrument Volume (K) Forecast, by Application 2020 & 2033
- Table 15: Canada Phototherapy Instrument Revenue (million) Forecast, by Application 2020 & 2033
- Table 16: Canada Phototherapy Instrument Volume (K) Forecast, by Application 2020 & 2033
- Table 17: Mexico Phototherapy Instrument Revenue (million) Forecast, by Application 2020 & 2033
- Table 18: Mexico Phototherapy Instrument Volume (K) Forecast, by Application 2020 & 2033
- Table 19: Global Phototherapy Instrument Revenue million Forecast, by Application 2020 & 2033
- Table 20: Global Phototherapy Instrument Volume K Forecast, by Application 2020 & 2033
- Table 21: Global Phototherapy Instrument Revenue million Forecast, by Types 2020 & 2033
- Table 22: Global Phototherapy Instrument Volume K Forecast, by Types 2020 & 2033
- Table 23: Global Phototherapy Instrument Revenue million Forecast, by Country 2020 & 2033
- Table 24: Global Phototherapy Instrument Volume K Forecast, by Country 2020 & 2033
- Table 25: Brazil Phototherapy Instrument Revenue (million) Forecast, by Application 2020 & 2033
- Table 26: Brazil Phototherapy Instrument Volume (K) Forecast, by Application 2020 & 2033
- Table 27: Argentina Phototherapy Instrument Revenue (million) Forecast, by Application 2020 & 2033
- Table 28: Argentina Phototherapy Instrument Volume (K) Forecast, by Application 2020 & 2033
- Table 29: Rest of South America Phototherapy Instrument Revenue (million) Forecast, by Application 2020 & 2033
- Table 30: Rest of South America Phototherapy Instrument Volume (K) Forecast, by Application 2020 & 2033
- Table 31: Global Phototherapy Instrument Revenue million Forecast, by Application 2020 & 2033
- Table 32: Global Phototherapy Instrument Volume K Forecast, by Application 2020 & 2033
- Table 33: Global Phototherapy Instrument Revenue million Forecast, by Types 2020 & 2033
- Table 34: Global Phototherapy Instrument Volume K Forecast, by Types 2020 & 2033
- Table 35: Global Phototherapy Instrument Revenue million Forecast, by Country 2020 & 2033
- Table 36: Global Phototherapy Instrument Volume K Forecast, by Country 2020 & 2033
- Table 37: United Kingdom Phototherapy Instrument Revenue (million) Forecast, by Application 2020 & 2033
- Table 38: United Kingdom Phototherapy Instrument Volume (K) Forecast, by Application 2020 & 2033
- Table 39: Germany Phototherapy Instrument Revenue (million) Forecast, by Application 2020 & 2033
- Table 40: Germany Phototherapy Instrument Volume (K) Forecast, by Application 2020 & 2033
- Table 41: France Phototherapy Instrument Revenue (million) Forecast, by Application 2020 & 2033
- Table 42: France Phototherapy Instrument Volume (K) Forecast, by Application 2020 & 2033
- Table 43: Italy Phototherapy Instrument Revenue (million) Forecast, by Application 2020 & 2033
- Table 44: Italy Phototherapy Instrument Volume (K) Forecast, by Application 2020 & 2033
- Table 45: Spain Phototherapy Instrument Revenue (million) Forecast, by Application 2020 & 2033
- Table 46: Spain Phototherapy Instrument Volume (K) Forecast, by Application 2020 & 2033
- Table 47: Russia Phototherapy Instrument Revenue (million) Forecast, by Application 2020 & 2033
- Table 48: Russia Phototherapy Instrument Volume (K) Forecast, by Application 2020 & 2033
- Table 49: Benelux Phototherapy Instrument Revenue (million) Forecast, by Application 2020 & 2033
- Table 50: Benelux Phototherapy Instrument Volume (K) Forecast, by Application 2020 & 2033
- Table 51: Nordics Phototherapy Instrument Revenue (million) Forecast, by Application 2020 & 2033
- Table 52: Nordics Phototherapy Instrument Volume (K) Forecast, by Application 2020 & 2033
- Table 53: Rest of Europe Phototherapy Instrument Revenue (million) Forecast, by Application 2020 & 2033
- Table 54: Rest of Europe Phototherapy Instrument Volume (K) Forecast, by Application 2020 & 2033
- Table 55: Global Phototherapy Instrument Revenue million Forecast, by Application 2020 & 2033
- Table 56: Global Phototherapy Instrument Volume K Forecast, by Application 2020 & 2033
- Table 57: Global Phototherapy Instrument Revenue million Forecast, by Types 2020 & 2033
- Table 58: Global Phototherapy Instrument Volume K Forecast, by Types 2020 & 2033
- Table 59: Global Phototherapy Instrument Revenue million Forecast, by Country 2020 & 2033
- Table 60: Global Phototherapy Instrument Volume K Forecast, by Country 2020 & 2033
- Table 61: Turkey Phototherapy Instrument Revenue (million) Forecast, by Application 2020 & 2033
- Table 62: Turkey Phototherapy Instrument Volume (K) Forecast, by Application 2020 & 2033
- Table 63: Israel Phototherapy Instrument Revenue (million) Forecast, by Application 2020 & 2033
- Table 64: Israel Phototherapy Instrument Volume (K) Forecast, by Application 2020 & 2033
- Table 65: GCC Phototherapy Instrument Revenue (million) Forecast, by Application 2020 & 2033
- Table 66: GCC Phototherapy Instrument Volume (K) Forecast, by Application 2020 & 2033
- Table 67: North Africa Phototherapy Instrument Revenue (million) Forecast, by Application 2020 & 2033
- Table 68: North Africa Phototherapy Instrument Volume (K) Forecast, by Application 2020 & 2033
- Table 69: South Africa Phototherapy Instrument Revenue (million) Forecast, by Application 2020 & 2033
- Table 70: South Africa Phototherapy Instrument Volume (K) Forecast, by Application 2020 & 2033
- Table 71: Rest of Middle East & Africa Phototherapy Instrument Revenue (million) Forecast, by Application 2020 & 2033
- Table 72: Rest of Middle East & Africa Phototherapy Instrument Volume (K) Forecast, by Application 2020 & 2033
- Table 73: Global Phototherapy Instrument Revenue million Forecast, by Application 2020 & 2033
- Table 74: Global Phototherapy Instrument Volume K Forecast, by Application 2020 & 2033
- Table 75: Global Phototherapy Instrument Revenue million Forecast, by Types 2020 & 2033
- Table 76: Global Phototherapy Instrument Volume K Forecast, by Types 2020 & 2033
- Table 77: Global Phototherapy Instrument Revenue million Forecast, by Country 2020 & 2033
- Table 78: Global Phototherapy Instrument Volume K Forecast, by Country 2020 & 2033
- Table 79: China Phototherapy Instrument Revenue (million) Forecast, by Application 2020 & 2033
- Table 80: China Phototherapy Instrument Volume (K) Forecast, by Application 2020 & 2033
- Table 81: India Phototherapy Instrument Revenue (million) Forecast, by Application 2020 & 2033
- Table 82: India Phototherapy Instrument Volume (K) Forecast, by Application 2020 & 2033
- Table 83: Japan Phototherapy Instrument Revenue (million) Forecast, by Application 2020 & 2033
- Table 84: Japan Phototherapy Instrument Volume (K) Forecast, by Application 2020 & 2033
- Table 85: South Korea Phototherapy Instrument Revenue (million) Forecast, by Application 2020 & 2033
- Table 86: South Korea Phototherapy Instrument Volume (K) Forecast, by Application 2020 & 2033
- Table 87: ASEAN Phototherapy Instrument Revenue (million) Forecast, by Application 2020 & 2033
- Table 88: ASEAN Phototherapy Instrument Volume (K) Forecast, by Application 2020 & 2033
- Table 89: Oceania Phototherapy Instrument Revenue (million) Forecast, by Application 2020 & 2033
- Table 90: Oceania Phototherapy Instrument Volume (K) Forecast, by Application 2020 & 2033
- Table 91: Rest of Asia Pacific Phototherapy Instrument Revenue (million) Forecast, by Application 2020 & 2033
- Table 92: Rest of Asia Pacific Phototherapy Instrument Volume (K) Forecast, by Application 2020 & 2033
Frequently Asked Questions
1. What is the projected Compound Annual Growth Rate (CAGR) of the Phototherapy Instrument?
The projected CAGR is approximately XX%.
2. Which companies are prominent players in the Phototherapy Instrument?
Key companies in the market include GE Healthcare, Atom Medical, Draeger, Herbert Waldmann, Natus Medical, Daavlin, Beurer, National Biological, DAVID, MTTS Asia, Nice Neotech, SIGMA, Kernel, Wuhan Bojian Electronic.
3. What are the main segments of the Phototherapy Instrument?
The market segments include Application, Types.
4. Can you provide details about the market size?
The market size is estimated to be USD XXX million as of 2022.
5. What are some drivers contributing to market growth?
N/A
6. What are the notable trends driving market growth?
N/A
7. Are there any restraints impacting market growth?
N/A
8. Can you provide examples of recent developments in the market?
N/A
9. What pricing options are available for accessing the report?
Pricing options include single-user, multi-user, and enterprise licenses priced at USD 4350.00, USD 6525.00, and USD 8700.00 respectively.
10. Is the market size provided in terms of value or volume?
The market size is provided in terms of value, measured in million and volume, measured in K.
11. Are there any specific market keywords associated with the report?
Yes, the market keyword associated with the report is "Phototherapy Instrument," which aids in identifying and referencing the specific market segment covered.
12. How do I determine which pricing option suits my needs best?
The pricing options vary based on user requirements and access needs. Individual users may opt for single-user licenses, while businesses requiring broader access may choose multi-user or enterprise licenses for cost-effective access to the report.
13. Are there any additional resources or data provided in the Phototherapy Instrument report?
While the report offers comprehensive insights, it's advisable to review the specific contents or supplementary materials provided to ascertain if additional resources or data are available.
14. How can I stay updated on further developments or reports in the Phototherapy Instrument?
To stay informed about further developments, trends, and reports in the Phototherapy Instrument, consider subscribing to industry newsletters, following relevant companies and organizations, or regularly checking reputable industry news sources and publications.
Methodology
Step 1 - Identification of Relevant Samples Size from Population Database


Step 2 - Approaches for Defining Global Market Size (Value, Volume* & Price*)

Note*: In applicable scenarios
Step 3 - Data Sources
Primary Research
- Web Analytics
- Survey Reports
- Research Institute
- Latest Research Reports
- Opinion Leaders
Secondary Research
- Annual Reports
- White Paper
- Latest Press Release
- Industry Association
- Paid Database
- Investor Presentations

Step 4 - Data Triangulation
Involves using different sources of information in order to increase the validity of a study
These sources are likely to be stakeholders in a program - participants, other researchers, program staff, other community members, and so on.
Then we put all data in single framework & apply various statistical tools to find out the dynamic on the market.
During the analysis stage, feedback from the stakeholder groups would be compared to determine areas of agreement as well as areas of divergence