

Key Insights
The global optical fiber gyrocompass market is poised for significant expansion, driven by the escalating demand for advanced, high-precision navigation solutions across diverse industries. The market, valued at $1.55 billion in the base year 2025, is projected to achieve a Compound Annual Growth Rate (CAGR) of 11.1%, reaching substantial figures by the end of the forecast period. This robust growth trajectory is underpinned by several pivotal factors, including the maritime sector's persistent integration of sophisticated navigation technologies to elevate safety and operational efficiency. Concurrently, the burgeoning adoption of autonomous vehicles in both terrestrial and marine applications necessitates exceptionally accurate and dependable navigation systems, thereby amplifying the demand for optical fiber gyrocompasses. Furthermore, the increasing imperative for enhanced positioning accuracy in critical applications such as surveying, geophysical exploration, and defense initiatives is a key catalyst for market expansion. Ongoing technological innovations, leading to improvements in performance, miniaturization, cost-effectiveness, and system durability, also contribute significantly to market dynamism.
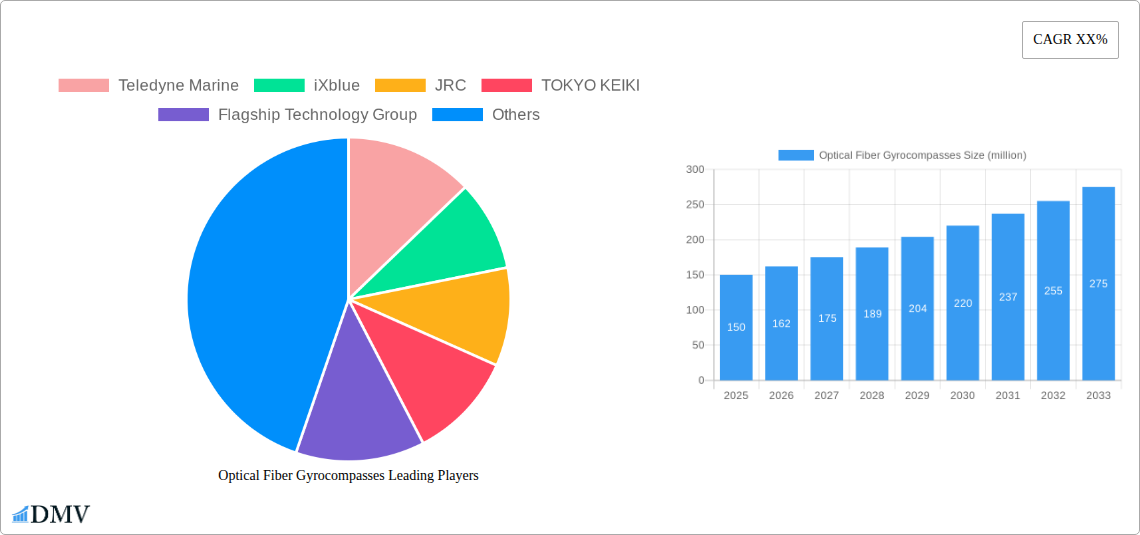
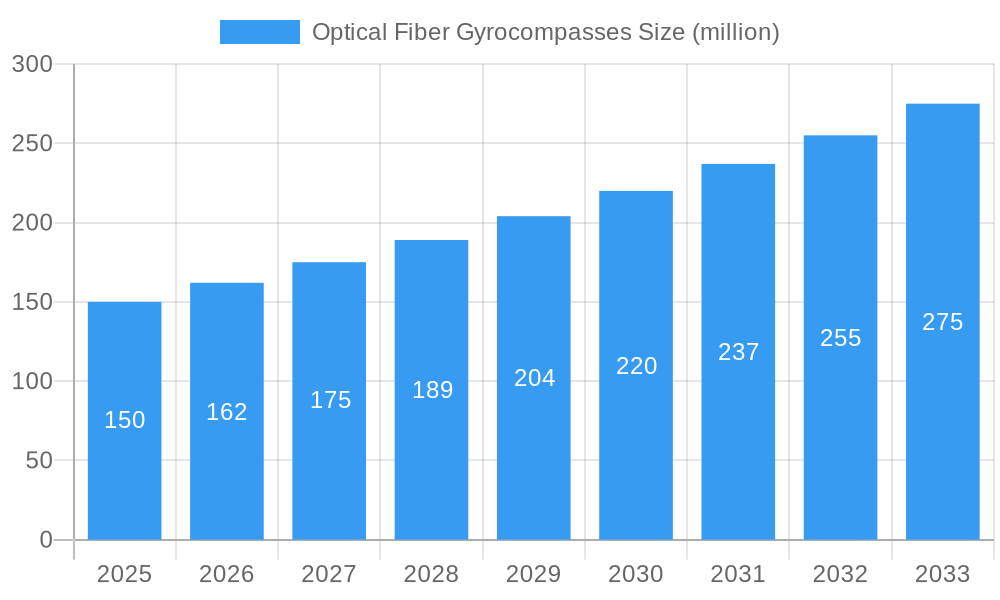
Optical Fiber Gyrocompasses Market Size (In Billion)
Despite the positive outlook, the market encounters certain growth inhibitors. The substantial initial investment required for the implementation of optical fiber gyrocompass systems can present a barrier for smaller entities in specific market segments. Moreover, the landscape is defined by vigorous competition among established vendors, compelling a continuous cycle of innovation and competitive pricing to secure and expand market share. Nevertheless, the long-term prospects for the optical fiber gyrocompass market remain exceedingly promising, propelled by sustained technological advancements and an expanding base of industrial demand. The segment catering to high-precision applications within defense and autonomous vehicle technologies is anticipated to exhibit the most pronounced growth throughout the forecast horizon. Regional expansion patterns are expected to vary, with North America and Europe anticipated to retain substantial market influence owing to their established high adoption rates in these economically developed regions.
Optical Fiber Gyrocompasses Company Market Share
Optical Fiber Gyrocompasses Market Report: A Comprehensive Analysis (2019-2033)
This insightful report provides a comprehensive analysis of the global Optical Fiber Gyrocompasses market, projecting a market value exceeding $XX million by 2033. The study covers the historical period (2019-2024), base year (2025), and forecast period (2025-2033), offering crucial insights for stakeholders across the value chain. With detailed market segmentation and competitive landscape analysis, this report is essential for companies, investors, and researchers seeking to navigate this dynamic market.
Optical Fiber Gyrocompasses Market Composition & Trends
This section meticulously examines the market's structure, identifying key trends and dynamics shaping its evolution. We analyze market concentration, revealing the share held by leading players like Teledyne Marine, iXblue, JRC, TOKYO KEIKI, Flagship Technology Group, Ningbo CHIYANG Electronic co.,ltd., CSSC Navigation Technology Co.,Ltd., and Fogsins. The report quantifies market share distribution, revealing the competitive intensity and potential for disruption. Furthermore, we delve into innovation catalysts, such as advancements in fiber optic technology and miniaturization, alongside regulatory landscapes impacting market access and product development. An in-depth analysis of substitute products and their competitive threat is presented, along with a detailed profile of end-users across various sectors. Finally, we analyze recent mergers and acquisitions (M&A) activities in the market, including deal values exceeding $XX million in specific instances.
- Market Concentration: Highly concentrated market with top 5 players holding approximately XX% market share in 2025.
- Innovation Catalysts: Advancements in fiber optic sensing technology, miniaturization, and improved accuracy.
- Regulatory Landscape: Compliance with international maritime standards and evolving safety regulations.
- Substitute Products: Analysis of competing technologies and their market impact.
- End-User Profile: Detailed analysis of end-users across defense, maritime, and aerospace sectors.
- M&A Activity: Review of significant M&A deals and their impact on market consolidation, with a total estimated value exceeding $XX million between 2019 and 2024.
Optical Fiber Gyrocompasses Industry Evolution
This section details the evolution of the Optical Fiber Gyrocompasses market, tracing its growth trajectory from 2019 to 2033. We analyze market growth rates, identifying periods of expansion and contraction. Technological advancements, such as the introduction of FOGs with improved performance characteristics and reduced costs, are meticulously examined, alongside their impact on market adoption. The report also explores shifting consumer demands, including the need for higher accuracy, improved reliability, and reduced power consumption, and their influence on product development and market trends. Specific data points, including compound annual growth rates (CAGRs) exceeding XX% during peak periods and adoption rates across different segments are provided.
Leading Regions, Countries, or Segments in Optical Fiber Gyrocompasses
This section pinpoints the dominant regions, countries, and segments within the Optical Fiber Gyrocompasses market. The report identifies the leading region (e.g., North America/Europe/Asia) based on factors such as high market penetration, significant investments in technology, and strong regulatory support.
Key Drivers in Dominant Region:
- High government spending on defense and maritime applications.
- Robust innovation ecosystem driving technological advancements.
- Favorable regulatory environment promoting market growth.
- Well-established supply chain and manufacturing infrastructure.
In-depth Analysis of Dominance: This section provides a thorough analysis of the dominant region's market position, considering factors like high demand from key industry verticals (e.g., maritime navigation, aerospace), strong presence of major players, and supportive government policies. The analysis also explores the interplay between technological innovation, cost optimization, and market demand in shaping the region's dominance.
Optical Fiber Gyrocompasses Product Innovations
Recent years have witnessed significant product innovations in Optical Fiber Gyrocompasses, encompassing advancements in sensor technology, data processing algorithms, and integration capabilities. These innovations have led to devices with enhanced accuracy, increased reliability, smaller form factors, and reduced power consumption. Unique selling propositions (USPs) of leading products are highlighted, emphasizing their competitive advantages in terms of performance metrics (e.g., drift rate, bias stability). The report showcases the technological advancements contributing to improved cost-effectiveness, making Optical Fiber Gyrocompasses more accessible across diverse applications.
Propelling Factors for Optical Fiber Gyrocompasses Growth
The growth of the Optical Fiber Gyrocompasses market is driven by a confluence of factors. Technological advancements, such as improved sensor technology and miniaturization, are significantly reducing costs and enhancing performance. The increasing demand for accurate navigation and positioning systems in various sectors, including defense, maritime, and aerospace, is fueling market expansion. Further, supportive government policies and regulations are creating a favorable environment for market growth.
Obstacles in the Optical Fiber Gyrocompasses Market
Despite significant growth potential, the Optical Fiber Gyrocompasses market faces several challenges. Regulatory hurdles, such as stringent certification processes and compliance requirements, pose barriers to entry and market expansion. Supply chain disruptions, particularly those related to the availability of critical components, can impact production and pricing. Furthermore, intense competition from established and emerging players is putting pressure on profit margins. The report quantifies the impacts of these challenges, estimating their effect on market growth rates in specific regions.
Future Opportunities in Optical Fiber Gyrocompasses
The future of the Optical Fiber Gyrocompasses market presents numerous opportunities. Emerging applications in autonomous vehicles, robotics, and precision agriculture are poised to drive significant growth. Advancements in technology, such as the development of more compact and cost-effective devices, will further expand the market's reach. New market segments, including consumer electronics and industrial automation, present untapped potential.
Major Players in the Optical Fiber Gyrocompasses Ecosystem
- Teledyne Marine
- iXblue
- JRC
- TOKYO KEIKI
- Flagship Technology Group
- Ningbo CHIYANG Electronic co.,ltd.
- CSSC Navigation Technology Co.,Ltd.
- Fogsins
Key Developments in Optical Fiber Gyrocompasses Industry
- 2022 Q4: Teledyne Marine launched a new generation of high-accuracy FOGs, expanding its market share.
- 2023 Q1: iXblue acquired a smaller competitor, strengthening its position in the market. (Further details on acquired company and deal value are omitted for brevity; this information would be included in the full report.)
- 2024 Q2: Significant investments announced in R&D for FOG technology by a leading Asian manufacturer. (Further details would be provided in the full report.)
Strategic Optical Fiber Gyrocompasses Market Forecast
The Optical Fiber Gyrocompasses market is poised for robust growth over the forecast period, driven by technological advancements, increasing demand across diverse sectors, and favorable regulatory landscapes. While challenges remain, the opportunities presented by emerging applications and technological innovations suggest a significant market expansion, potentially reaching $XX million by 2033. The continued focus on innovation and strategic partnerships by key players will shape the future competitive landscape and unlock substantial growth potential.
Optical Fiber Gyrocompasses Segmentation
-
1. Application
- 1.1. Shipping
- 1.2. Fishing Boats
- 1.3. Military
-
2. Types
- 2.1. Low Accuracy
- 2.2. High Accuracy
Optical Fiber Gyrocompasses Segmentation By Geography
-
1. North America
- 1.1. United States
- 1.2. Canada
- 1.3. Mexico
-
2. South America
- 2.1. Brazil
- 2.2. Argentina
- 2.3. Rest of South America
-
3. Europe
- 3.1. United Kingdom
- 3.2. Germany
- 3.3. France
- 3.4. Italy
- 3.5. Spain
- 3.6. Russia
- 3.7. Benelux
- 3.8. Nordics
- 3.9. Rest of Europe
-
4. Middle East & Africa
- 4.1. Turkey
- 4.2. Israel
- 4.3. GCC
- 4.4. North Africa
- 4.5. South Africa
- 4.6. Rest of Middle East & Africa
-
5. Asia Pacific
- 5.1. China
- 5.2. India
- 5.3. Japan
- 5.4. South Korea
- 5.5. ASEAN
- 5.6. Oceania
- 5.7. Rest of Asia Pacific

Optical Fiber Gyrocompasses Regional Market Share
Geographic Coverage of Optical Fiber Gyrocompasses
Optical Fiber Gyrocompasses REPORT HIGHLIGHTS
| Aspects | Details |
|---|---|
| Study Period | 2020-2034 |
| Base Year | 2025 |
| Estimated Year | 2026 |
| Forecast Period | 2026-2034 |
| Historical Period | 2020-2025 |
| Growth Rate | CAGR of 11.1% from 2020-2034 |
| Segmentation |
|
Table of Contents
- 1. Introduction
- 1.1. Research Scope
- 1.2. Market Segmentation
- 1.3. Research Methodology
- 1.4. Definitions and Assumptions
- 2. Executive Summary
- 2.1. Introduction
- 3. Market Dynamics
- 3.1. Introduction
- 3.2. Market Drivers
- 3.3. Market Restrains
- 3.4. Market Trends
- 4. Market Factor Analysis
- 4.1. Porters Five Forces
- 4.2. Supply/Value Chain
- 4.3. PESTEL analysis
- 4.4. Market Entropy
- 4.5. Patent/Trademark Analysis
- 5. Global Optical Fiber Gyrocompasses Analysis, Insights and Forecast, 2020-2032
- 5.1. Market Analysis, Insights and Forecast - by Application
- 5.1.1. Shipping
- 5.1.2. Fishing Boats
- 5.1.3. Military
- 5.2. Market Analysis, Insights and Forecast - by Types
- 5.2.1. Low Accuracy
- 5.2.2. High Accuracy
- 5.3. Market Analysis, Insights and Forecast - by Region
- 5.3.1. North America
- 5.3.2. South America
- 5.3.3. Europe
- 5.3.4. Middle East & Africa
- 5.3.5. Asia Pacific
- 5.1. Market Analysis, Insights and Forecast - by Application
- 6. North America Optical Fiber Gyrocompasses Analysis, Insights and Forecast, 2020-2032
- 6.1. Market Analysis, Insights and Forecast - by Application
- 6.1.1. Shipping
- 6.1.2. Fishing Boats
- 6.1.3. Military
- 6.2. Market Analysis, Insights and Forecast - by Types
- 6.2.1. Low Accuracy
- 6.2.2. High Accuracy
- 6.1. Market Analysis, Insights and Forecast - by Application
- 7. South America Optical Fiber Gyrocompasses Analysis, Insights and Forecast, 2020-2032
- 7.1. Market Analysis, Insights and Forecast - by Application
- 7.1.1. Shipping
- 7.1.2. Fishing Boats
- 7.1.3. Military
- 7.2. Market Analysis, Insights and Forecast - by Types
- 7.2.1. Low Accuracy
- 7.2.2. High Accuracy
- 7.1. Market Analysis, Insights and Forecast - by Application
- 8. Europe Optical Fiber Gyrocompasses Analysis, Insights and Forecast, 2020-2032
- 8.1. Market Analysis, Insights and Forecast - by Application
- 8.1.1. Shipping
- 8.1.2. Fishing Boats
- 8.1.3. Military
- 8.2. Market Analysis, Insights and Forecast - by Types
- 8.2.1. Low Accuracy
- 8.2.2. High Accuracy
- 8.1. Market Analysis, Insights and Forecast - by Application
- 9. Middle East & Africa Optical Fiber Gyrocompasses Analysis, Insights and Forecast, 2020-2032
- 9.1. Market Analysis, Insights and Forecast - by Application
- 9.1.1. Shipping
- 9.1.2. Fishing Boats
- 9.1.3. Military
- 9.2. Market Analysis, Insights and Forecast - by Types
- 9.2.1. Low Accuracy
- 9.2.2. High Accuracy
- 9.1. Market Analysis, Insights and Forecast - by Application
- 10. Asia Pacific Optical Fiber Gyrocompasses Analysis, Insights and Forecast, 2020-2032
- 10.1. Market Analysis, Insights and Forecast - by Application
- 10.1.1. Shipping
- 10.1.2. Fishing Boats
- 10.1.3. Military
- 10.2. Market Analysis, Insights and Forecast - by Types
- 10.2.1. Low Accuracy
- 10.2.2. High Accuracy
- 10.1. Market Analysis, Insights and Forecast - by Application
- 11. Competitive Analysis
- 11.1. Global Market Share Analysis 2025
- 11.2. Company Profiles
- 11.2.1 Teledyne Marine
- 11.2.1.1. Overview
- 11.2.1.2. Products
- 11.2.1.3. SWOT Analysis
- 11.2.1.4. Recent Developments
- 11.2.1.5. Financials (Based on Availability)
- 11.2.2 iXblue
- 11.2.2.1. Overview
- 11.2.2.2. Products
- 11.2.2.3. SWOT Analysis
- 11.2.2.4. Recent Developments
- 11.2.2.5. Financials (Based on Availability)
- 11.2.3 JRC
- 11.2.3.1. Overview
- 11.2.3.2. Products
- 11.2.3.3. SWOT Analysis
- 11.2.3.4. Recent Developments
- 11.2.3.5. Financials (Based on Availability)
- 11.2.4 TOKYO KEIKI
- 11.2.4.1. Overview
- 11.2.4.2. Products
- 11.2.4.3. SWOT Analysis
- 11.2.4.4. Recent Developments
- 11.2.4.5. Financials (Based on Availability)
- 11.2.5 Flagship Technology Group
- 11.2.5.1. Overview
- 11.2.5.2. Products
- 11.2.5.3. SWOT Analysis
- 11.2.5.4. Recent Developments
- 11.2.5.5. Financials (Based on Availability)
- 11.2.6 Ningbo CHIYANG Electronic co.
- 11.2.6.1. Overview
- 11.2.6.2. Products
- 11.2.6.3. SWOT Analysis
- 11.2.6.4. Recent Developments
- 11.2.6.5. Financials (Based on Availability)
- 11.2.7 ltd.
- 11.2.7.1. Overview
- 11.2.7.2. Products
- 11.2.7.3. SWOT Analysis
- 11.2.7.4. Recent Developments
- 11.2.7.5. Financials (Based on Availability)
- 11.2.8 CSSC Navigation Technology Co.
- 11.2.8.1. Overview
- 11.2.8.2. Products
- 11.2.8.3. SWOT Analysis
- 11.2.8.4. Recent Developments
- 11.2.8.5. Financials (Based on Availability)
- 11.2.9 Ltd.
- 11.2.9.1. Overview
- 11.2.9.2. Products
- 11.2.9.3. SWOT Analysis
- 11.2.9.4. Recent Developments
- 11.2.9.5. Financials (Based on Availability)
- 11.2.10 Fogsins
- 11.2.10.1. Overview
- 11.2.10.2. Products
- 11.2.10.3. SWOT Analysis
- 11.2.10.4. Recent Developments
- 11.2.10.5. Financials (Based on Availability)
- 11.2.1 Teledyne Marine
List of Figures
- Figure 1: Global Optical Fiber Gyrocompasses Revenue Breakdown (billion, %) by Region 2025 & 2033
- Figure 2: Global Optical Fiber Gyrocompasses Volume Breakdown (K, %) by Region 2025 & 2033
- Figure 3: North America Optical Fiber Gyrocompasses Revenue (billion), by Application 2025 & 2033
- Figure 4: North America Optical Fiber Gyrocompasses Volume (K), by Application 2025 & 2033
- Figure 5: North America Optical Fiber Gyrocompasses Revenue Share (%), by Application 2025 & 2033
- Figure 6: North America Optical Fiber Gyrocompasses Volume Share (%), by Application 2025 & 2033
- Figure 7: North America Optical Fiber Gyrocompasses Revenue (billion), by Types 2025 & 2033
- Figure 8: North America Optical Fiber Gyrocompasses Volume (K), by Types 2025 & 2033
- Figure 9: North America Optical Fiber Gyrocompasses Revenue Share (%), by Types 2025 & 2033
- Figure 10: North America Optical Fiber Gyrocompasses Volume Share (%), by Types 2025 & 2033
- Figure 11: North America Optical Fiber Gyrocompasses Revenue (billion), by Country 2025 & 2033
- Figure 12: North America Optical Fiber Gyrocompasses Volume (K), by Country 2025 & 2033
- Figure 13: North America Optical Fiber Gyrocompasses Revenue Share (%), by Country 2025 & 2033
- Figure 14: North America Optical Fiber Gyrocompasses Volume Share (%), by Country 2025 & 2033
- Figure 15: South America Optical Fiber Gyrocompasses Revenue (billion), by Application 2025 & 2033
- Figure 16: South America Optical Fiber Gyrocompasses Volume (K), by Application 2025 & 2033
- Figure 17: South America Optical Fiber Gyrocompasses Revenue Share (%), by Application 2025 & 2033
- Figure 18: South America Optical Fiber Gyrocompasses Volume Share (%), by Application 2025 & 2033
- Figure 19: South America Optical Fiber Gyrocompasses Revenue (billion), by Types 2025 & 2033
- Figure 20: South America Optical Fiber Gyrocompasses Volume (K), by Types 2025 & 2033
- Figure 21: South America Optical Fiber Gyrocompasses Revenue Share (%), by Types 2025 & 2033
- Figure 22: South America Optical Fiber Gyrocompasses Volume Share (%), by Types 2025 & 2033
- Figure 23: South America Optical Fiber Gyrocompasses Revenue (billion), by Country 2025 & 2033
- Figure 24: South America Optical Fiber Gyrocompasses Volume (K), by Country 2025 & 2033
- Figure 25: South America Optical Fiber Gyrocompasses Revenue Share (%), by Country 2025 & 2033
- Figure 26: South America Optical Fiber Gyrocompasses Volume Share (%), by Country 2025 & 2033
- Figure 27: Europe Optical Fiber Gyrocompasses Revenue (billion), by Application 2025 & 2033
- Figure 28: Europe Optical Fiber Gyrocompasses Volume (K), by Application 2025 & 2033
- Figure 29: Europe Optical Fiber Gyrocompasses Revenue Share (%), by Application 2025 & 2033
- Figure 30: Europe Optical Fiber Gyrocompasses Volume Share (%), by Application 2025 & 2033
- Figure 31: Europe Optical Fiber Gyrocompasses Revenue (billion), by Types 2025 & 2033
- Figure 32: Europe Optical Fiber Gyrocompasses Volume (K), by Types 2025 & 2033
- Figure 33: Europe Optical Fiber Gyrocompasses Revenue Share (%), by Types 2025 & 2033
- Figure 34: Europe Optical Fiber Gyrocompasses Volume Share (%), by Types 2025 & 2033
- Figure 35: Europe Optical Fiber Gyrocompasses Revenue (billion), by Country 2025 & 2033
- Figure 36: Europe Optical Fiber Gyrocompasses Volume (K), by Country 2025 & 2033
- Figure 37: Europe Optical Fiber Gyrocompasses Revenue Share (%), by Country 2025 & 2033
- Figure 38: Europe Optical Fiber Gyrocompasses Volume Share (%), by Country 2025 & 2033
- Figure 39: Middle East & Africa Optical Fiber Gyrocompasses Revenue (billion), by Application 2025 & 2033
- Figure 40: Middle East & Africa Optical Fiber Gyrocompasses Volume (K), by Application 2025 & 2033
- Figure 41: Middle East & Africa Optical Fiber Gyrocompasses Revenue Share (%), by Application 2025 & 2033
- Figure 42: Middle East & Africa Optical Fiber Gyrocompasses Volume Share (%), by Application 2025 & 2033
- Figure 43: Middle East & Africa Optical Fiber Gyrocompasses Revenue (billion), by Types 2025 & 2033
- Figure 44: Middle East & Africa Optical Fiber Gyrocompasses Volume (K), by Types 2025 & 2033
- Figure 45: Middle East & Africa Optical Fiber Gyrocompasses Revenue Share (%), by Types 2025 & 2033
- Figure 46: Middle East & Africa Optical Fiber Gyrocompasses Volume Share (%), by Types 2025 & 2033
- Figure 47: Middle East & Africa Optical Fiber Gyrocompasses Revenue (billion), by Country 2025 & 2033
- Figure 48: Middle East & Africa Optical Fiber Gyrocompasses Volume (K), by Country 2025 & 2033
- Figure 49: Middle East & Africa Optical Fiber Gyrocompasses Revenue Share (%), by Country 2025 & 2033
- Figure 50: Middle East & Africa Optical Fiber Gyrocompasses Volume Share (%), by Country 2025 & 2033
- Figure 51: Asia Pacific Optical Fiber Gyrocompasses Revenue (billion), by Application 2025 & 2033
- Figure 52: Asia Pacific Optical Fiber Gyrocompasses Volume (K), by Application 2025 & 2033
- Figure 53: Asia Pacific Optical Fiber Gyrocompasses Revenue Share (%), by Application 2025 & 2033
- Figure 54: Asia Pacific Optical Fiber Gyrocompasses Volume Share (%), by Application 2025 & 2033
- Figure 55: Asia Pacific Optical Fiber Gyrocompasses Revenue (billion), by Types 2025 & 2033
- Figure 56: Asia Pacific Optical Fiber Gyrocompasses Volume (K), by Types 2025 & 2033
- Figure 57: Asia Pacific Optical Fiber Gyrocompasses Revenue Share (%), by Types 2025 & 2033
- Figure 58: Asia Pacific Optical Fiber Gyrocompasses Volume Share (%), by Types 2025 & 2033
- Figure 59: Asia Pacific Optical Fiber Gyrocompasses Revenue (billion), by Country 2025 & 2033
- Figure 60: Asia Pacific Optical Fiber Gyrocompasses Volume (K), by Country 2025 & 2033
- Figure 61: Asia Pacific Optical Fiber Gyrocompasses Revenue Share (%), by Country 2025 & 2033
- Figure 62: Asia Pacific Optical Fiber Gyrocompasses Volume Share (%), by Country 2025 & 2033
List of Tables
- Table 1: Global Optical Fiber Gyrocompasses Revenue billion Forecast, by Application 2020 & 2033
- Table 2: Global Optical Fiber Gyrocompasses Volume K Forecast, by Application 2020 & 2033
- Table 3: Global Optical Fiber Gyrocompasses Revenue billion Forecast, by Types 2020 & 2033
- Table 4: Global Optical Fiber Gyrocompasses Volume K Forecast, by Types 2020 & 2033
- Table 5: Global Optical Fiber Gyrocompasses Revenue billion Forecast, by Region 2020 & 2033
- Table 6: Global Optical Fiber Gyrocompasses Volume K Forecast, by Region 2020 & 2033
- Table 7: Global Optical Fiber Gyrocompasses Revenue billion Forecast, by Application 2020 & 2033
- Table 8: Global Optical Fiber Gyrocompasses Volume K Forecast, by Application 2020 & 2033
- Table 9: Global Optical Fiber Gyrocompasses Revenue billion Forecast, by Types 2020 & 2033
- Table 10: Global Optical Fiber Gyrocompasses Volume K Forecast, by Types 2020 & 2033
- Table 11: Global Optical Fiber Gyrocompasses Revenue billion Forecast, by Country 2020 & 2033
- Table 12: Global Optical Fiber Gyrocompasses Volume K Forecast, by Country 2020 & 2033
- Table 13: United States Optical Fiber Gyrocompasses Revenue (billion) Forecast, by Application 2020 & 2033
- Table 14: United States Optical Fiber Gyrocompasses Volume (K) Forecast, by Application 2020 & 2033
- Table 15: Canada Optical Fiber Gyrocompasses Revenue (billion) Forecast, by Application 2020 & 2033
- Table 16: Canada Optical Fiber Gyrocompasses Volume (K) Forecast, by Application 2020 & 2033
- Table 17: Mexico Optical Fiber Gyrocompasses Revenue (billion) Forecast, by Application 2020 & 2033
- Table 18: Mexico Optical Fiber Gyrocompasses Volume (K) Forecast, by Application 2020 & 2033
- Table 19: Global Optical Fiber Gyrocompasses Revenue billion Forecast, by Application 2020 & 2033
- Table 20: Global Optical Fiber Gyrocompasses Volume K Forecast, by Application 2020 & 2033
- Table 21: Global Optical Fiber Gyrocompasses Revenue billion Forecast, by Types 2020 & 2033
- Table 22: Global Optical Fiber Gyrocompasses Volume K Forecast, by Types 2020 & 2033
- Table 23: Global Optical Fiber Gyrocompasses Revenue billion Forecast, by Country 2020 & 2033
- Table 24: Global Optical Fiber Gyrocompasses Volume K Forecast, by Country 2020 & 2033
- Table 25: Brazil Optical Fiber Gyrocompasses Revenue (billion) Forecast, by Application 2020 & 2033
- Table 26: Brazil Optical Fiber Gyrocompasses Volume (K) Forecast, by Application 2020 & 2033
- Table 27: Argentina Optical Fiber Gyrocompasses Revenue (billion) Forecast, by Application 2020 & 2033
- Table 28: Argentina Optical Fiber Gyrocompasses Volume (K) Forecast, by Application 2020 & 2033
- Table 29: Rest of South America Optical Fiber Gyrocompasses Revenue (billion) Forecast, by Application 2020 & 2033
- Table 30: Rest of South America Optical Fiber Gyrocompasses Volume (K) Forecast, by Application 2020 & 2033
- Table 31: Global Optical Fiber Gyrocompasses Revenue billion Forecast, by Application 2020 & 2033
- Table 32: Global Optical Fiber Gyrocompasses Volume K Forecast, by Application 2020 & 2033
- Table 33: Global Optical Fiber Gyrocompasses Revenue billion Forecast, by Types 2020 & 2033
- Table 34: Global Optical Fiber Gyrocompasses Volume K Forecast, by Types 2020 & 2033
- Table 35: Global Optical Fiber Gyrocompasses Revenue billion Forecast, by Country 2020 & 2033
- Table 36: Global Optical Fiber Gyrocompasses Volume K Forecast, by Country 2020 & 2033
- Table 37: United Kingdom Optical Fiber Gyrocompasses Revenue (billion) Forecast, by Application 2020 & 2033
- Table 38: United Kingdom Optical Fiber Gyrocompasses Volume (K) Forecast, by Application 2020 & 2033
- Table 39: Germany Optical Fiber Gyrocompasses Revenue (billion) Forecast, by Application 2020 & 2033
- Table 40: Germany Optical Fiber Gyrocompasses Volume (K) Forecast, by Application 2020 & 2033
- Table 41: France Optical Fiber Gyrocompasses Revenue (billion) Forecast, by Application 2020 & 2033
- Table 42: France Optical Fiber Gyrocompasses Volume (K) Forecast, by Application 2020 & 2033
- Table 43: Italy Optical Fiber Gyrocompasses Revenue (billion) Forecast, by Application 2020 & 2033
- Table 44: Italy Optical Fiber Gyrocompasses Volume (K) Forecast, by Application 2020 & 2033
- Table 45: Spain Optical Fiber Gyrocompasses Revenue (billion) Forecast, by Application 2020 & 2033
- Table 46: Spain Optical Fiber Gyrocompasses Volume (K) Forecast, by Application 2020 & 2033
- Table 47: Russia Optical Fiber Gyrocompasses Revenue (billion) Forecast, by Application 2020 & 2033
- Table 48: Russia Optical Fiber Gyrocompasses Volume (K) Forecast, by Application 2020 & 2033
- Table 49: Benelux Optical Fiber Gyrocompasses Revenue (billion) Forecast, by Application 2020 & 2033
- Table 50: Benelux Optical Fiber Gyrocompasses Volume (K) Forecast, by Application 2020 & 2033
- Table 51: Nordics Optical Fiber Gyrocompasses Revenue (billion) Forecast, by Application 2020 & 2033
- Table 52: Nordics Optical Fiber Gyrocompasses Volume (K) Forecast, by Application 2020 & 2033
- Table 53: Rest of Europe Optical Fiber Gyrocompasses Revenue (billion) Forecast, by Application 2020 & 2033
- Table 54: Rest of Europe Optical Fiber Gyrocompasses Volume (K) Forecast, by Application 2020 & 2033
- Table 55: Global Optical Fiber Gyrocompasses Revenue billion Forecast, by Application 2020 & 2033
- Table 56: Global Optical Fiber Gyrocompasses Volume K Forecast, by Application 2020 & 2033
- Table 57: Global Optical Fiber Gyrocompasses Revenue billion Forecast, by Types 2020 & 2033
- Table 58: Global Optical Fiber Gyrocompasses Volume K Forecast, by Types 2020 & 2033
- Table 59: Global Optical Fiber Gyrocompasses Revenue billion Forecast, by Country 2020 & 2033
- Table 60: Global Optical Fiber Gyrocompasses Volume K Forecast, by Country 2020 & 2033
- Table 61: Turkey Optical Fiber Gyrocompasses Revenue (billion) Forecast, by Application 2020 & 2033
- Table 62: Turkey Optical Fiber Gyrocompasses Volume (K) Forecast, by Application 2020 & 2033
- Table 63: Israel Optical Fiber Gyrocompasses Revenue (billion) Forecast, by Application 2020 & 2033
- Table 64: Israel Optical Fiber Gyrocompasses Volume (K) Forecast, by Application 2020 & 2033
- Table 65: GCC Optical Fiber Gyrocompasses Revenue (billion) Forecast, by Application 2020 & 2033
- Table 66: GCC Optical Fiber Gyrocompasses Volume (K) Forecast, by Application 2020 & 2033
- Table 67: North Africa Optical Fiber Gyrocompasses Revenue (billion) Forecast, by Application 2020 & 2033
- Table 68: North Africa Optical Fiber Gyrocompasses Volume (K) Forecast, by Application 2020 & 2033
- Table 69: South Africa Optical Fiber Gyrocompasses Revenue (billion) Forecast, by Application 2020 & 2033
- Table 70: South Africa Optical Fiber Gyrocompasses Volume (K) Forecast, by Application 2020 & 2033
- Table 71: Rest of Middle East & Africa Optical Fiber Gyrocompasses Revenue (billion) Forecast, by Application 2020 & 2033
- Table 72: Rest of Middle East & Africa Optical Fiber Gyrocompasses Volume (K) Forecast, by Application 2020 & 2033
- Table 73: Global Optical Fiber Gyrocompasses Revenue billion Forecast, by Application 2020 & 2033
- Table 74: Global Optical Fiber Gyrocompasses Volume K Forecast, by Application 2020 & 2033
- Table 75: Global Optical Fiber Gyrocompasses Revenue billion Forecast, by Types 2020 & 2033
- Table 76: Global Optical Fiber Gyrocompasses Volume K Forecast, by Types 2020 & 2033
- Table 77: Global Optical Fiber Gyrocompasses Revenue billion Forecast, by Country 2020 & 2033
- Table 78: Global Optical Fiber Gyrocompasses Volume K Forecast, by Country 2020 & 2033
- Table 79: China Optical Fiber Gyrocompasses Revenue (billion) Forecast, by Application 2020 & 2033
- Table 80: China Optical Fiber Gyrocompasses Volume (K) Forecast, by Application 2020 & 2033
- Table 81: India Optical Fiber Gyrocompasses Revenue (billion) Forecast, by Application 2020 & 2033
- Table 82: India Optical Fiber Gyrocompasses Volume (K) Forecast, by Application 2020 & 2033
- Table 83: Japan Optical Fiber Gyrocompasses Revenue (billion) Forecast, by Application 2020 & 2033
- Table 84: Japan Optical Fiber Gyrocompasses Volume (K) Forecast, by Application 2020 & 2033
- Table 85: South Korea Optical Fiber Gyrocompasses Revenue (billion) Forecast, by Application 2020 & 2033
- Table 86: South Korea Optical Fiber Gyrocompasses Volume (K) Forecast, by Application 2020 & 2033
- Table 87: ASEAN Optical Fiber Gyrocompasses Revenue (billion) Forecast, by Application 2020 & 2033
- Table 88: ASEAN Optical Fiber Gyrocompasses Volume (K) Forecast, by Application 2020 & 2033
- Table 89: Oceania Optical Fiber Gyrocompasses Revenue (billion) Forecast, by Application 2020 & 2033
- Table 90: Oceania Optical Fiber Gyrocompasses Volume (K) Forecast, by Application 2020 & 2033
- Table 91: Rest of Asia Pacific Optical Fiber Gyrocompasses Revenue (billion) Forecast, by Application 2020 & 2033
- Table 92: Rest of Asia Pacific Optical Fiber Gyrocompasses Volume (K) Forecast, by Application 2020 & 2033
Frequently Asked Questions
1. What is the projected Compound Annual Growth Rate (CAGR) of the Optical Fiber Gyrocompasses?
The projected CAGR is approximately 11.1%.
2. Which companies are prominent players in the Optical Fiber Gyrocompasses?
Key companies in the market include Teledyne Marine, iXblue, JRC, TOKYO KEIKI, Flagship Technology Group, Ningbo CHIYANG Electronic co., ltd., CSSC Navigation Technology Co., Ltd., Fogsins.
3. What are the main segments of the Optical Fiber Gyrocompasses?
The market segments include Application, Types.
4. Can you provide details about the market size?
The market size is estimated to be USD 1.55 billion as of 2022.
5. What are some drivers contributing to market growth?
N/A
6. What are the notable trends driving market growth?
N/A
7. Are there any restraints impacting market growth?
N/A
8. Can you provide examples of recent developments in the market?
N/A
9. What pricing options are available for accessing the report?
Pricing options include single-user, multi-user, and enterprise licenses priced at USD 4350.00, USD 6525.00, and USD 8700.00 respectively.
10. Is the market size provided in terms of value or volume?
The market size is provided in terms of value, measured in billion and volume, measured in K.
11. Are there any specific market keywords associated with the report?
Yes, the market keyword associated with the report is "Optical Fiber Gyrocompasses," which aids in identifying and referencing the specific market segment covered.
12. How do I determine which pricing option suits my needs best?
The pricing options vary based on user requirements and access needs. Individual users may opt for single-user licenses, while businesses requiring broader access may choose multi-user or enterprise licenses for cost-effective access to the report.
13. Are there any additional resources or data provided in the Optical Fiber Gyrocompasses report?
While the report offers comprehensive insights, it's advisable to review the specific contents or supplementary materials provided to ascertain if additional resources or data are available.
14. How can I stay updated on further developments or reports in the Optical Fiber Gyrocompasses?
To stay informed about further developments, trends, and reports in the Optical Fiber Gyrocompasses, consider subscribing to industry newsletters, following relevant companies and organizations, or regularly checking reputable industry news sources and publications.
Methodology
Step 1 - Identification of Relevant Samples Size from Population Database


Step 2 - Approaches for Defining Global Market Size (Value, Volume* & Price*)

Note*: In applicable scenarios
Step 3 - Data Sources
Primary Research
- Web Analytics
- Survey Reports
- Research Institute
- Latest Research Reports
- Opinion Leaders
Secondary Research
- Annual Reports
- White Paper
- Latest Press Release
- Industry Association
- Paid Database
- Investor Presentations

Step 4 - Data Triangulation
Involves using different sources of information in order to increase the validity of a study
These sources are likely to be stakeholders in a program - participants, other researchers, program staff, other community members, and so on.
Then we put all data in single framework & apply various statistical tools to find out the dynamic on the market.
During the analysis stage, feedback from the stakeholder groups would be compared to determine areas of agreement as well as areas of divergence