

Key Insights
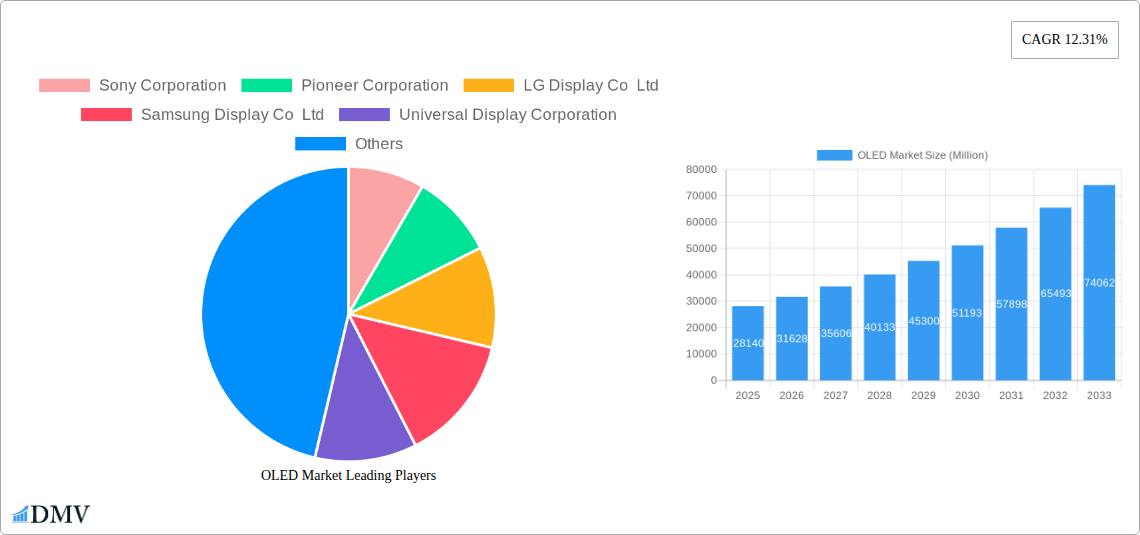
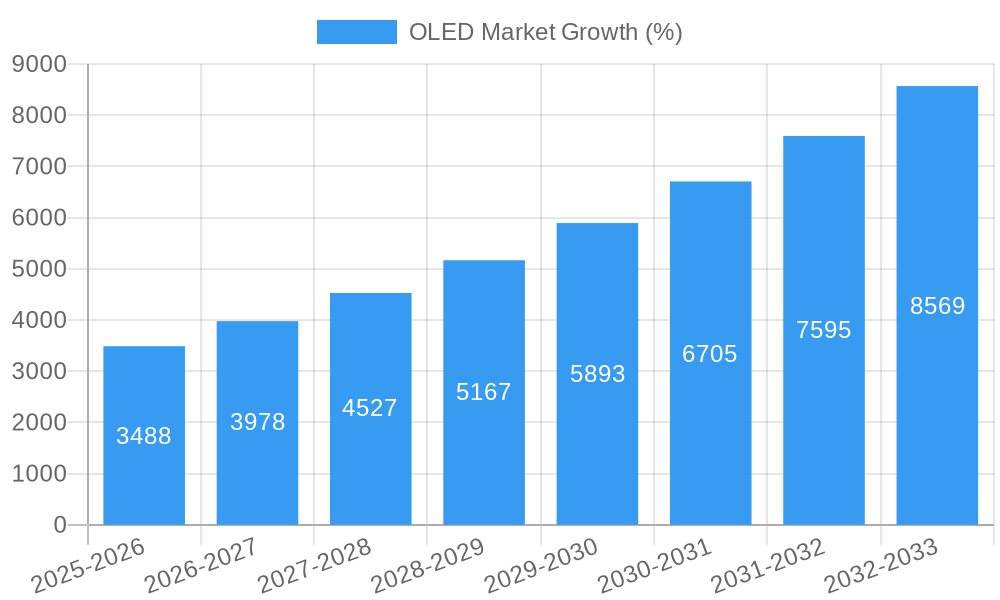
The OLED (Organic Light-Emitting Diode) market is experiencing robust growth, projected to reach a substantial size, driven by increasing demand for high-resolution, energy-efficient displays across various applications. The market's Compound Annual Growth Rate (CAGR) of 12.31% from 2019 to 2024 indicates a significant upward trajectory. Key drivers include the rising adoption of OLED technology in smartphones, televisions, and automotive displays, fueled by consumer preference for superior picture quality, thinner designs, and improved power efficiency compared to LCDs. Furthermore, advancements in OLED technology, such as flexible displays and improved color accuracy, are expanding application possibilities into wearables, augmented reality (AR) devices, and even lighting solutions. The market's segmentation likely includes various display sizes, resolutions, and applications, contributing to the overall growth. While competitive pressures from established players like Samsung Display and LG Display, alongside emerging companies, pose challenges, the innovative nature of OLED technology and its ability to cater to evolving consumer demands ensure continued market expansion.
The forecast period (2025-2033) anticipates sustained growth, driven by continuous technological advancements and increasing market penetration in emerging economies. The substantial existing player base, including Sony, Pioneer, and others, fosters intense competition, encouraging innovation and price optimization. However, challenges remain, such as the relatively higher manufacturing costs of OLED displays compared to LCDs and concerns surrounding screen burn-in. Nevertheless, ongoing research and development efforts aimed at addressing these limitations, along with the strong demand for high-quality visual displays, are expected to propel the OLED market towards substantial expansion throughout the forecast period. This growth will be further fueled by the integration of OLED technology into increasingly diverse applications, shaping a future where superior display technology is ubiquitous.
OLED Market: A Comprehensive Report (2019-2033)
This insightful report provides a detailed analysis of the OLED market, encompassing historical data (2019-2024), current estimates (2025), and future forecasts (2025-2033). It delves into market composition, technological advancements, key players, and future growth opportunities, offering invaluable insights for stakeholders across the OLED value chain. The report uses 2025 as its base year and provides a comprehensive understanding of the market dynamics, enabling informed decision-making. The global OLED market is projected to reach xx Million by 2033.
OLED Market Composition & Trends
This section analyzes the competitive landscape of the OLED market, including market concentration, innovation drivers, regulatory influences, substitute products, end-user segmentation, and merger & acquisition (M&A) activity. We evaluate the market share distribution amongst key players like Samsung Display Co Ltd, LG Display Co Ltd, and BOE Technology, identifying prevalent competitive strategies and their impact on market dynamics. The analysis also explores the influence of technological advancements on market growth, highlighting the role of flexible OLEDs and other emerging innovations. Furthermore, we examine the regulatory environment and the presence of substitute technologies, providing a nuanced view of the market's trajectory.
- Market Concentration: High concentration with a few dominant players holding significant market share. xx% market share held by top 3 players in 2024.
- Innovation Catalysts: Advancements in flexible displays, improved efficiency, and integration with AI-enabled devices.
- Regulatory Landscape: Government incentives and regulations in key regions influencing market growth.
- Substitute Products: LCD technology remains a significant competitor but is facing increasing pressure from OLED's superior image quality.
- End-User Profiles: Consumer electronics, automotive, and healthcare are key end-use segments.
- M&A Activities: Significant M&A activity in recent years, with deal values exceeding xx Million in the past five years. Specific deal examples and their impact on market share will be included.
OLED Market Industry Evolution
This section provides a comprehensive overview of the OLED market's evolution from 2019 to 2033, analyzing market growth trajectories, technological advancements, and evolving consumer preferences. The report delves into the impact of technological innovations, such as foldable displays and MicroLED technology, on the growth of the OLED market. We will analyze the historical growth rates and project future growth based on various factors. We will also examine the changing demands of consumers and how they influence the market. Specific data points, including market size, growth rates, and adoption metrics for various OLED technologies across different applications will be included. The increasing demand for high-resolution displays in smartphones, televisions, and other consumer electronics will also be discussed. We will assess the influence of factors like pricing and technological advancements on market growth rates and adoption trends.
Leading Regions, Countries, or Segments in OLED Market
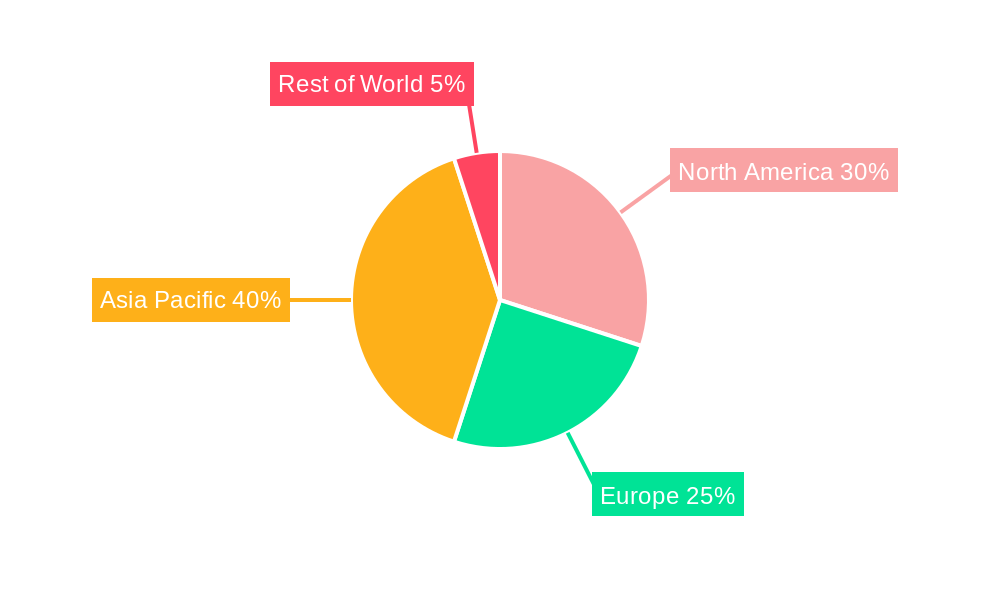
This section identifies the leading regions, countries, and segments driving OLED market growth. We analyze the factors contributing to the dominance of these regions, including investment trends, government support, and manufacturing capabilities.
- Key Drivers:
- High consumer electronics demand: Particularly in Asia.
- Government subsidies and incentives: Supporting domestic OLED manufacturing.
- Strong technological infrastructure: Facilitating innovation and production.
- Favorable regulatory environment: Encouraging market growth and adoption.
- Dominance Factors: Strong manufacturing capabilities, significant investments in R&D, robust consumer electronics market, and government support.
OLED Market Product Innovations
Recent advancements in OLED technology have led to the development of flexible, foldable, and rollable displays, expanding the range of applications. The introduction of new materials and manufacturing processes have enhanced performance metrics such as brightness, color accuracy, and energy efficiency. This section highlights the unique selling propositions of these innovations, driving increased adoption across various industries. The integration of AI in security features, as seen in Samsung's Flex Magic Pixel OLED technology, represents a significant step forward.
Propelling Factors for OLED Market Growth
Several factors are propelling OLED market growth, including technological advancements (e.g., enhanced brightness, color accuracy, and flexible displays), the increasing demand for high-resolution displays in consumer electronics, and government support for the industry. Economic factors such as rising disposable incomes in emerging economies and technological advancements have also contributed to market growth.
Obstacles in the OLED Market
Despite its growth potential, the OLED market faces several challenges. These include the high manufacturing costs associated with OLED displays, potential supply chain disruptions impacting production, and intense competition from established LCD manufacturers. Further, regulatory hurdles and variations in standards across different regions can create complications for manufacturers operating globally. These challenges can restrict market expansion and negatively affect profitability.
Future Opportunities in OLED Market
Emerging opportunities in the OLED market include the expansion into new applications, such as automotive displays, wearable devices, and augmented/virtual reality headsets. Advancements in micro-LED technology and the development of more sustainable and cost-effective manufacturing processes will further enhance growth potential. Furthermore, increasing demand for larger screen sizes and higher resolutions will drive market growth in the coming years.
Major Players in the OLED Market Ecosystem
- Sony Corporation
- Pioneer Corporation
- LG Display Co Ltd
- Samsung Display Co Ltd
- Universal Display Corporation
- OLEDWorks LLC
- TDK Corporation
- OSRAM OLED GmbH
- Winstar Display Co Ltd
- Visionox Co Ltd
- Raystar Optronics Inc
- Ritek Corporation
- WiseChip Semiconductor Inc
- Hella GmbH & KGaA
- Yeolight Technology
- Acuity Brands Inc
- Kopin Corporation
- Pixelligent Technologies
- BOE Technology
- Tianma Microelectronics
*List Not Exhaustive
Key Developments in OLED Market Industry
- February 2024: Samsung Display unveiled robust foldable panels and introduced Flex Magic Pixel OLED technology, enhancing security through AI integration. The artwork 'Mr. OLEDboy' further highlighted the technology's potential impact.
- January 2024: Apple announced the upcoming iPhone SE 4, expected to feature an OLED display manufactured by a Chinese company, signifying a potential shift in supply chain dynamics.
Strategic OLED Market Forecast
The OLED market is poised for substantial growth driven by technological advancements, increasing demand across various applications, and supportive government policies. Innovation in flexible displays, improved energy efficiency, and expanding use in automotive and wearable technology segments will further fuel market expansion. The market is expected to experience sustained growth in the forecast period (2025-2033), driven by these factors.
OLED Market Segmentation
-
1. Product Type
- 1.1. Display
- 1.2. Lighting
-
2. Technology
- 2.1. Passive Matrix OLED (PMOLED)
- 2.2. Active Matrix OLED (AMOLED)
-
3. Type
- 3.1. Flexible
- 3.2. Rigid
- 3.3. Transparent
-
4. Application
- 4.1. Mobile and Tablet
- 4.2. Television
- 4.3. Automotive Displays
- 4.4. Smartwatches & Wearables
- 4.5. Digital Signage/Large Format Display
- 4.6. PC Monitors and Laptops
- 4.7. Other Applications
OLED Market Segmentation By Geography
- 1. North America
- 2. Europe
- 3. Asia
- 4. Australia and New Zealand
- 5. Latin America
- 6. Middle East and Africa
OLED Market REPORT HIGHLIGHTS
| Aspects | Details |
|---|---|
| Study Period | 2019-2033 |
| Base Year | 2024 |
| Estimated Year | 2025 |
| Forecast Period | 2025-2033 |
| Historical Period | 2019-2024 |
| Growth Rate | CAGR of 12.31% from 2019-2033 |
| Segmentation |
|
Table of Contents
- 1. Introduction
- 1.1. Research Scope
- 1.2. Market Segmentation
- 1.3. Research Methodology
- 1.4. Definitions and Assumptions
- 2. Executive Summary
- 2.1. Introduction
- 3. Market Dynamics
- 3.1. Introduction
- 3.2. Market Drivers
- 3.2.1. Increasing Demand for Enhanced Display Quality in Wearable Devices and Smartphones; Rising Demand for Affordable and Energy-efficient OLED Lighting Solutions
- 3.3. Market Restrains
- 3.3.1. Increasing Demand for Enhanced Display Quality in Wearable Devices and Smartphones; Rising Demand for Affordable and Energy-efficient OLED Lighting Solutions
- 3.4. Market Trends
- 3.4.1. Mobile and Tablet Segment is Expected to Hold Significant Market Share
- 4. Market Factor Analysis
- 4.1. Porters Five Forces
- 4.2. Supply/Value Chain
- 4.3. PESTEL analysis
- 4.4. Market Entropy
- 4.5. Patent/Trademark Analysis
- 5. Global OLED Market Analysis, Insights and Forecast, 2019-2031
- 5.1. Market Analysis, Insights and Forecast - by Product Type
- 5.1.1. Display
- 5.1.2. Lighting
- 5.2. Market Analysis, Insights and Forecast - by Technology
- 5.2.1. Passive Matrix OLED (PMOLED)
- 5.2.2. Active Matrix OLED (AMOLED)
- 5.3. Market Analysis, Insights and Forecast - by Type
- 5.3.1. Flexible
- 5.3.2. Rigid
- 5.3.3. Transparent
- 5.4. Market Analysis, Insights and Forecast - by Application
- 5.4.1. Mobile and Tablet
- 5.4.2. Television
- 5.4.3. Automotive Displays
- 5.4.4. Smartwatches & Wearables
- 5.4.5. Digital Signage/Large Format Display
- 5.4.6. PC Monitors and Laptops
- 5.4.7. Other Applications
- 5.5. Market Analysis, Insights and Forecast - by Region
- 5.5.1. North America
- 5.5.2. Europe
- 5.5.3. Asia
- 5.5.4. Australia and New Zealand
- 5.5.5. Latin America
- 5.5.6. Middle East and Africa
- 5.1. Market Analysis, Insights and Forecast - by Product Type
- 6. North America OLED Market Analysis, Insights and Forecast, 2019-2031
- 6.1. Market Analysis, Insights and Forecast - by Product Type
- 6.1.1. Display
- 6.1.2. Lighting
- 6.2. Market Analysis, Insights and Forecast - by Technology
- 6.2.1. Passive Matrix OLED (PMOLED)
- 6.2.2. Active Matrix OLED (AMOLED)
- 6.3. Market Analysis, Insights and Forecast - by Type
- 6.3.1. Flexible
- 6.3.2. Rigid
- 6.3.3. Transparent
- 6.4. Market Analysis, Insights and Forecast - by Application
- 6.4.1. Mobile and Tablet
- 6.4.2. Television
- 6.4.3. Automotive Displays
- 6.4.4. Smartwatches & Wearables
- 6.4.5. Digital Signage/Large Format Display
- 6.4.6. PC Monitors and Laptops
- 6.4.7. Other Applications
- 6.1. Market Analysis, Insights and Forecast - by Product Type
- 7. Europe OLED Market Analysis, Insights and Forecast, 2019-2031
- 7.1. Market Analysis, Insights and Forecast - by Product Type
- 7.1.1. Display
- 7.1.2. Lighting
- 7.2. Market Analysis, Insights and Forecast - by Technology
- 7.2.1. Passive Matrix OLED (PMOLED)
- 7.2.2. Active Matrix OLED (AMOLED)
- 7.3. Market Analysis, Insights and Forecast - by Type
- 7.3.1. Flexible
- 7.3.2. Rigid
- 7.3.3. Transparent
- 7.4. Market Analysis, Insights and Forecast - by Application
- 7.4.1. Mobile and Tablet
- 7.4.2. Television
- 7.4.3. Automotive Displays
- 7.4.4. Smartwatches & Wearables
- 7.4.5. Digital Signage/Large Format Display
- 7.4.6. PC Monitors and Laptops
- 7.4.7. Other Applications
- 7.1. Market Analysis, Insights and Forecast - by Product Type
- 8. Asia OLED Market Analysis, Insights and Forecast, 2019-2031
- 8.1. Market Analysis, Insights and Forecast - by Product Type
- 8.1.1. Display
- 8.1.2. Lighting
- 8.2. Market Analysis, Insights and Forecast - by Technology
- 8.2.1. Passive Matrix OLED (PMOLED)
- 8.2.2. Active Matrix OLED (AMOLED)
- 8.3. Market Analysis, Insights and Forecast - by Type
- 8.3.1. Flexible
- 8.3.2. Rigid
- 8.3.3. Transparent
- 8.4. Market Analysis, Insights and Forecast - by Application
- 8.4.1. Mobile and Tablet
- 8.4.2. Television
- 8.4.3. Automotive Displays
- 8.4.4. Smartwatches & Wearables
- 8.4.5. Digital Signage/Large Format Display
- 8.4.6. PC Monitors and Laptops
- 8.4.7. Other Applications
- 8.1. Market Analysis, Insights and Forecast - by Product Type
- 9. Australia and New Zealand OLED Market Analysis, Insights and Forecast, 2019-2031
- 9.1. Market Analysis, Insights and Forecast - by Product Type
- 9.1.1. Display
- 9.1.2. Lighting
- 9.2. Market Analysis, Insights and Forecast - by Technology
- 9.2.1. Passive Matrix OLED (PMOLED)
- 9.2.2. Active Matrix OLED (AMOLED)
- 9.3. Market Analysis, Insights and Forecast - by Type
- 9.3.1. Flexible
- 9.3.2. Rigid
- 9.3.3. Transparent
- 9.4. Market Analysis, Insights and Forecast - by Application
- 9.4.1. Mobile and Tablet
- 9.4.2. Television
- 9.4.3. Automotive Displays
- 9.4.4. Smartwatches & Wearables
- 9.4.5. Digital Signage/Large Format Display
- 9.4.6. PC Monitors and Laptops
- 9.4.7. Other Applications
- 9.1. Market Analysis, Insights and Forecast - by Product Type
- 10. Latin America OLED Market Analysis, Insights and Forecast, 2019-2031
- 10.1. Market Analysis, Insights and Forecast - by Product Type
- 10.1.1. Display
- 10.1.2. Lighting
- 10.2. Market Analysis, Insights and Forecast - by Technology
- 10.2.1. Passive Matrix OLED (PMOLED)
- 10.2.2. Active Matrix OLED (AMOLED)
- 10.3. Market Analysis, Insights and Forecast - by Type
- 10.3.1. Flexible
- 10.3.2. Rigid
- 10.3.3. Transparent
- 10.4. Market Analysis, Insights and Forecast - by Application
- 10.4.1. Mobile and Tablet
- 10.4.2. Television
- 10.4.3. Automotive Displays
- 10.4.4. Smartwatches & Wearables
- 10.4.5. Digital Signage/Large Format Display
- 10.4.6. PC Monitors and Laptops
- 10.4.7. Other Applications
- 10.1. Market Analysis, Insights and Forecast - by Product Type
- 11. Middle East and Africa OLED Market Analysis, Insights and Forecast, 2019-2031
- 11.1. Market Analysis, Insights and Forecast - by Product Type
- 11.1.1. Display
- 11.1.2. Lighting
- 11.2. Market Analysis, Insights and Forecast - by Technology
- 11.2.1. Passive Matrix OLED (PMOLED)
- 11.2.2. Active Matrix OLED (AMOLED)
- 11.3. Market Analysis, Insights and Forecast - by Type
- 11.3.1. Flexible
- 11.3.2. Rigid
- 11.3.3. Transparent
- 11.4. Market Analysis, Insights and Forecast - by Application
- 11.4.1. Mobile and Tablet
- 11.4.2. Television
- 11.4.3. Automotive Displays
- 11.4.4. Smartwatches & Wearables
- 11.4.5. Digital Signage/Large Format Display
- 11.4.6. PC Monitors and Laptops
- 11.4.7. Other Applications
- 11.1. Market Analysis, Insights and Forecast - by Product Type
- 12. Competitive Analysis
- 12.1. Global Market Share Analysis 2024
- 12.2. Company Profiles
- 12.2.1 Sony Corporation
- 12.2.1.1. Overview
- 12.2.1.2. Products
- 12.2.1.3. SWOT Analysis
- 12.2.1.4. Recent Developments
- 12.2.1.5. Financials (Based on Availability)
- 12.2.2 Pioneer Corporation
- 12.2.2.1. Overview
- 12.2.2.2. Products
- 12.2.2.3. SWOT Analysis
- 12.2.2.4. Recent Developments
- 12.2.2.5. Financials (Based on Availability)
- 12.2.3 LG Display Co Ltd
- 12.2.3.1. Overview
- 12.2.3.2. Products
- 12.2.3.3. SWOT Analysis
- 12.2.3.4. Recent Developments
- 12.2.3.5. Financials (Based on Availability)
- 12.2.4 Samsung Display Co Ltd
- 12.2.4.1. Overview
- 12.2.4.2. Products
- 12.2.4.3. SWOT Analysis
- 12.2.4.4. Recent Developments
- 12.2.4.5. Financials (Based on Availability)
- 12.2.5 Universal Display Corporation
- 12.2.5.1. Overview
- 12.2.5.2. Products
- 12.2.5.3. SWOT Analysis
- 12.2.5.4. Recent Developments
- 12.2.5.5. Financials (Based on Availability)
- 12.2.6 OLEDWorks LLC
- 12.2.6.1. Overview
- 12.2.6.2. Products
- 12.2.6.3. SWOT Analysis
- 12.2.6.4. Recent Developments
- 12.2.6.5. Financials (Based on Availability)
- 12.2.7 TDK Corporation
- 12.2.7.1. Overview
- 12.2.7.2. Products
- 12.2.7.3. SWOT Analysis
- 12.2.7.4. Recent Developments
- 12.2.7.5. Financials (Based on Availability)
- 12.2.8 OSRAM OLED GmbH
- 12.2.8.1. Overview
- 12.2.8.2. Products
- 12.2.8.3. SWOT Analysis
- 12.2.8.4. Recent Developments
- 12.2.8.5. Financials (Based on Availability)
- 12.2.9 Winstar Display Co Ltd
- 12.2.9.1. Overview
- 12.2.9.2. Products
- 12.2.9.3. SWOT Analysis
- 12.2.9.4. Recent Developments
- 12.2.9.5. Financials (Based on Availability)
- 12.2.10 Visionox Co Ltd
- 12.2.10.1. Overview
- 12.2.10.2. Products
- 12.2.10.3. SWOT Analysis
- 12.2.10.4. Recent Developments
- 12.2.10.5. Financials (Based on Availability)
- 12.2.11 Raystar Optronics Inc
- 12.2.11.1. Overview
- 12.2.11.2. Products
- 12.2.11.3. SWOT Analysis
- 12.2.11.4. Recent Developments
- 12.2.11.5. Financials (Based on Availability)
- 12.2.12 Ritek Corporation
- 12.2.12.1. Overview
- 12.2.12.2. Products
- 12.2.12.3. SWOT Analysis
- 12.2.12.4. Recent Developments
- 12.2.12.5. Financials (Based on Availability)
- 12.2.13 WiseChip Semiconductor Inc
- 12.2.13.1. Overview
- 12.2.13.2. Products
- 12.2.13.3. SWOT Analysis
- 12.2.13.4. Recent Developments
- 12.2.13.5. Financials (Based on Availability)
- 12.2.14 Hella GmbH & KGaA
- 12.2.14.1. Overview
- 12.2.14.2. Products
- 12.2.14.3. SWOT Analysis
- 12.2.14.4. Recent Developments
- 12.2.14.5. Financials (Based on Availability)
- 12.2.15 Yeolight Technology
- 12.2.15.1. Overview
- 12.2.15.2. Products
- 12.2.15.3. SWOT Analysis
- 12.2.15.4. Recent Developments
- 12.2.15.5. Financials (Based on Availability)
- 12.2.16 Acuity Brands Inc
- 12.2.16.1. Overview
- 12.2.16.2. Products
- 12.2.16.3. SWOT Analysis
- 12.2.16.4. Recent Developments
- 12.2.16.5. Financials (Based on Availability)
- 12.2.17 Kopin Corporation
- 12.2.17.1. Overview
- 12.2.17.2. Products
- 12.2.17.3. SWOT Analysis
- 12.2.17.4. Recent Developments
- 12.2.17.5. Financials (Based on Availability)
- 12.2.18 Pixelligent Technologies
- 12.2.18.1. Overview
- 12.2.18.2. Products
- 12.2.18.3. SWOT Analysis
- 12.2.18.4. Recent Developments
- 12.2.18.5. Financials (Based on Availability)
- 12.2.19 BOE Technology
- 12.2.19.1. Overview
- 12.2.19.2. Products
- 12.2.19.3. SWOT Analysis
- 12.2.19.4. Recent Developments
- 12.2.19.5. Financials (Based on Availability)
- 12.2.20 Tianma Microelectronics*List Not Exhaustive
- 12.2.20.1. Overview
- 12.2.20.2. Products
- 12.2.20.3. SWOT Analysis
- 12.2.20.4. Recent Developments
- 12.2.20.5. Financials (Based on Availability)
- 12.2.1 Sony Corporation
List of Figures
- Figure 1: Global OLED Market Revenue Breakdown (Million, %) by Region 2024 & 2032
- Figure 2: Global OLED Market Volume Breakdown (Billion, %) by Region 2024 & 2032
- Figure 3: North America OLED Market Revenue (Million), by Product Type 2024 & 2032
- Figure 4: North America OLED Market Volume (Billion), by Product Type 2024 & 2032
- Figure 5: North America OLED Market Revenue Share (%), by Product Type 2024 & 2032
- Figure 6: North America OLED Market Volume Share (%), by Product Type 2024 & 2032
- Figure 7: North America OLED Market Revenue (Million), by Technology 2024 & 2032
- Figure 8: North America OLED Market Volume (Billion), by Technology 2024 & 2032
- Figure 9: North America OLED Market Revenue Share (%), by Technology 2024 & 2032
- Figure 10: North America OLED Market Volume Share (%), by Technology 2024 & 2032
- Figure 11: North America OLED Market Revenue (Million), by Type 2024 & 2032
- Figure 12: North America OLED Market Volume (Billion), by Type 2024 & 2032
- Figure 13: North America OLED Market Revenue Share (%), by Type 2024 & 2032
- Figure 14: North America OLED Market Volume Share (%), by Type 2024 & 2032
- Figure 15: North America OLED Market Revenue (Million), by Application 2024 & 2032
- Figure 16: North America OLED Market Volume (Billion), by Application 2024 & 2032
- Figure 17: North America OLED Market Revenue Share (%), by Application 2024 & 2032
- Figure 18: North America OLED Market Volume Share (%), by Application 2024 & 2032
- Figure 19: North America OLED Market Revenue (Million), by Country 2024 & 2032
- Figure 20: North America OLED Market Volume (Billion), by Country 2024 & 2032
- Figure 21: North America OLED Market Revenue Share (%), by Country 2024 & 2032
- Figure 22: North America OLED Market Volume Share (%), by Country 2024 & 2032
- Figure 23: Europe OLED Market Revenue (Million), by Product Type 2024 & 2032
- Figure 24: Europe OLED Market Volume (Billion), by Product Type 2024 & 2032
- Figure 25: Europe OLED Market Revenue Share (%), by Product Type 2024 & 2032
- Figure 26: Europe OLED Market Volume Share (%), by Product Type 2024 & 2032
- Figure 27: Europe OLED Market Revenue (Million), by Technology 2024 & 2032
- Figure 28: Europe OLED Market Volume (Billion), by Technology 2024 & 2032
- Figure 29: Europe OLED Market Revenue Share (%), by Technology 2024 & 2032
- Figure 30: Europe OLED Market Volume Share (%), by Technology 2024 & 2032
- Figure 31: Europe OLED Market Revenue (Million), by Type 2024 & 2032
- Figure 32: Europe OLED Market Volume (Billion), by Type 2024 & 2032
- Figure 33: Europe OLED Market Revenue Share (%), by Type 2024 & 2032
- Figure 34: Europe OLED Market Volume Share (%), by Type 2024 & 2032
- Figure 35: Europe OLED Market Revenue (Million), by Application 2024 & 2032
- Figure 36: Europe OLED Market Volume (Billion), by Application 2024 & 2032
- Figure 37: Europe OLED Market Revenue Share (%), by Application 2024 & 2032
- Figure 38: Europe OLED Market Volume Share (%), by Application 2024 & 2032
- Figure 39: Europe OLED Market Revenue (Million), by Country 2024 & 2032
- Figure 40: Europe OLED Market Volume (Billion), by Country 2024 & 2032
- Figure 41: Europe OLED Market Revenue Share (%), by Country 2024 & 2032
- Figure 42: Europe OLED Market Volume Share (%), by Country 2024 & 2032
- Figure 43: Asia OLED Market Revenue (Million), by Product Type 2024 & 2032
- Figure 44: Asia OLED Market Volume (Billion), by Product Type 2024 & 2032
- Figure 45: Asia OLED Market Revenue Share (%), by Product Type 2024 & 2032
- Figure 46: Asia OLED Market Volume Share (%), by Product Type 2024 & 2032
- Figure 47: Asia OLED Market Revenue (Million), by Technology 2024 & 2032
- Figure 48: Asia OLED Market Volume (Billion), by Technology 2024 & 2032
- Figure 49: Asia OLED Market Revenue Share (%), by Technology 2024 & 2032
- Figure 50: Asia OLED Market Volume Share (%), by Technology 2024 & 2032
- Figure 51: Asia OLED Market Revenue (Million), by Type 2024 & 2032
- Figure 52: Asia OLED Market Volume (Billion), by Type 2024 & 2032
- Figure 53: Asia OLED Market Revenue Share (%), by Type 2024 & 2032
- Figure 54: Asia OLED Market Volume Share (%), by Type 2024 & 2032
- Figure 55: Asia OLED Market Revenue (Million), by Application 2024 & 2032
- Figure 56: Asia OLED Market Volume (Billion), by Application 2024 & 2032
- Figure 57: Asia OLED Market Revenue Share (%), by Application 2024 & 2032
- Figure 58: Asia OLED Market Volume Share (%), by Application 2024 & 2032
- Figure 59: Asia OLED Market Revenue (Million), by Country 2024 & 2032
- Figure 60: Asia OLED Market Volume (Billion), by Country 2024 & 2032
- Figure 61: Asia OLED Market Revenue Share (%), by Country 2024 & 2032
- Figure 62: Asia OLED Market Volume Share (%), by Country 2024 & 2032
- Figure 63: Australia and New Zealand OLED Market Revenue (Million), by Product Type 2024 & 2032
- Figure 64: Australia and New Zealand OLED Market Volume (Billion), by Product Type 2024 & 2032
- Figure 65: Australia and New Zealand OLED Market Revenue Share (%), by Product Type 2024 & 2032
- Figure 66: Australia and New Zealand OLED Market Volume Share (%), by Product Type 2024 & 2032
- Figure 67: Australia and New Zealand OLED Market Revenue (Million), by Technology 2024 & 2032
- Figure 68: Australia and New Zealand OLED Market Volume (Billion), by Technology 2024 & 2032
- Figure 69: Australia and New Zealand OLED Market Revenue Share (%), by Technology 2024 & 2032
- Figure 70: Australia and New Zealand OLED Market Volume Share (%), by Technology 2024 & 2032
- Figure 71: Australia and New Zealand OLED Market Revenue (Million), by Type 2024 & 2032
- Figure 72: Australia and New Zealand OLED Market Volume (Billion), by Type 2024 & 2032
- Figure 73: Australia and New Zealand OLED Market Revenue Share (%), by Type 2024 & 2032
- Figure 74: Australia and New Zealand OLED Market Volume Share (%), by Type 2024 & 2032
- Figure 75: Australia and New Zealand OLED Market Revenue (Million), by Application 2024 & 2032
- Figure 76: Australia and New Zealand OLED Market Volume (Billion), by Application 2024 & 2032
- Figure 77: Australia and New Zealand OLED Market Revenue Share (%), by Application 2024 & 2032
- Figure 78: Australia and New Zealand OLED Market Volume Share (%), by Application 2024 & 2032
- Figure 79: Australia and New Zealand OLED Market Revenue (Million), by Country 2024 & 2032
- Figure 80: Australia and New Zealand OLED Market Volume (Billion), by Country 2024 & 2032
- Figure 81: Australia and New Zealand OLED Market Revenue Share (%), by Country 2024 & 2032
- Figure 82: Australia and New Zealand OLED Market Volume Share (%), by Country 2024 & 2032
- Figure 83: Latin America OLED Market Revenue (Million), by Product Type 2024 & 2032
- Figure 84: Latin America OLED Market Volume (Billion), by Product Type 2024 & 2032
- Figure 85: Latin America OLED Market Revenue Share (%), by Product Type 2024 & 2032
- Figure 86: Latin America OLED Market Volume Share (%), by Product Type 2024 & 2032
- Figure 87: Latin America OLED Market Revenue (Million), by Technology 2024 & 2032
- Figure 88: Latin America OLED Market Volume (Billion), by Technology 2024 & 2032
- Figure 89: Latin America OLED Market Revenue Share (%), by Technology 2024 & 2032
- Figure 90: Latin America OLED Market Volume Share (%), by Technology 2024 & 2032
- Figure 91: Latin America OLED Market Revenue (Million), by Type 2024 & 2032
- Figure 92: Latin America OLED Market Volume (Billion), by Type 2024 & 2032
- Figure 93: Latin America OLED Market Revenue Share (%), by Type 2024 & 2032
- Figure 94: Latin America OLED Market Volume Share (%), by Type 2024 & 2032
- Figure 95: Latin America OLED Market Revenue (Million), by Application 2024 & 2032
- Figure 96: Latin America OLED Market Volume (Billion), by Application 2024 & 2032
- Figure 97: Latin America OLED Market Revenue Share (%), by Application 2024 & 2032
- Figure 98: Latin America OLED Market Volume Share (%), by Application 2024 & 2032
- Figure 99: Latin America OLED Market Revenue (Million), by Country 2024 & 2032
- Figure 100: Latin America OLED Market Volume (Billion), by Country 2024 & 2032
- Figure 101: Latin America OLED Market Revenue Share (%), by Country 2024 & 2032
- Figure 102: Latin America OLED Market Volume Share (%), by Country 2024 & 2032
- Figure 103: Middle East and Africa OLED Market Revenue (Million), by Product Type 2024 & 2032
- Figure 104: Middle East and Africa OLED Market Volume (Billion), by Product Type 2024 & 2032
- Figure 105: Middle East and Africa OLED Market Revenue Share (%), by Product Type 2024 & 2032
- Figure 106: Middle East and Africa OLED Market Volume Share (%), by Product Type 2024 & 2032
- Figure 107: Middle East and Africa OLED Market Revenue (Million), by Technology 2024 & 2032
- Figure 108: Middle East and Africa OLED Market Volume (Billion), by Technology 2024 & 2032
- Figure 109: Middle East and Africa OLED Market Revenue Share (%), by Technology 2024 & 2032
- Figure 110: Middle East and Africa OLED Market Volume Share (%), by Technology 2024 & 2032
- Figure 111: Middle East and Africa OLED Market Revenue (Million), by Type 2024 & 2032
- Figure 112: Middle East and Africa OLED Market Volume (Billion), by Type 2024 & 2032
- Figure 113: Middle East and Africa OLED Market Revenue Share (%), by Type 2024 & 2032
- Figure 114: Middle East and Africa OLED Market Volume Share (%), by Type 2024 & 2032
- Figure 115: Middle East and Africa OLED Market Revenue (Million), by Application 2024 & 2032
- Figure 116: Middle East and Africa OLED Market Volume (Billion), by Application 2024 & 2032
- Figure 117: Middle East and Africa OLED Market Revenue Share (%), by Application 2024 & 2032
- Figure 118: Middle East and Africa OLED Market Volume Share (%), by Application 2024 & 2032
- Figure 119: Middle East and Africa OLED Market Revenue (Million), by Country 2024 & 2032
- Figure 120: Middle East and Africa OLED Market Volume (Billion), by Country 2024 & 2032
- Figure 121: Middle East and Africa OLED Market Revenue Share (%), by Country 2024 & 2032
- Figure 122: Middle East and Africa OLED Market Volume Share (%), by Country 2024 & 2032
List of Tables
- Table 1: Global OLED Market Revenue Million Forecast, by Region 2019 & 2032
- Table 2: Global OLED Market Volume Billion Forecast, by Region 2019 & 2032
- Table 3: Global OLED Market Revenue Million Forecast, by Product Type 2019 & 2032
- Table 4: Global OLED Market Volume Billion Forecast, by Product Type 2019 & 2032
- Table 5: Global OLED Market Revenue Million Forecast, by Technology 2019 & 2032
- Table 6: Global OLED Market Volume Billion Forecast, by Technology 2019 & 2032
- Table 7: Global OLED Market Revenue Million Forecast, by Type 2019 & 2032
- Table 8: Global OLED Market Volume Billion Forecast, by Type 2019 & 2032
- Table 9: Global OLED Market Revenue Million Forecast, by Application 2019 & 2032
- Table 10: Global OLED Market Volume Billion Forecast, by Application 2019 & 2032
- Table 11: Global OLED Market Revenue Million Forecast, by Region 2019 & 2032
- Table 12: Global OLED Market Volume Billion Forecast, by Region 2019 & 2032
- Table 13: Global OLED Market Revenue Million Forecast, by Product Type 2019 & 2032
- Table 14: Global OLED Market Volume Billion Forecast, by Product Type 2019 & 2032
- Table 15: Global OLED Market Revenue Million Forecast, by Technology 2019 & 2032
- Table 16: Global OLED Market Volume Billion Forecast, by Technology 2019 & 2032
- Table 17: Global OLED Market Revenue Million Forecast, by Type 2019 & 2032
- Table 18: Global OLED Market Volume Billion Forecast, by Type 2019 & 2032
- Table 19: Global OLED Market Revenue Million Forecast, by Application 2019 & 2032
- Table 20: Global OLED Market Volume Billion Forecast, by Application 2019 & 2032
- Table 21: Global OLED Market Revenue Million Forecast, by Country 2019 & 2032
- Table 22: Global OLED Market Volume Billion Forecast, by Country 2019 & 2032
- Table 23: Global OLED Market Revenue Million Forecast, by Product Type 2019 & 2032
- Table 24: Global OLED Market Volume Billion Forecast, by Product Type 2019 & 2032
- Table 25: Global OLED Market Revenue Million Forecast, by Technology 2019 & 2032
- Table 26: Global OLED Market Volume Billion Forecast, by Technology 2019 & 2032
- Table 27: Global OLED Market Revenue Million Forecast, by Type 2019 & 2032
- Table 28: Global OLED Market Volume Billion Forecast, by Type 2019 & 2032
- Table 29: Global OLED Market Revenue Million Forecast, by Application 2019 & 2032
- Table 30: Global OLED Market Volume Billion Forecast, by Application 2019 & 2032
- Table 31: Global OLED Market Revenue Million Forecast, by Country 2019 & 2032
- Table 32: Global OLED Market Volume Billion Forecast, by Country 2019 & 2032
- Table 33: Global OLED Market Revenue Million Forecast, by Product Type 2019 & 2032
- Table 34: Global OLED Market Volume Billion Forecast, by Product Type 2019 & 2032
- Table 35: Global OLED Market Revenue Million Forecast, by Technology 2019 & 2032
- Table 36: Global OLED Market Volume Billion Forecast, by Technology 2019 & 2032
- Table 37: Global OLED Market Revenue Million Forecast, by Type 2019 & 2032
- Table 38: Global OLED Market Volume Billion Forecast, by Type 2019 & 2032
- Table 39: Global OLED Market Revenue Million Forecast, by Application 2019 & 2032
- Table 40: Global OLED Market Volume Billion Forecast, by Application 2019 & 2032
- Table 41: Global OLED Market Revenue Million Forecast, by Country 2019 & 2032
- Table 42: Global OLED Market Volume Billion Forecast, by Country 2019 & 2032
- Table 43: Global OLED Market Revenue Million Forecast, by Product Type 2019 & 2032
- Table 44: Global OLED Market Volume Billion Forecast, by Product Type 2019 & 2032
- Table 45: Global OLED Market Revenue Million Forecast, by Technology 2019 & 2032
- Table 46: Global OLED Market Volume Billion Forecast, by Technology 2019 & 2032
- Table 47: Global OLED Market Revenue Million Forecast, by Type 2019 & 2032
- Table 48: Global OLED Market Volume Billion Forecast, by Type 2019 & 2032
- Table 49: Global OLED Market Revenue Million Forecast, by Application 2019 & 2032
- Table 50: Global OLED Market Volume Billion Forecast, by Application 2019 & 2032
- Table 51: Global OLED Market Revenue Million Forecast, by Country 2019 & 2032
- Table 52: Global OLED Market Volume Billion Forecast, by Country 2019 & 2032
- Table 53: Global OLED Market Revenue Million Forecast, by Product Type 2019 & 2032
- Table 54: Global OLED Market Volume Billion Forecast, by Product Type 2019 & 2032
- Table 55: Global OLED Market Revenue Million Forecast, by Technology 2019 & 2032
- Table 56: Global OLED Market Volume Billion Forecast, by Technology 2019 & 2032
- Table 57: Global OLED Market Revenue Million Forecast, by Type 2019 & 2032
- Table 58: Global OLED Market Volume Billion Forecast, by Type 2019 & 2032
- Table 59: Global OLED Market Revenue Million Forecast, by Application 2019 & 2032
- Table 60: Global OLED Market Volume Billion Forecast, by Application 2019 & 2032
- Table 61: Global OLED Market Revenue Million Forecast, by Country 2019 & 2032
- Table 62: Global OLED Market Volume Billion Forecast, by Country 2019 & 2032
- Table 63: Global OLED Market Revenue Million Forecast, by Product Type 2019 & 2032
- Table 64: Global OLED Market Volume Billion Forecast, by Product Type 2019 & 2032
- Table 65: Global OLED Market Revenue Million Forecast, by Technology 2019 & 2032
- Table 66: Global OLED Market Volume Billion Forecast, by Technology 2019 & 2032
- Table 67: Global OLED Market Revenue Million Forecast, by Type 2019 & 2032
- Table 68: Global OLED Market Volume Billion Forecast, by Type 2019 & 2032
- Table 69: Global OLED Market Revenue Million Forecast, by Application 2019 & 2032
- Table 70: Global OLED Market Volume Billion Forecast, by Application 2019 & 2032
- Table 71: Global OLED Market Revenue Million Forecast, by Country 2019 & 2032
- Table 72: Global OLED Market Volume Billion Forecast, by Country 2019 & 2032
Frequently Asked Questions
1. What is the projected Compound Annual Growth Rate (CAGR) of the OLED Market?
The projected CAGR is approximately 12.31%.
2. Which companies are prominent players in the OLED Market?
Key companies in the market include Sony Corporation, Pioneer Corporation, LG Display Co Ltd, Samsung Display Co Ltd, Universal Display Corporation, OLEDWorks LLC, TDK Corporation, OSRAM OLED GmbH, Winstar Display Co Ltd, Visionox Co Ltd, Raystar Optronics Inc, Ritek Corporation, WiseChip Semiconductor Inc, Hella GmbH & KGaA, Yeolight Technology, Acuity Brands Inc, Kopin Corporation, Pixelligent Technologies, BOE Technology, Tianma Microelectronics*List Not Exhaustive.
3. What are the main segments of the OLED Market?
The market segments include Product Type, Technology, Type, Application.
4. Can you provide details about the market size?
The market size is estimated to be USD 28.14 Million as of 2022.
5. What are some drivers contributing to market growth?
Increasing Demand for Enhanced Display Quality in Wearable Devices and Smartphones; Rising Demand for Affordable and Energy-efficient OLED Lighting Solutions.
6. What are the notable trends driving market growth?
Mobile and Tablet Segment is Expected to Hold Significant Market Share.
7. Are there any restraints impacting market growth?
Increasing Demand for Enhanced Display Quality in Wearable Devices and Smartphones; Rising Demand for Affordable and Energy-efficient OLED Lighting Solutions.
8. Can you provide examples of recent developments in the market?
February 2024: Samsung Display presented robust foldable panels and introduced Flex Magic Pixel OLED technology, which collaborates with AI-enabled smart devices to enhance security measures. The artwork 'Mr. OLEDboy,' created by the esteemed London-based fashion illustrator Mr. Slowboy, imagines the future shaped by OLED technology.January 2024: Apple announced the introduction of a new midrange iPhone model. According to a report, the forthcoming iPhone SE 4, which represents the fourth generation of the 'Special Edition' iPhone, is anticipated to include an OLED display produced by a Chinese manufacturer.
9. What pricing options are available for accessing the report?
Pricing options include single-user, multi-user, and enterprise licenses priced at USD 4750, USD 5250, and USD 8750 respectively.
10. Is the market size provided in terms of value or volume?
The market size is provided in terms of value, measured in Million and volume, measured in Billion.
11. Are there any specific market keywords associated with the report?
Yes, the market keyword associated with the report is "OLED Market," which aids in identifying and referencing the specific market segment covered.
12. How do I determine which pricing option suits my needs best?
The pricing options vary based on user requirements and access needs. Individual users may opt for single-user licenses, while businesses requiring broader access may choose multi-user or enterprise licenses for cost-effective access to the report.
13. Are there any additional resources or data provided in the OLED Market report?
While the report offers comprehensive insights, it's advisable to review the specific contents or supplementary materials provided to ascertain if additional resources or data are available.
14. How can I stay updated on further developments or reports in the OLED Market?
To stay informed about further developments, trends, and reports in the OLED Market, consider subscribing to industry newsletters, following relevant companies and organizations, or regularly checking reputable industry news sources and publications.
Methodology
Step 1 - Identification of Relevant Samples Size from Population Database


Step 2 - Approaches for Defining Global Market Size (Value, Volume* & Price*)

Note*: In applicable scenarios
Step 3 - Data Sources
Primary Research
- Web Analytics
- Survey Reports
- Research Institute
- Latest Research Reports
- Opinion Leaders
Secondary Research
- Annual Reports
- White Paper
- Latest Press Release
- Industry Association
- Paid Database
- Investor Presentations

Step 4 - Data Triangulation
Involves using different sources of information in order to increase the validity of a study
These sources are likely to be stakeholders in a program - participants, other researchers, program staff, other community members, and so on.
Then we put all data in single framework & apply various statistical tools to find out the dynamic on the market.
During the analysis stage, feedback from the stakeholder groups would be compared to determine areas of agreement as well as areas of divergence
